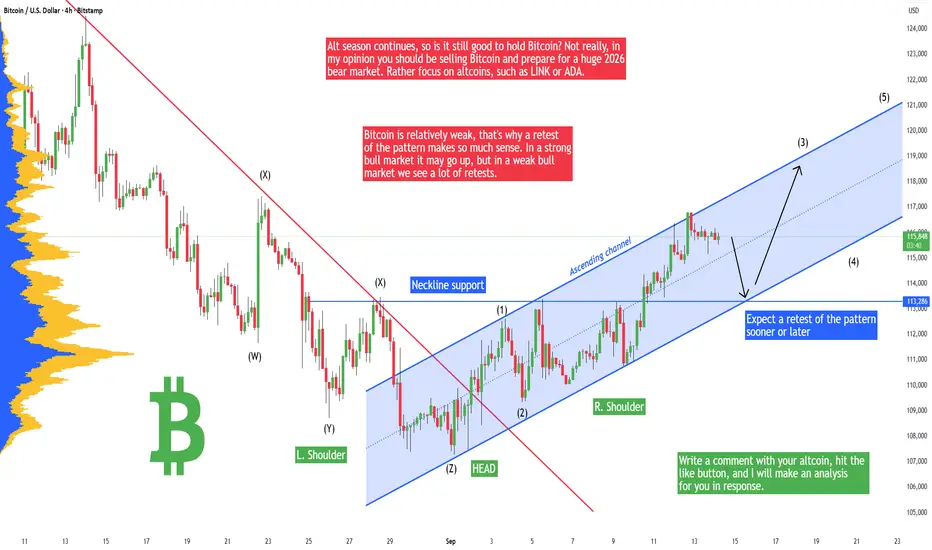
Bitcoin - Must go down to retest this pattern + new ATH soon!Bitcoin recently broke out of the head and shoulders pattern and made a pretty strong uptrend. That's a sign of strength that Bitcoin will be ready to continue in the uptrend and go to a new all time high, but not yet! I still think that Bitcoin should retest the previous Head and Shoulders pattern at around 113,300 USD. It's because this is an important liquidity level and there are a lot of orders from traders, in other words - it's a strong point of interest.
Alt season continues, so is it still good to hold Bitcoin? Not really, in my opinion you should be selling Bitcoin and prepare for a huge 2026 bear market. I expect Bitcoin to go down to 60k - 70k, but this is for another analysis. I really do not recommend buying Bitcoin, rather focus on altcoins, such as LINK or ADA. There is a potential of 50% to 200% profit in the next weeks, this is not possible on Bitcoin!
Bitcoin is relatively weak, that's why a retest of the pattern makes so much sense. In a strong bull market it may go up, but in a weak bull market we see a lot of retests. It's even possible that Bitcoin will go a little bit below the head and shoulders neckline to test the 112k level or so. So be prepared for it!
Write a comment with your altcoin + hit the like button, and I will make an analysis for you in response. Trading is not hard if you have a good coach! This is not a trade setup, as there is no stop-loss or profit target. I share my trades privately. Thank you, and I wish you successful trades!
Community ideas
Lingrid | GOLD Weekly Market Analysis - FOMC Catalyst AheadThe price perfectly fulfilled my previous weekly idea . OANDA:XAUUSD maintained its upward trajectory this week as investors positioned ahead of anticipated dovish policy shifts from major central banks, particularly the Federal Reserve. The precious metal's resilience signals growing expectations for an accommodative monetary environment that typically weakens fiat currencies and enhances gold's appeal.
Price action analysis reveals gold operating within a well-defined upward channel, with the metal successfully breaking above the triangle consolidation pattern near $3,440. The breakout of this formation, combined with bullish momentum indicators, suggests the path of least resistance remains to the upside. Key resistance now sits at the $3,700 ATH level, while the higher low structure around $3,275 provides critical support.
4H chart shows gold trading above a strategic swap zone between $2,580-$2,600, indicating institutional accumulation ahead of the Fed's rate decision. Monday's brief sell-off may occur showing profit-taking rather than a trend reversal, as buyers quickly might step in to defend these support levels.
With the Federal Reserve expected to signal a more accommodative stance, gold's fundamentals align with technical strength. The metal's ability to hold above the triangle breakout zone reinforces bullish conviction, targeting the psychological $3,700 resistance and higher levels. Any Fed dovishness should provide the catalyst for the next leg higher, potentially reaching new all-time highs as real yields decline and dollar weakness accelerates.
If this idea resonates with you or you have your own opinion, traders, hit the comments. I’m excited to read your thoughts!

USD/CAD - Bearish Flag (15.09.2025)The USD/CAD Pair on the M30 timeframe presents a Potential Selling Opportunity due to a recent Formation of a Bearish Flag Pattern. TRADENATION:USDCAD
This suggests a shift in momentum towards the downside in the coming hours.
Possible Short Trade:
Entry: Consider Entering A Short Position around Trendline Of The Pattern.
Target Levels:
1st Support – 1.3814
2nd Support – 1.3796
🎁 Please hit the like button and
🎁 Leave a comment to support for My Post !
Your likes and comments are incredibly motivating and will encourage me to share more analysis with you.
Best Regards, KABHI_TA_TRADING
Thank you.

XAUUSDHello Traders! 👋
What are your thoughts on Gold?
Gold has entered a corrective phase after printing a new high and is currently consolidating within a clearly defined channel.
The price is fluctuating inside this channel and may even test the lower boundary before continuing higher.
As long as gold remains within the channel, sideways to slightly downward movement can be expected in the short term.
A bullish breakout above the channel would likely act as a trigger for the next impulsive move, potentially leading to a new all-time high.
This week, the U.S. interest rate decision will be in the spotlight, which could significantly impact gold’s next move.
Wait for a confirmed breakout before entering long. Premature entries within the range may face choppy action.
Don’t forget to like and share your thoughts in the comments! ❤️

THE KOG REPORT THE KOG REPORT:
In last week’s KOG Report we said we would be looking for price to attempt the lower red box, and if held a move upside would be available into the box above. This move worked well for traders and the entry came exactly from our Excalibur red box. We then ideally wanted the higher box to give us a RIP, however, as you can see price broke above first on our indicators and then on the box shared with everyone else. Hence invalidating the short trade and activating the long which was then shared in our updates through the week.
We managed to trade between the boxes and of course Excalibur our trusted algo again performed with the pin point target levels.
A decent week in Camelot, not only on Gold, but on the other instruments we trade and analyse as well.
So, what can we expect in the week ahead?
I would expect Monday and early Tuesday to be the main days for movement before FOMC this week which may bring volume, but initial thoughts are we’re priced in! For that reason, we’ll share this report and say it’s applicable until Wednesday, which is when we will share the KOG Report for FOMC.
We have support below at the 3620-12 region which is a big range and will need to be monitored if attacked early in the week. If this level holds, an opportunity to long may be available to trades targeting the all time high again and most likely beyond in attempt for the 3700 region. It’s that region we would like to monitor again for a possible short, unless we break below the 3610 level.
The path shows the possible route, a move downside, then up where there are 3 levels to monitor, and a potential move downside in our opinion. It is as usual, subject to change and will be updated if through the week. For now, we’re still stretched with sentiment near neutral, we need to complete the swing upside with the key level of support being the 3606-10 level in extension. If we break below there, we have a clean reversal and what bears will want, is to see the low 3500’s at least! This level could be a possibility on Wednesdays FOMC, so stay tuned!!
In summary:
We want to see this move down commence so longs are with caution for us at the moment with the hope that one of these resistance levels can give us a major RIP. We need to monitor this carefully and will be implementing a scalp only strategy upside for now.
KOG’s Bias of the week:
Bullish above 3610 with targets above 3655, 3667, 3671 and above that 3686
Bearish on break of 3610 with targets below 3605, 3597, 3580, 3565 and below that 3540
RED BOX TARGETS:
Break above 3645 for 3654, 3657, 3670, 3685 and 3702 in extension of the move
Break below 3630 for 3620, 3610, 3605, 3597 and 3885 in extension of the move
Please do support us by hitting the like button, leaving a comment, and giving us a follow. We’ve been doing this for a long time now providing traders with in-depth free analysis on Gold, so your likes and comments are very much appreciated.
As always, trade safe.
KOG

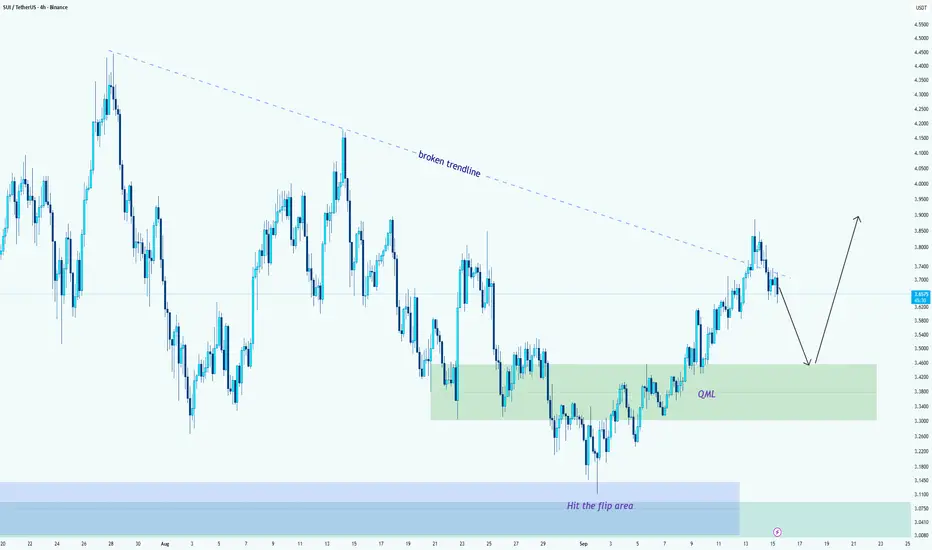
SUI/USDT --> Two-Step Setup: Retest QML, Then RallyHello guys!
Short version first: I expect a pullback to the QML (3.30–3.45), then a bounce that resumes the upside toward 3.80–3.90 (and potentially higher if momentum continues).
Why this makes sense (the plan):
Step 1 --> Pullback to QML:
Price broke the long descending trendline and impulsed higher, but the move is showing a normal two-leg structure: first leg up, now a corrective leg down. The green QML box (3.30–3.45) is the nearby demand zone and the most logical place for buyers to re-enter.
Step 2 --> Bounce & continuation:
If the QML holds and we get a bullish rejection (pinbar, engulfing, clear wick rejection, or a nice bullish close), the most likely path is a continuation back toward the recent supply area — 3.80– 3.90 as the first meaningful resistance. If momentum keeps, extensions toward the next structural highs become possible.
Final note
This is a two-step game: first, the retest, then the real trade. Don’t chase the breakout now; patience at the QML will give a cleaner, higher-reward setup.
The Final Ascent: BTC's $165K Launchpad Before the Great ResetBuckle up. This isn't just another chart; it's the roadmap for the most critical phase of Bitcoin's current cycle. We're witnessing the final act of a masterpiece play out right now, and understanding this structure is the key to navigating what comes next.
Here’s the brutal, beautiful truth laid out by the tape:
The Setup: From Compression to Ignition
Remember the agonizingly long consolidation? That was the massive Falling Wedge throughout 2022 and early 2023. It was a pressure cooker, squeezing out weak hands and building immense energy. The major breakout from that Falling Wedge was the spark. It wasn't just a rally; it was the official signal that the bull market was back on. That breakout launched us into the next, more powerful pattern the Rising Wedge.
The Current Play: The Rising Wedge Journey
We are now deep inside this ascending channel. Each higher high and each higher low is creating this converging pattern a classic Rising Wedge. This is the market's way of climbing a wall of worry on a wave of increasing optimism and liquidity. But make no mistake, this structure is inherently bullish yet exhausting. It's the final leg up, the last major push to suck in every last bit of momentum before the fuel runs out.
The Target: The Cycle Peak
The geometry of this wedge is pointing to a final, spectacular blow-off top. The most probable target for the peak of this wedge is $165,000. I wouldn't be surprised to see a slight extension in the euphoria that could tag $170,000, but that's the ceiling. Based on the rhythm of this move, the clock is ticking towards a November 2025 finale. Mark it.
The Inevitable: The Great Bear & The Golden Accumulation Zone
This is the most critical part. A Rising Wedge resolution is almost always the same: a violent breakdown. The fallout from this peak will be brutal a proper crypto winter. It will shake out every over leveraged dreamer. This bear market will find its ultimate bottom, its point of maximum financial opportunity, in the $54,000 - $60,000 zone. That is not a typo. That will be the generational buying opportunity. The mother of all dips. ACCUMULATE THERE.
The Next Chapter: The $500K Horizon
That 2027 bottom won't be the end. It will be the foundation for the next cycle. The recovery from that $60k zone will be the start of Bitcoin's next, truly historic run towards a target that seems crazy today $500,000. This isn't hopium; it's the logical progression of the four year cycle, adoption curves, and the patterns that have always governed this market.
The Bottom Line:
We are in the final, parabolic stage. Target $165K+ by Nov 2025. Then, prepare for the storm. The real-life changing wealth won't be made at the top; it will be made by those with the courage and dry powder to buy relentlessly in the $54k-$60k pit of despair in 2027.
This is the plan. Trade accordingly.

President Trump Speaks, Israel Strikes—What’s Gold Gonna Do?Hey Guys,
It’s been a while since I dropped a gold chart. Got a ton of requests—so here’s a fresh swing setup for you.
Fundamentally, President Trump recently said “Trump says his patience with Putin is running out.” That kind of statement adds fuel to gold’s upside. Plus, Israel’s attacks in the Middle East are also pushing gold higher.
Right now, gold’s in a resting phase. But I’m expecting a move toward $3700 either this week or next.
Technically, I’m seeing a clean bull flag pattern.
I always work with both fundamentals and technicals. That’s why my swing target is $3700.
Every like you send is my biggest motivation to keep sharing these setups. Big thanks to everyone backing me.

TradeCityPro | Bitcoin Daily Analysis #176👋 Welcome to TradeCity Pro!
Let’s go for a different kind of Bitcoin analysis today. I’ve used a new color theme on the chart—let me know in the comments whether you like this theme or prefer the previous one.
⌛️ 4-Hour Timeframe
In the 4-hour timeframe, Bitcoin had formed a descending channel, moving lower with a bearish structure of lower highs and lower lows toward the 107,000 support zone.
✔️ After reacting to this support, price climbed toward the channel’s top. Following one false breakout, it managed to break the channel on the next attempt and moved toward the channel trigger at 113,222.
💥 This move came with rising volume, which boosted bullish momentum and increased the likelihood of breaking 113,222.
✨ With the breakout of 113,222, Bitcoin’s main upward wave began, and price is now heading toward the next resistance at 116,960, which it is already approaching.
🧩 Over the last few candles, volume has dropped significantly, mainly because it’s the weekend. If volume starts to pick up with the new week, the probability of breaking 116,960 will increase.
🔑 A breakout above 116,960 could serve as the next long trigger, while Bitcoin’s key major resistance remains at 121,188.
❌ Disclaimer ❌
Trading futures is highly risky and dangerous. If you're not an expert, these triggers may not be suitable for you. You should first learn risk and capital management. You can also use the educational content from this channel.
Finally, these triggers reflect my personal opinions on price action, and the market may move completely against this analysis. So, do your own research before opening any position.

Gold Market Technical Outlook and Key Levels BULLS/BEARS📊 Technical Outlook Update — Gold (H4)
As of 15 Sep 2025
• Spot is holding ~$3,640–3,650/oz after last week’s record spike; price is consolidating since.
• On futures, settlement came in $3,686.40 (Sep 12) with a short-term “bullish breakout” narrative into today’s session.
🏆 Bull Market Overview
▪️ Massive rally now pausing below $3,700; momentum stalling under headline resistance.
▪️ Overhead resistances will limit upside:
— $3,700 (first major cap) • $3,750 (stretch/overshoot)
▪️ Key S/R zones (now):
— Resistance: $3,700 / $3,750
— Support: $3,600 / $3,500 / $3,400 (step-downs)
▪️ Bias: short-term limited upside after the run; risk of liquidity sweep lower before trend resumes.
▪️ October roadmap: looking for a re-test near $3,500 later in the month to reload bullish flow/liquidity.
▪️ Volatility: elevated vs. summer; headline-sensitive into the Fed this week.
⭐️ Recommended Strategy (H4 game plan)
▪️ Sell the first tests into $3,700 / $3,750 with tight risk; fade wicks.
▪️ Buy the dip into $3,600 → $3,500 → $3,400 zones; scale entries, keep stops beyond structure.
▪️ Momentum traders: wait for clean H4 close above $3,700 to target $3,730–$3,750; otherwise fade spikes.
▪️ Position traders: patient bids $3,520–$3,480 zone preferred for October reload.
▪️ If flat right now: no chase—let price come to your levels.
Latest gold market updates
📈 Post-CPI pop kept spot above $3,640, reinforcing dip-buying interest even as the dollar firmed.
📰 Technicians flag bullish breakout dynamics despite intraday chop; futures settled $3,686.40 (Sep 12) ahead of fresh catalysts.
🧭 Context: market is consolidating beneath record highs set last week; pullbacks seen as tactical within a larger uptrend.
Level map
R2: $3,750 (bulls’ stretch / likely exhaust on first touch)
R1: $3,700 (primary cap; fade unless impulsively reclaimed)
S1: $3,600 (first bounce zone; liquidity magnet)
S2: $3,500 (October re-test area to accumulate)
S3: $3,400 (deeper flush / high-conviction buy zone)

GOLD → A s.triangle against the backdrop of a bullish trend... FX:XAUUSD is consolidating in anticipation of positive news from the Fed, namely a cut in interest rates. Against this backdrop, the dollar is falling, which only supports the price of gold...
Gold is trading in a sideways range around $3650 at the start of a week packed with central bank events. Despite the lack of a clear direction, the metal is finding support thanks to several factors.
Key drivers: Weak economic data from China, anticipation of the Fed's decision: On Wednesday, the Fed will almost certainly cut rates by 25 basis points, but there is a chance of 50 basis points. This supports gold.
The tone of Powell's comments will determine expectations for further cuts.
Technically, gold remains stable ahead of key events. China's weak economy and the Fed's dovish policy limit the potential for decline. A break above $3650 is possible with dovish signals from the Fed or an escalation of trade risks.
Resistance levels: 3646, 3657, 3675
Support levels: 3630, 3620, 3600
As part of the formation of a “symmetrical triangle” consolidation, I will consider a retest of the consolidation support with the possibility of further growth (distribution).
Sincerely, R. Linda!

XAU/USD Stalls Slightly above 3650 – Bulls Losing Steam?Gold printed fresh all-time highs at 3674 last week, only to reverse sharply and settle into a sideways structure between 3620–3655.
The current debate: is this simply a consolidation box that will fuel another breakout, or is the market quietly building a distribution top that could resemble a triple top pattern (if we ignore the spike to ATH)?
Technically, the momentum has clearly cooled. The 3355–3360 area continues to cap the upside, turning into a stubborn barrier that bulls haven’t been able to overcome.
From a fundamental angle, the Fed’s rate cut is already baked into the price. The focus is now on Powell’s guidance. With inflation pushing higher, a cautious and balanced tone is more likely than a dovish surprise.
Cross-checking with other pairs, XAU/EUR and XAU/GBP are already pressing their support levels. That relative weakness suggests the gold complex as a whole may be closer to a downside break than to a new leg up.
For now, I’m flat. But unless bulls regain control quickly, I’ll be watching for failed rallies after London open as potential short setups.

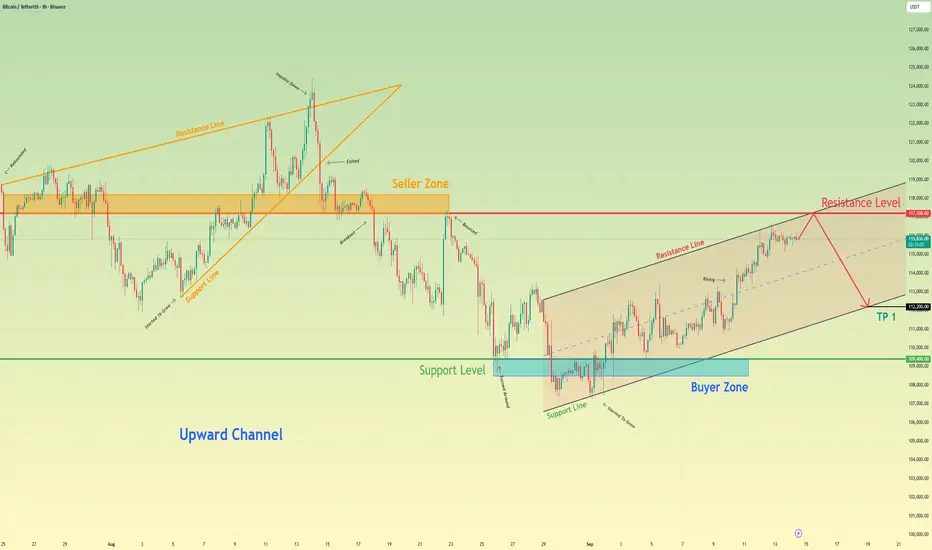
Bitcoin will start to correction after touching resistance levelHello traders, I want share with you my opinion about Bitcoin. The established market structure for Bitcoin remains bullish, with the price action being methodically guided higher within a well-defined upward channel. This pattern has been in effect since the resolution of a prior upward wedge, creating a clear sequence of higher highs and higher lows between its support and resistance lines. The price of BTC has just completed another full rotation from the channel's support and has now arrived at a critical inflection point. Currently, the asset is directly testing the upper boundary of the channel, a level which forms a powerful confluence of resistance with the horizontal 118200 - 117200 seller zone. The primary working hypothesis is a short, corrective scenario, based on the high probability that the channel's resistance will be respected. A confirmed rejection from this area would signal that the current upward impulse is exhausted and a downward rotation towards the channel's support is underway. Therefore, the TP for this rotational play is logically placed at 112200 points. This target aligns perfectly with the ascending support line of the channel, representing the most probable objective for a corrective move of this nature. Please share this idea with your friends and click Boost 🚀
Gold will correct to support area and then continue to growHello traders, I want share with you my opinion about Gold. The market context for Gold has been firmly bullish, with the price action being guided by a well-established upward channel that has defined the trend for a significant period. The structure of this channel has been confirmed by multiple rotations between its support and resistance lines, originating from the deep 3370 - 3390 buyer zone. Currently, after a rejection from the channel's highs, the price of XAU is undergoing a healthy corrective phase. This pull-back has brought the asset into a critical confluence of support, defined by the 3635 - 3615 support zone and the ascending support line of the channel itself. The primary working hypothesis is a long, trend-continuation scenario, which anticipates that buyers will step in to defend this key support cluster. A confirmed bounce from this area would signal the conclusion of the corrective move and the resumption of the dominant upward trend. This would likely initiate the next impulsive wave higher within the channel's structure. Therefore, the TP is logically placed at 3740 points, representing a new potential structural high and a measured objective for the next impulsive wave. Please share this idea with your friends and click Boost 🚀

XAUUSD Looks Ready for a Big MoveHey everyone, Ken here!
Looking at the XAUUSD chart today, I see a lot of interesting things. The price isn’t rushing upward, but moving step by step – almost like buyers are slowly taking control.
Personally, I won’t jump in just yet. I’d like to see a clear rejection first. If that scenario plays out, my target would be around 3,683 .
What really matters here isn’t just the number, but patience. I’ll wait for price to return to the marked level, then watch volume and candlestick patterns for confirmation.
What about you? Do you think this setup makes sense? Share your thoughts in the comments!

Gold 30Min Engaged ( Bullish entry Detected )Time Frame: 30-Minute Warfare
Entry Protocol: Only after volume-verified breakout
🩸Bullish Movement From : 3645
➗ Hanzo Protocol: Volume-Tiered Entry Authority
➕ Zone Activated: Dynamic market pressure detected.
The level isn’t just price — it’s a memory of where they moved size.
Volume is rising beneath the surface — not noise, but preparation.
🔥 Tactical Note:
We wait for the energy signature — when volume betrays intention.
The trap gets set. The weak follow. We execute.

EURUSD – Bullish Technical Outlook Still Intact👋Hello everyone, what do you think about the trend of FX:EURUSD ?
As of now, EURUSD is moving as expected, with the pair trading around 1.174 at the start of the week.
EURUSD is approaching a significant resistance zone around 1.1800, with the first target at 1.176 already tested. From a technical standpoint, the pair is in a clear uptrend, supported by the trendline and two EMA lines, with strong bullish momentum in play, following the trajectory of an Ascending Triangle pattern.
The target to break through remains 1.1800. If the price breaks this level, we could see the next leg of the rally towards 1.1900 or even higher. Watch for a solid confirmation before entering the trade for a safer position.
What do you think about EURUSD? 💬Share your thoughts in the comments!
Good luck!

Where Is ETH Going This Cycle? (Educational Perspective)
Every cycle brings the same question:
Where is Ethereum heading next? Most look for price guesses, but that’s a distraction. The real advantage comes from knowing what factors will drive ETH’s direction. Understanding the drivers doesn’t require prediction, it requires planning.
A Look Back: ETH in Previous Cycles
Ethereum has repeatedly proven its resilience and innovation leadership:
2016–2017: Breakout fueled by ICO boom—ETH became the token-launch backbone.
2018–2019: Bear market and ICO collapse—but builders persisted.
2020–2021: DeFi and NFT surge—Ethereum powered the blockchain economy as “digital oil.”
2022–2023: Post-Merge era—transition to PoS and reduced issuance amid regulatory uncertainty.
Through every phase, ETH stayed central to crypto’s evolution.
On-Chain Metrics to Watch
Ethereum’s transparency lets us monitor structural strength in real time:
Active addresses gauge real network use.
Staking levels shrink available supply—over 35M ETH (≈30%) staked by mid-2025.
ETH locked in DeFi reflects collateral demand.
Gas fee burn continues to tighten supply post-EIP-1559.
Macro & Narrative Drivers (2024–2025 Upgrades & ETF Momentum)
Stories move markets, and Ethereum has some strong ones now:
Spot ETH ETF Launch: Nearly $500M in institutional inflows since mid-2024.
Staking Supply Constraint: Record ETH locked → tighter supply.
Technical Enhancements: Dencun (2024) and Pectra (2025) improving scalability and validator usability.
Regulatory & Macro Tailwinds: GENIUS Act, institutional adoption, favorable policies.
The Real Question Traders Should Ask
Price targets are clickbait. The real question is:
“Which factors will move ETH this cycle?”
By tracking ETF flows, staking ratios, upgrades, and macro conditions, traders avoid being surprised.

GBPUSD consolidating, with a rejection forming from the 1.3550GBP/USD Technical Analysis The pair has been consolidating, with a rejection forming from the 1.3550 resistance level. This signals weakening bullish momentum.
The British Pound fell on Friday after UK GDP data showed the economy stagnated in July (0.0% vs. +0.4% in June). Manufacturing output, accounting for 9% of GDP, declined by 1.3% Mom. Despite this, GBP/USD still posted its second straight weekly gain, supported by expectations ahead of next week’s Bank of England (BoE) policy meeting.
Technical Levels to Watch:
If GBP/USD continues to reject 1.3550, the structure favours a bearish retracement toward 1.3450 and potentially 1.3401. However, sustained trade above 1.3550 would invalidate the bearish bias and could open the way for renewed upside momentum.
Ig You Like this idea if you have ay idea about this analysis share in comments for better work

XAU/USD (Gold vs USD) on the 30-minute chart.XAU/USD (Gold vs USD) on the 30-minute chart
From my chart setup:
Price is consolidating in a symmetrical triangle formation.
I have drawn breakout projections with two target points.
📌 Based on my chart:
First target: around 3675 USD
Second target: around 3685–3690 USD
These levels are my breakout projections if gold breaks upward from the triangle.

Bitcoin: Bullish Engulfing Setup Into FOMC Week.Bitcoin has formed a minor impulse structure and is currently showing a potential wave 4. The fact that it has initially rejected the 116K area resistance, but has barely retraced is a sign of strength. No wave 1, wave 4 overlap lap means a bullish wave 5 is more likely. A 5th wave can see price testing the 118 to 120K area this week. This puts my B wave scenario that I spoke about a week earlier into question which is the nature of subjective wave counts and why it is important to stay flexible.
This week we have the FOMC meeting where the FED is expected to cut interest rates by AT LEAST 25 basis points with an increasing possibility of a greater cut. Keep in mind the 25 point scenario is priced in. If they cut as expected, the focus will be on the press conference and how Powell responds to questions. This is where the market can fluctuate wildly depending on what hints he provides about future rate cuts, etc. Such a catalyst can be substantial enough to push Bitcoin into the 120K area, which will also move the other major markets dramatically as well.
What will invalidate the current bullish setup is a break back below the 113K support. IF this occurs as a result of the upcoming meeting, or any other reason, it will strengthen my B wave argument that I made the week earlier. So at this time, swing trade longs make sense, just be prepared for a dramatic change. IF for whatever reason price tests the 123Ks or higher, that will point to a potential run to the 130KS because it will confirm the current formation is still part of a broader wave 4. Yes it can be confusing, and when it is, focus more on the market structure itself.
Thank you for considering my analysis and perspective.
XAUUSD Short: Correction After the All-Time HighHello, traders! The prior market structure for XAUUSD was a prolonged consolidation range, from which the price broke out with significant bullish momentum. This breakout initiated a powerful upward trend, with the price auction pushing through multiple resistance levels to establish a new all-time high. This marked the climax of the recent buying initiative.
Currently, following the peak at the ATH, the market has entered a corrective phase. Sellers have taken control in the short term, and the price is now declining from the highs. The auction is presently challenging the first major demand zone located between 3585 and 3570, but the bearish momentum appears strong.
The primary scenario anticipates a continuation of this corrective move. The expectation is that the current 3570 demand level will fail to hold against the selling pressure. A confirmed breakdown below this demand zone would validate the short thesis and open the path for a deeper correction towards the main ascending trend line. The take-profit is therefore set at 3565, targeting the area immediately following this breakdown. Manage your risk!

GOLD 1H CHART ROUTE MAP UPDATE & TRADING PLAN FOR THE WEEKHey Everyone,
Please see our updated 1h chart levels and targets for the coming week.
We are seeing price play between two weighted levels with a gap above at 3653 and a gap below at 3622. We will need to see ema5 cross and lock on either weighted level to determine the next range.
We will see levels tested side by side until one of the weighted levels break and lock to confirm direction for the next range.
We will keep the above in mind when taking buys from dips. Our updated levels and weighted levels will allow us to track the movement down and then catch bounces up.
We will continue to buy dips using our support levels taking 20 to 40 pips. As stated before each of our level structures give 20 to 40 pip bounces, which is enough for a nice entry and exit. If you back test the levels we shared every week for the past 24 months, you can see how effectively they were used to trade with or against short/mid term swings and trends.
The swing range give bigger bounces then our weighted levels that's the difference between weighted levels and swing ranges.
BULLISH TARGET
3653
EMA5 CROSS AND LOCK ABOVE 3653 WILL OPEN THE FOLLOWING BULLISH TARGETS
3678
EMA5 CROSS AND LOCK ABOVE 3678 WILL OPEN THE FOLLOWING BULLISH TARGET
3702
EMA5 CROSS AND LOCK ABOVE 3702 WILL OPEN THE FOLLOWING BULLISH TARGET
3727
EMA5 CROSS AND LOCK ABOVE 3727 WILL OPEN THE FOLLOWING BULLISH TARGET
3747
EMA5 CROSS AND LOCK ABOVE 3747 WILL OPEN THE FOLLOWING BULLISH TARGET
3768
BEARISH TARGETS
3622
EMA5 CROSS AND LOCK BELOW 3622 WILL OPEN THE FOLLOWING BEARISH TARGET
3585
EMA5 CROSS AND LOCK BELOW 3585 WILL OPEN THE SWING RANGE
3556
3528
As always, we will keep you all updated with regular updates throughout the week and how we manage the active ideas and setups. Thank you all for your likes, comments and follows, we really appreciate it!
Mr Gold
GoldViewFX
