Bitcoin - Bulls vs Bears: $106k or New ATH?Bitcoin saw a sharp and aggressive drop following Donald Trump’s surprise announcement of a 50% tariff on EU imports. The sudden macro shock triggered broad risk-off flows, with BTC quickly selling off from local highs near 111.3K and tapping into a key fair value gap around 107.5K. Although we’ve seen a short-term bounce since that low, it’s not a convincing bullish reversal. Momentum remains fragile, and the overall structure still favors caution as we trade within a compression zone formed post-drop.
Key Technical Zones
We’re currently trapped between two major 1H fair value gaps that serve as clear boundaries for market direction. The lower zone around 107.5K has provided temporary support, acting as a reaction point after the dump. This FVG was left behind during the early-May rally and is now being tested for the first time. On the flip side, price was rejected earlier today from the upper 1H FVG at 109.8K to 110.7K, which previously served as the base of the last breakdown candle. That rejection confirms sellers are active at that level, and it’s now acting as resistance.
We’re essentially in a deadlock between demand and supply, and the next break will determine directional bias for the next major leg.
Bullish Scenario
If bulls can reclaim the 109.8K–110.7K area with strength and close above it convincingly, that would indicate demand has absorbed the supply in that zone. Ideally, we’d want to see a clear bullish displacement to confirm strength, not just a weak grind. In that scenario, BTC could make its way back toward the previous highs and retest the higher resistance zone around 112K. This level lines up with a larger supply zone and could become a key magnet if the market shifts risk-on again or if shorts begin to unwind.
Bearish Scenario
On the flip side, if BTC fails to hold the lower FVG and breaks below 109K with a strong bearish candle or wick rejection from the upper range, it opens the door for further downside. The next target would be the clean liquidity pool near 106K, which is supported by a price inefficiency and unmitigated demand just below. This level also aligns with prior consolidation structure and would be a logical place for a deeper retracement following the news-driven shakeout.
Market Context and Decision Point
This is a compression structure formed after a high-volatility event, so it’s important not to get trapped in the middle of the range. Price is coiling between two well-defined FVGs, and whichever one gives way will likely trigger the next expansion move. Look for signs of displacement impulsive candles, clean breaks, and follow-through, to validate which side is in control. Until then, patience is key. Let price choose the path and then follow the momentum.
Price Target and Expectations
✅ Break and hold above resistance FVG → target 112K
🚩 Break and lose the support FVG → target 106K
Conclusion
Bitcoin is stuck in a tight battle between bulls and bears following a heavy news-driven drop. The current 1H FVG range offers a textbook breakout setup, with both sides clearly defined. This is not the time to force trades inside the chop. Wait for a clean break, then position for the follow-through. The resolution of this range will likely dictate direction soon, especially as the market continues to digest the macro developments.
___________________________________
Thanks for your support!
If you found this idea helpful or learned something new, drop a like 👍 and leave a comment, I’d love to hear your thoughts! 🚀
Community ideas

WC: 33.03 Target: 1800-2400 MOASS: 47k-100K: TICK TOCKIt would be easy to be really hyperbolic with my tone and words right based on the latest price action...but I'm NOT going to be
I am a TRADER and in order to extract profit consistently over time its important to manage the PSYCHOLOGICAL aspect of trading well i.e. your emotions
That's why I going to focus on only the TECHNICALS because THAT, for me, is what's going to ensure that I see as much PROFIT as possible from this trade:

BITCOIN - Price will continue to grow inside rising channelHi guys, this is my overview for BTCUSDT, feel free to check it and write your feedback in comments👊
Price started to grow inside rising channel, where it declined to support line and then bounced up to $93100 level.
BTC broke this level at once and then some time traded near, after which bounced and continued to grow.
Soon BTC made a correction, but quickly turned around and later rose to $104900 level, after which started to decline.
After price fell a little, it made an upward impulse to resistance line of channel, breaking $104900 level.
But not long time ago, BTC bounced from this line and started to decline, so I think that price can continue to fall.
Also, I expect that price will fall to support area and then turn around and continue to grow in channel to $113700
If this post is useful to you, you can support me with like/boost and advice in comments❤️

Gold Enters PRZ and TRZ – Correction is Coming!?Gold ( OANDA:XAUUSD ) moved as I expected in the previous Idea and reached the Resistance zone($3,387-$3,357) and Resistance lines .
Gold is moving near the Resistance lines , Resistance zone($3,387-$3,357) , Potential Reversal Zone(PRZ) and Time Reversal Zone(TRZ) .
Also, we can see the Regular Divergence(RD-) between Consecutive Peaks .
In terms of Elliott Wave theory , Gold appears to be completing microwave 5 of Main wave 3 , so Main wave 3 could have an extended structure .
I expect Gold to experience at least one correction after entering the PRZ and TRZ , the correction could continue to $3,329 . If the Support lines are broken, the next target could be the Support zone($3,280-$3,245) .
Note: If Gold touches $3,420, there is a possibility of further pumping and breaking the Resistance zone($3,435-$3,406).
Gold Analyze ( XAUUSD ), 2-hour time frame.
Be sure to follow the updated ideas.
Do not forget to put a Stop loss for your positions (For every position you want to open).
Please follow your strategy; this is just my idea, and I will gladly see your ideas in this post.
Please do not forget the ✅' like '✅ button 🙏😊 & Share it with your friends; thanks, and Trade safe.

Bitcoin Be Setting Bull Trap?_Breakout Without High VolumeBitcoin ( BINANCE:BTCUSDT ) started to fall yesterday after forming a new All-Time High(ATH) with high volume , but started to rise again. One of the reasons for Bitcoin’s sudden drop yesterday was the sharp drop in the S&P 500 ( SP:SPX ) index .
First of all, I must say that Bitcoin’s situation is a bit complicated and difficult to analyze , so pay more attention to money management. Be prepared for any scenario.
Bitcoin is trading above the Resistance zone($109,588-$105,820) and near the Resistance lines and Cumulative Short Liquidation Leverage($113,020-$111,833) . What is worrying is that the break of the Resistance zone($109,588-$105,820) was NOT accompanied by high volume , suggesting a bull trap is possible .
I see a correction to at least Cumulative Long Liquidation Leverage($109,972-$108,609) given the low breakout volume for Bitcoin and the large sell orders in the upper prices for Bitcoin .
--------------------------------------------
Today, the Flash PMI data from the U.S . came in stronger than expected:
Flash Manufacturing PMI: 52.3 (vs. forecast 49.9, previous 50.2)
Flash Services PMI: 52.3 (vs. forecast 51.0, previous 50.8)
Analysis :
Both numbers exceeded expectations, signaling stronger economic activity in the U.S. This is bullish for the USD( TVC:DXY ) and could put short-term downward pressure on Bitcoin, as it lowers the chances of near-term Fed rate cuts.
--------------------------------------------
Do you think Bitcoin is completing a Bull Trap or should we expect Bitcoin to increase further?
Note: If Bitcoin breaks above $114,500 with high momentum, we can expect Bitcoin to rise to near $119,000.
Please respect each other's ideas and express them politely if you agree or disagree.
Bitcoin Analyze (BTCUSDT), 1-hour time frame.
Be sure to follow the updated ideas.
Do not forget to put a Stop loss for your positions (For every position you want to open).
Please follow your strategy and updates; this is just my Idea, and I will gladly see your ideas in this post.
Please do not forget the ✅' like '✅ button 🙏😊 & Share it with your friends; thanks, and Trade safe.

TradeCityPro | Bitcoin Daily Analysis #100👋 Welcome to the 100th Bitcoin Analysis!
I'm really happy we've shared this 100-day journey together, and I hope you've been able to benefit from these analyses along the way.
💥 Every single analysis I've posted so far has been the basis for real trades that I've taken myself. I'm glad to say the overall result of those trades has been profitable, and I hope your results have been positive too.
⚡️ Today, I want to do a full multi-timeframe breakdown of Bitcoin and other major crypto indices. Let’s dive in and see where the market stands.
💰 Bitcoin Analysis
📅 Weekly Timeframe
As you can see, in the weekly chart, Bitcoin reacted to an ascending curved trendline during its recent correction phase and retraced up to around 72,147.
💫 On the RSI, we also have a key support level at 44.75, which has held again. The combination of this support with the curved trendline has created a potential PRZ (Potential Reversal Zone), and price has since resumed its upward move.
✔️ Last week’s candle managed to close above the resistance at 104,919 for the first time ever. Many in the market expected that a weekly close above this level would trigger a sharp rally toward 130,000 or even 160,000.
📊 However, that hasn’t happened—this week’s candle is still small and lacks strong bullish momentum.
✨ We can now view the range between 104,919 and 108,454 as a resistance zone. Although the price has entered this zone, we haven’t yet confirmed a breakout. That confirmation would come with a weekly close above 108,454.
📈 Despite the strong momentum before breaking ATH, price seems to be losing steam now. That’s not necessarily bad—it’s actually expected, since this area is one of the most important supply zones for Bitcoin and won’t break easily.
🔽 If price gets rejected and this move turns out to be a fakeout, there’s a real possibility of a trend reversal. We’ve got a potential double top forming, which is usually the first signal of a reversal. If price then breaks the 72,147 support, it would confirm the end of the current uptrend. A lower high and lower low afterward would confirm a new downtrend.
⭐ At this point, I can’t give you a new spot-buy trigger in this timeframe. The trigger was around the curved trendline. Since price has moved away, we need to wait for a new setup to form.
Let’s check lower timeframes for more detailed price action.
📅 Daily Timeframe
In the daily chart, after getting support at 76,087, price started moving up and with the breakouts of 87,700 and 91,953, the bullish phase began.
🔍 Currently, price is holding above 106,250 with increasing volume since the 91,953 breakout. Everything looks ready for Bitcoin to begin its main move and enter an extension leg up.
🚀 If this happens, price could target 129,000 and even 150,000. RSI will be key for confirmation—if it re-enters Overbought territory and holds above 77.81, higher targets become more likely.
🛒 The previous spot-buy triggers I gave were at 87,700 and 91,900. If you entered with those, I recommend holding for now and waiting for signs of a trend change before taking profits.
🔔 If you didn’t buy earlier, I can’t provide a new entry just yet—we need to wait for a new structure and trigger to form.
🔽 For now, I still see the trend as bullish. A bearish scenario would require a fakeout below 106,250—if price drops and forms a lower high and lower low, the uptrend would be over and a downtrend would begin.
⏳ 4-Hour Timeframe
After breaking 106,250, price rallied to 111,826 and is now pulling back to 106,250.
✔️ RSI is holding above its local support at 44.48, and as long as it stays above that level, market momentum remains bullish.
📈 You can consider entering a long on a pullback to 106,250. A breakout above 111,826 would be the main trigger for a new long.
🔑 Right now, there’s no valid reason to short, so it’s best to wait for a clear bearish structure before considering that.
👑 Bitcoin Dominance (BTC.D)
📅 Weekly Timeframe
After several green weekly candles, BTC.D printed a large red candle, pulling back toward the midline of its ascending channel and rejecting from 64.77. However, it’s now moving back up again.
💥 With this strong momentum, there’s a good chance BTC.D could break out of the channel. If 64.77 breaks, we could see a push toward 71.04.
⚡️ To confirm a bearish reversal in BTC.D, we’d need to see a breakdown below the lower trendline of the channel. That would likely signal the start of an altseason.
📅 Daily Timeframe
BTC.D has been in an uptrend and even broke above its channel briefly. But after hitting 65.31, it started a correction and dropped to the midline at 62.22.
🎲 It quickly bounced from 62.22 and is now moving upward again. Given the bullish structure, it could retest the 65.31 high.
📈 If it forms a lower high and breaks below 62.22, that would confirm a trend reversal. A breakout above 65.31 would confirm continuation of the uptrend.
⏳ 4-Hour Timeframe
BTC.D rallied to 64.31 and is now trying to retest that level. If it breaks above 64.31, the next target is 65.41.
🧲 If it forms a lower high and breaks 63.51, we’d get a confirmation that the bullish leg has ended, increasing the chances of a move to 62.17.
✔️ Total2 (Altcoin Market Cap Excluding BTC)
📅 Weekly Timeframe
After breaking the curved trendline, Total2 fell to around 816B before bouncing alongside Bitcoin.
⚡️ Currently, it’s ranging between 1.15T and 1.26T for the past three weeks.
🧩 If price breaks this range, it could rally toward 1.61T, which is the most important supply zone for Total2. A breakout here would likely trigger a strong altcoin rally.
🛒 If that breakout coincides with a drop in BTC.D, it would be an excellent spot-buy opportunity for altcoins.
📊 If the current rally fails to reach 1.61T and forms a lower high, another drop toward 816B is likely. This time, the chance of breaking that support would be high—confirming a trend reversal.
📅 Daily Timeframe
Price is stuck in a range between 1.15T and 1.26T.
🔼 A breakout from either side would likely lead to a strong move. A break below 1.15T could extend the decline toward 861B, while a break above 1.26T would target 1.62T.
⏳ 4-Hour Timeframe
Same structure as the daily chart. Long trigger = 1.26T breakout. Short trigger = 1.15T breakdown.
🔑 If price forms a higher low and starts moving back up, the likelihood of breaking 1.26T increases. The next target would be 1.33T.
✔️ USDT Dominance (USDT.D)
📅 Weekly Timeframe
USDT.D is ranging between 3.78 and 6.22.
📉 It recently formed a lower high below 6.22 and broke below 5.06, now heading toward 3.78.
🤔 If USDT.D drops to 3.78, we could see a major market rally—Bitcoin might move toward 130,000 or 160,000.
🚀 If 3.78 breaks, the next support is at 2.53, which would mark the start of a major bull run.
📅 Daily Timeframe
USDT.D has hit support at 4.40 and is now approaching a descending trendline that’s been holding since the 6.22 top.
📈 If that trendline breaks, the trigger is at 4.70. A breakout here could lead to a move to 5.02.
🔽 If price gets rejected again, the short trigger is at 4.40, and the next support is at 3.81.
⏳ 4-Hour Timeframe
Support at 4.38 has held, and price is now above 4.50 and approaching the trendline.
🎲 If 4.50 fails and price drops to 4.40, a break below 4.40 confirms a bearish continuation.
📊 If the trendline breaks, use 4.74 as your confirmation trigger.
❌ Disclaimer ❌
Trading futures is highly risky and dangerous. If you're not an expert, these triggers may not be suitable for you. You should first learn risk and capital management. You can also use the educational content from this channel.
Finally, these triggers reflect my personal opinions on price action, and the market may move completely against this analysis. So, do your own research before opening any position.

Will Trump's Tariffs Propel Gold Past 3,500 ? Again ? On May 23rd's U.S. trading session, Trump's tariff announcements on the EU and Apple roiled markets like a tempest 🌪️. He proposed a staggering 50% tariff on EU products starting from June 1st, citing unfair trade practices. Meanwhile, he threatened Apple with a 25% tariff if iPhones sold in the U.S. weren't manufactured domestically.
This sent gold prices soaring sky - high 🚀. As a reliable safe - haven, gold spiked as investors, deeply worried about the potential global economic impacts, rushed to safeguard their wealth. The 3280 support level for gold, which had been holding firm in the preceding days, became even more crucial as the upward momentum strengthened, like a sturdy anchor in stormy waters ⚓.
If the tariff issue remains unresolved and tensions continue to simmer between the U.S., the EU, and major corporations like Apple, the upward trajectory of gold prices is likely to persist. Analysts predict a good chance it could break the 3,500 mark, as if a new peak is waiting to be conquered 🏔️. Tariffs disrupt global supply chains and raise U.S. inflation fears, driving investors to gold for protection against economic and currency risks, much like sailors seeking a safe port in a typhoon 🌊.
⚡️⚡️⚡️ XAUUSD ⚡️⚡️⚡️
🚀 Buy@ 3340 - 3360
🚀 TP 3400 - 3450
Accurate signals are updated every day 📈 If you encounter any problems during trading, these signals can serve as your reliable guide 🧭 Feel free to refer to them! I sincerely hope they'll be of great help to you 🌟 👇

GOLD trending higher: Can buyers push towards 3,350$?Right now OANDA:XAUUSD is a classic case of a market trading within an ascending channel, with price action consistently respecting both its upper and lower borders.
The price has broken above a clear resistance zone and may pull back for a retest. This area also happens to coincide with the golden pocket of the recent swing and so it deserves special attention. If it holds as support, then that would be a confirmation of the bullish structure with the most likely possibility of a move towards 3,350, the middle side of the channel.
As long as the price stays above this support zone, the validity of the bullish setup is still there. If it does not, the short-term bullish outlook would therefore be interrupted and might be followed by further downside pullback.
Be sure to use proper risk management always.

Solana Potential UpsidesHey Traders, in today's trading session we are monitoring SOL/USDT for a buying opportunity around 166 zone, SOL/USDT is trading in an uptrend and currently is in a correction phase in which it is approaching the trend at 166 support and resistance area.
Trade safe, Joe.

Gold may break resistance level and then continue to growHello traders, I want share with you my opinion about Gold. In this chart, price previously formed a clear triangle pattern, where price was squeezed between two converging trend lines. After a period of consolidation, the market broke above this formation, reaching the resistance zone near 3365, but then started to retrace. Following that breakout, a new structure emerged, an upward wedge. The asset has been moving within this narrowing channel, forming higher lows and approaching the upper boundary with weakening momentum. This type of pattern often signals an upcoming strong move once the price breaks out from either side. Currently, Gold is trading near the resistance line of the wedge and just beneath the seller zone. I expect that the price may fall back to the support line of the wedge around the 3205 - 3185 area. After that, a bounce from this zone could trigger a bullish breakout from the wedge. That’s why I set my TP 1 at the 3420 level, this target aligns with a full wedge breakout and continuation of the upward movement through the resistance level and beyond the seller zone. Please share this idea with your friends and click Boost 🚀
Disclaimer: As part of ThinkMarkets’ Influencer Program, I am sponsored to share and publish their charts in my analysis.

GBP/USD - Triangle Breakout (23.05.2025)The GBP/USD pair on the M30 timeframe presents a Potential Buying Opportunity due to a recent Formation of a Triangle Pattern. This suggests a shift in momentum towards the upside and a higher likelihood of further advances in the coming hours.
Possible Long Trade:
Entry: Consider Entering A Long Position around Trendline Of The Pattern.
Target Levels:
1st Resistance – 1.3502
2nd Resistance – 1.3534
🎁 Please hit the like button and
🎁 Leave a comment to support for My Post !
Your likes and comments are incredibly motivating and will encourage me to share more analysis with you.
Best Regards, KABHI_TA_TRADING
Thank you.
Disclosure: I am part of Trade Nation's Influencer program and receive a monthly fee for using their TradingView charts in my analysis.

Lingrid | GOLD bullish BREAKOUT from Downward ChannelOANDA:XAUUSD is retesting the broken trendline from above while consolidating just above the key $3,300 level. A successful bounce from this zone could ignite a rally toward the next resistance at $3,382, breaking the recent lower high structure. However, the market remains sensitive to any fake breaks, as seen multiple times in the current structure. Bulls need to defend the trendline to keep the upward momentum alive.
📈 Key Levels
Buy zone: $3,300 – $3,310
Buy trigger: bounce from upward trendline
Target: $3,382
Sell trigger: close below $3,300
💡 Risks
Another fake breakout could trap late buyers.
Bearish rejection from the red resistance trendline may stall upside.
U.S. macro data surprises could inject volatility.
Traders, if you liked this idea or if you have your own opinion about it, write in the comments. I will be glad 👩💻

Gold: Bullish Flag Formation Suggests Further Upside Potential Hello guys, let's dive into Gold analysis!
Gold is currently forming a bullish flag pattern, a continuation formation that typically follows a strong upward impulse (flagpole). After a sharp rally, the price consolidated within a downward channel, creating the classic flag structure.
🔍 Technical Breakdown:
Flagpole: The strong bullish rally in early April marks the beginning of the uptrend.
Flag (Channel): Price has corrected in a downward-sloping channel, respecting both upper and lower bounds, creating a textbook flag pattern.
Breakout Zone: Price is now testing the upper boundary of the flag. A confirmed breakout above this resistance would signal a continuation of the prior uptrend.
🎯 Price Targets:
First Target: Around $3,445, which aligns with the measured move from the breakout point.
Second Target: Around $3,725, representing full flagpole projection from the breakout zone.
📌 Key Levels to Watch:
Breakout Confirmation: A strong 4H close above the flag’s upper boundary (~$3,260) with volume confirmation would validate the pattern.
_____________________________________
Invalidation: A rejection from the resistance and a fall below the channel may delay the bullish scenario, potentially retesting lower support around $3,090.
📊 Conclusion:
This setup favors bulls, but patience is key. Traders may consider waiting for a clear breakout and retest for safer long entries, aiming for the outlined targets.

BITCOIN → False breakout of 110K. Negative background???BINANCE:BTCUSDT.P hit a new all-time high of almost 112K on the back of improved economic and fundamental data, but the party didn't last long before Trump's next speech...
Yesterday, Trump spoke and announced new tariffs on the EU. The markets reacted quite aggressively to this news. Despite the fact that the market has practically bought back all the losses, the question itself remains open. The introduction of 50% tariffs on Europe will increase the risk background, which could trigger a fall in both the stock market and cryptocurrencies. In this case, money will flow into gold (a safe asset)...
Technically, Bitcoin is forming a false breakout of the global resistance level of 110K (previous ATH). The price is reacting and forming a bearish momentum (coinciding with the change in the fundamental background).
The area between 109.8 and 110.3 is a resistance and liquidity zone relative to the previous ATH. If the bears hold the resistance, Bitcoin may get stuck inside the 110K - 106.8K (105K) range.
Resistance levels: 109.8K, 110.3K, 112K
Support levels: 106.8K, 105K
Accordingly, if the 110K resistance holds amid the correction, consolidation below the resistance will confirm the formation of a false breakout, and in this case, Bitcoin may move to the 110K (112K) - 105K (102K) range. However, situations change daily, and if Bitcoin does break through 110K and manages to consolidate above its previous ATH, this will be a signal for growth...
Best regards, R. Linda!

GOLD → Consolidation amid a bullish trendFX:XAUUSD is trading in consolidation. As expected, the retest of the 3290 support level will end with a strengthening. The price is heading towards the resistance of the range.
The dollar is falling, which is supporting gold. The local trend is set by the fundamental background. The price of gold is strengthening and heading towards the resistance of the trading range, with the zone of interest being the liquidity located above 3346. The fundamental background is on the buyers' side, but since today is Friday, there is no strong news and the market is unlikely to seek a breakout from consolidation due to the lack of a driver. Thus, we can expect a correction from resistance before growth resumes, which may form next week.
Resistance levels: 3346, 3360
Support levels: 3308, 3290, 3282
Consolidation after the break of the local downtrend amid a falling dollar means that bulls are building up potential before a possible continuation of growth. But at the moment, an intraday trading strategy can be considered.
Best regards, R. Linda!

USD/JPY - H1 - Channel Breakout (17.05.2025) The Pair on the H1 timeframe presents a Potential Selling Opportunity due to a recent Formation of a Channel Breakout Pattern. This suggests a shift in momentum towards the downside in the coming hours.
Possible Short Trade:
Entry: Consider Entering A Short Position around Trendline Of The Pattern.
Target Levels:
1st Support – 142.40
2nd Support – 140.17
🎁 Please hit the like button and
🎁 Leave a comment to support for My Post !
Your likes and comments are incredibly motivating and will encourage me to share more analysis with you.
Best Regards, KABHI_TA_TRADING
Thank you.
Disclosure: I am part of Trade Nation's Influencer program and receive a monthly fee for using their TradingView charts in my analysis.

EURNZD Bearish Rejection from Range High – Eyes on 1.8805EURNZD is showing signs of a clear rejection from the 1.9150 resistance level, which has held firm over the past few weeks. The pair has remained range-bound between 1.9150 and 1.8800, and the recent bearish candlestick formation near the top of this range suggests renewed selling pressure. Unless price breaks above 1.9150 with strong momentum, the path of least resistance appears to be to the downside, with the next key support target at 1.8805. Traders should watch for follow-through below 1.8900 to confirm bearish continuation.
Technical Overview:
Structure: Price has formed a clear range between 1.9156 resistance and 1.8805 support.
Current Price: 1.8974 (as of chart capture).
Pattern: A potential bearish move is forming after rejection near the range high. The price has begun pulling back from the resistance zone.
Key Levels:
Resistance: 1.9156 (recent swing high).
Support: 1.8805 (horizontal level, tested multiple times).
Downside Target: If bearish momentum continues, the price may revisit 1.8805.
Breakout Potential: A close below 1.8805 may lead to acceleration toward 1.8725 or even 1.8600.
Fundamental Context:
Euro (EUR):
ECB is maintaining a cautious stance; inflation is moderating, but core pressures persist.
Risk of a pause or cut in rates in H2 2025, depending on inflation data.
New Zealand Dollar (NZD):
RBNZ is maintaining hawkish bias amid sticky inflation.
Recent data on NZ retail sales has been stable, but growth remains fragile.
Conclusion:
Bias: Bearish below 1.9156.
Setup: Look for a confirmed lower high and strong bearish candle close for potential short entries toward 1.8805.
Confirmation: Break and retest of 1.8900 zone would add conviction.

HelenP. I Euro will drop from resistance zone to $1.1260 pointsHi folks today I'm prepared for you Euro analytics. After an extended period of consolidation, the price remained trapped inside a narrow range, testing both the upper and lower boundaries multiple times without any decisive breakout. This indecision created a strong horizontal resistance around the 1.1355 - 1.1370 zone, which continues to act as a key obstacle for bulls. Eventually, the price declined sharply and found temporary support along the upward trend line. This area had already proven its significance through multiple touches and rebounds, serving as a strong dynamic support. After touching the trend line once again, buyers stepped in, leading to a moderate recovery in price action. Currently, EURUSD is pushing back toward the resistance zone. However, I don’t see this upward momentum sustaining for long. The previous failures at this level and the weak follow-through from bulls suggest exhaustion. I believe that once price enters the resistance zone, it will face renewed selling pressure. My expectation is a rejection from this area and a move lower, potentially breaking below the previous local lows. That’s why I set my goal at 1.1260 points, a logical target based on the previous swing support and current bearish setup forming just under a key resistance level. If you like my analytics you may support me with your like/comment ❤️
Disclaimer: As part of ThinkMarkets’ Influencer Program, I am sponsored to share and publish their charts in my analysis.


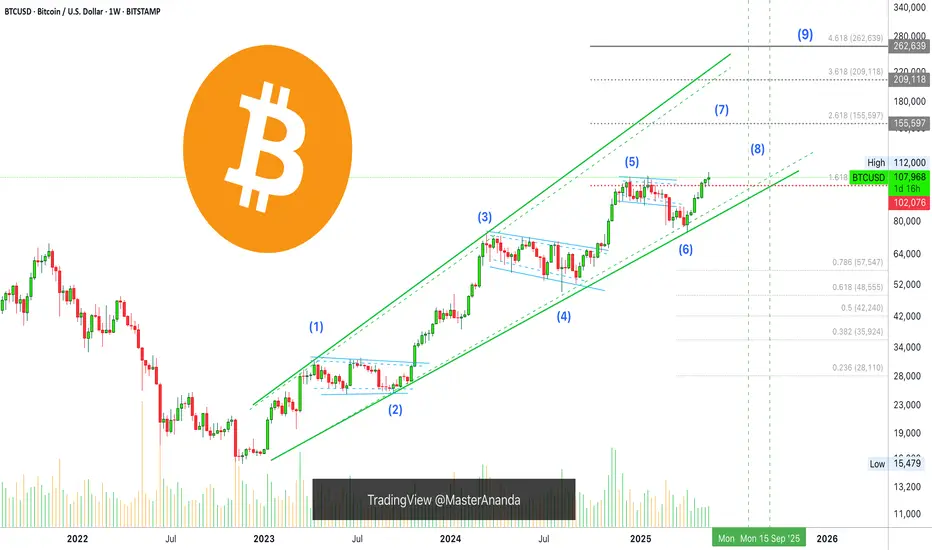
9-Up Waves—Extended Bullish Impulse—Bitcoin's 2025 Bull MarketIn Elliot Wave Theory, a bullish impulse has a total count of 5 waves but this isn't all. There is something called an "extension." Extensions can lead not only to 9 total waves but even 13 waves.
We can easily see this happen if we consider Bitcoin's bull market based on the long-term chart structure, starting in November 2022, see the chart above.
A bull market is defined as a sequence of higher highs and higher lows. This is perfectly visible on this chart. Contrary to many Altcoins, Bitcoin is in a long-term bull market.
If we consider even some of the big Altcoins projects, we can see that no long-term bull market is present, many are producing lower lows, but at the same time, others are producing long-term uptrends like Tron. So there are variations.
Seeing a perfect long-term 5 waves pattern completed when Bitcoin hit $110,000 in January 2025, seeing a strong higher low and the continuation of this trend, we can easily conclude that an extension is taking place.
Will this extension end at 9 waves or 13 waves?
Bitcoin is going up. It is already happening. There will be more.
Thank you for reading.
Namaste.
TradeCityPro | Bitcoin Daily Analysis #99👋 Welcome to TradeCity Pro!
Let’s go over the Bitcoin and major crypto index analysis. As usual, I’ll cover the key futures session triggers for New York.
⏳ 1-Hour Timeframe
As you can see on the 1-hour chart, Bitcoin is still trading below the 111817 level and has formed a support at 110455 after multiple rejections from that resistance.
✔️ If this 110455 level breaks, we could see a deeper pullback toward 109195, and potentially even down to 106422.
✨ The RSI oscillator is currently sitting at the 50 support level again. If RSI breaks below 50, it would indicate a weakening bullish momentum and increase the likelihood of a bearish scenario.
💥 However, if RSI holds above 50, it would confirm that buyers are still in control, and the probability of the uptrend continuing increases.
⚡️ The 111817 level remains a very clean and strong trigger for a long position. If price breaks this level, the market could make another leg up.
📊 Make sure to watch the volume closely. If buy volume starts to increase, a breakout above 111817 could offer a strong entry for those not already in a position.
👑 BTC.D Analysis
Bitcoin dominance broke below 63.76 yesterday, which helped altcoins rally, but it has since recovered and moved back above that level.
📈 For now, dominance is ranging between 63.76 and 64.30. A breakout from either side would confirm the direction of the next move.
📅 Total2 Analysis
Total2 was rejected from the 1.26 resistance and has now fallen below 1.23. If this downward move continues, the next support levels are at 1.18 and 1.15.
🔑 If price finds support here and moves back up to retest 1.26, a breakout from that level would be a fresh long trigger.
📅 USDT.D Analysis
Tether dominance found support at 4.38 and is now moving upward.
🧩 As long as it remains below 4.51, the overall market momentum is still considered bullish. But if it manages to stabilize above 4.51, the likelihood of a broader market correction increases.
❌ Disclaimer ❌
Trading futures is highly risky and dangerous. If you're not an expert, these triggers may not be suitable for you. You should first learn risk and capital management. You can also use the educational content from this channel.
Finally, these triggers reflect my personal opinions on price action, and the market may move completely against this analysis. So, do your own research before opening any position.

ETH Continues Bullish Momentum Above Broken TrendlineHello guys!
Ethereum has shown a strong bullish rally, breaking through a long-standing descending trendline with significant momentum. Currently, price action is consolidating above the broken trendline, which may now act as a support zone.
🔹 Scenario 1 (Bullish Continuation): If ETH holds above the current range and confirms the broken trendline as support, we could see a continuation toward higher resistance levels around $3,500 and beyond.
🔹 Scenario 2 (Deeper Retest): Alternatively, a pullback toward the $2,200–$2,300 area (highlighted zone) could offer a better accumulation point before the next bullish leg resumes.
This setup suggests that as long as ETH remains above the key support levels, the bullish structure remains intact.

Gold Bounces Back – Is the Road to a New ATH Open Again?📈 Gold Back Above 3300 – Is the Correction Over?
In yesterday’s analysis, I mentioned that Gold could start a correction from the strong confluence resistance zone and drop toward the 3260 area.
While price briefly dipped below 3300, it quickly reversed above that level, showing that bulls remain in control. At the time of writing, Gold is trading at 3306, and the ascending trendline from 3120 is still intact.
📌 Key Zone Holding – Bullish Structure Intact
The 3270–3280 area is now acting as a strong support, and yesterday’s price action could signal that the correction is already complete.
If Gold breaks above the 3350–3360 resistance, it would not only confirm a short-term continuation, but could also mean that the entire one-month correction from 3500 is over — opening the door for a new all-time high in the medium term.
📊 Trading Plan:
As long as 3260 holds, the bias remains bullish both in the short and medium term.
Buying dips below 3300 could be a viable strategy while targeting a break above resistance.
Disclosure: I am part of Trade Nation's Influencer program and receive a monthly fee for using their TradingView charts in my analyses and educational articles.

Mastering the Death cross and Golden cross - How to use it!In this guide I will discuss the Death crosses and Golden crosses. The next subjects will be described:
- What SMA to use?
- What is a Death cross?
- What is a Golden cross
- Is a Death cross always bearish and a Golden cross always bullish?
- How did the Death crosses and Golden crosses play out this cycle?
What SMA to use for Deathcross and Golden cross on the daily timeframe
In technical analysis, when identifying Golden Crosses and Death Crosses on the daily timeframe, the most commonly used moving averages are the 50-day and the 200-day simple moving averages (SMA). The 50-day moving average represents the average closing price of an asset over the past 50 trading days and reflects medium-term market trends. The 200-day moving average, on the other hand, represents the average over a longer period and is used to gauge the broader, long-term trend.
What is a Deatch cross?
A death cross is a bearish technical analysis signal that occurs when a short-term moving average crosses below a long-term moving average. Most commonly, it refers to the 50-day simple moving average crossing below the 200-day simple moving average on a daily price chart. This crossover suggests that recent price momentum is weakening relative to the longer-term trend, which can be an early indication of a potential downtrend or extended period of market weakness.
The death cross is often interpreted as a sign of increasing selling pressure and a shift in investor sentiment toward caution or pessimism. While it does not predict immediate declines, it is closely watched because it has historically preceded some significant market downturns. However, like all technical indicators, it is not infallible. Since it is based on past price data, the death cross is a lagging indicator, meaning it often appears after a downward trend has already begun.
What is a Golden cross?
A golden cross is a bullish technical analysis pattern that signals the potential beginning of a long-term uptrend. It occurs when a short-term moving average, typically the 50-day simple moving average (SMA), crosses above a long-term moving average, most commonly the 200-day SMA, on a daily price chart. This crossover suggests that recent price momentum is strengthening in relation to the longer-term trend, indicating growing investor confidence and increasing buying interest.
The golden cross is widely viewed as a positive signal by traders and investors, often marking a shift from a downtrend or consolidation phase to a more sustained upward movement. It reflects a change in market sentiment where shorter-term gains begin to outweigh longer-term losses.
Is a Death cross always bearish and a Golden cross always bullish?
The death cross is not always a purely bearish signal. While it reflects that price momentum has shifted to the downside, it's important to remember that moving averages are lagging indicators. By the time the crossover occurs, much of the downward move may already be priced in. As a result, it's common to see a relief rally shortly after the signal appears. This bounce can catch traders off guard, especially those who enter short positions expecting immediate continued weakness.
On the other hand, the golden cross often sparks a wave of bullish sentiment. Many traders see it as confirmation of a strong uptrend, leading to increased buying pressure. However, just like with the death cross, the lagging nature of the signal means that much of the initial move may have already happened. It's not unusual for the price to stall or even retrace shortly after the crossover, especially if the market has become overextended. In both cases, the market often reacts in a counterintuitive way in the short term, which is why these signals are best used alongside other tools and indicators.
How did the Death crosses and Golden crosses play out this cycle?
In this cycle, we’ve seen three death crosses and three golden crosses on the daily timeframe, with a fourth golden cross currently in the making. Interestingly, all three of the previous death crosses have not led to sustained downside as many might expect. Instead, each one has marked a local bottom, followed by strong upward movement in the weeks and months that followed. These signals, rather than being a reason for bearishness, turned out to be contrarian indicators. The most recent death cross occurred when Bitcoin was trading around 80k. From there, it managed to rebound impressively, climbing back above 111k, a clear reminder that death crosses, especially in this cycle, have not been reliable signals for further downside.
The golden crosses, on the other hand, have behaved a bit differently than usual in this cycle. The first golden cross actually marked a local top, with Bitcoin facing rejection shortly after. During the second golden cross, price action was more neutral, BTC moved sideways for a period before eventually continuing its upward trend. The third golden cross was followed by only a shallow pullback, after which Bitcoin pushed to new all-time highs.
Now, we are approaching the formation of the fourth Golden cross. Based on the pattern of past crosses and current market sentiment, a minor pullback could be on the horizon. It’s not guaranteed, but given the level of euphoria in the market right now, some cooling off would not be surprising. Even if a pullback does occur, the larger trend remains intact, and this golden cross may end up reinforcing that momentum.
Thanks for your support.
- Make sure to follow me so you don't miss out on the next analysis!
- Drop a like and leave a comment!
