GBPUSD - From Bullish to Bearish, keeping it simpleGBPUSD has shifted gears.
After losing its bullish structure, price is now trading inside a falling red channel, keeping the broader bias bearish.
As GBPUSD retests the upper bound of the falling channel, and that retest lines up perfectly with the orange supply zone. This is a classic area where sellers tend to step back in.
As long as this intersection holds, the plan is simple:
wait for lower timeframe confirmation and look for trend-following short setups, aiming for continuation back toward the lower side of the channel.
⚠️ Disclaimer: This is not financial advice. Always do your own research and manage risk properly.
📚 Stick to your trading plan regarding entries, risk, and management.
Good luck! 🍀
All Strategies Are Good; If Managed Properly!
~Richard Nasr
Parallel Channel

GBPUSD - Right Into Resistance… Again!GBPUSD is now trading at a very important intersection.
Price is pressing right into the upper red trendline, while also sitting inside the green resistance zone. This is not a random area... it’s a level that has already rejected price multiple times in the past.
From a bigger-picture perspective, the structure remains overall bearish, with price still respecting the descending channel. The recent push higher looks more like a corrective move rather than a true trend reversal.
As long as this trendline + resistance intersection holds, my focus stays clear:
I’ll be looking for trend-following shorts, preferably after lower-timeframe confirmation and signs of bearish control.
Only a strong and clean break above this zone would force a reassessment. Until then, sellers still have the edge.
⚠️ Disclaimer: This is not financial advice. Always do your own research and manage risk properly.
📚 Stick to your trading plan regarding entries, risk, and management.
Good luck! 🍀
All Strategies Are Good; If Managed Properly!
~Richard Nasr

Gold-to-Silver Ratio at 15-Year LowsGold-to-Silver Ratio pulled back sharply after President Trump paused new tariffs on critical minerals. The announcement eased near-term trade risks, leading to profit-taking after record highs above $93/oz. Despite the correction, silver remains up over 25% YTD, supported by robust industrial demand and tight supply.
Policy Context
The U.S. administration’s decision to delay tariffs on critical minerals (including silver, lithium, cobalt, and rare earths) temporarily removes a key policy risk.
Officials are expected to revisit trade agreements within 180 days, potentially introducing price floors instead of blanket tariffs.
This shift reduced short-term volatility — but structural drivers for silver remain unchanged.
Market Fundamentals
Industrial demand remains strong — especially from solar, EV, and electronics sectors.
Mine supply is constrained since silver is mostly a by-product of other metals.
Physical tightness persists after significant stock draws earlier in the year.
The gold/silver ratio near 50 marks the lowest level since 2011, signaling ongoing relative strength.
Overall, the fundamental setup continues to favor long-term accumulation on dips.
Technical Picture
Gold-to-Silver Ratio recently fell below its 200-day moving average, indicating near-term weakness.
Price structure remains bullish above $48–50 — a critical zone of prior support.
The ratio is trending within a descending channel, suggesting silver continues to outperform gold on a relative basis.
Short-term view: Expect range-bound trade between $50–60 as the market stabilizes.
Medium-term view: A sustained breakout above $65 could reopen the path toward previous highs.
Outlook
Volatility will remain elevated as markets digest U.S. trade policy and macro shifts.
However, tight supply, structural deficits, and ongoing industrial demand should cushion downside moves.
The metal’s dual role — part safe haven, part industrial — keeps it sensitive to both policy and growth signals, but the bias remains upward over the longer term.

Bitcoin: Renewed Uptrend?Bitcoin’s recent 4-hour price action suggests the market may be transitioning out of its corrective phase, but the broader Elliott Wave structure remains the primary reference point. Importantly, the macro analysis published on November 20, 2025 remains intact, with price behavior unfolding precisely within the parameters outlined in that original roadmap.
Macro Context: Targets Respected
Since the November publication, Bitcoin has executed a technically clean pullback, finding support squarely within the macro Fibonacci target zone between the 0.618 and 0.786 retracement levels. This region—highlighted months in advance—acted as a decisive reaction area, reinforcing the validity of the higher-timeframe wave count.
The reaction from this zone was not impulsive capitulation, but rather corrective stabilization followed by an initial recovery attempt, consistent with a developing wave (4) rather than a trend reversal. The original macro structure therefore remains not only valid, but technically respected.
(Reference to the November 20 macro roadmap is available in the Related Publications section.)
4H Elliott Wave Update
On the lower timeframe, Bitcoin appears to be forming a base following the macro-level correction, with price attempting to reclaim lost structure. The current advance fits best as the early phase of a developing impulsive sequence, though confirmation is still required.
Key technical observations:
Price is reacting constructively off the macro support zone.
The structure remains overlapping, suggesting transition rather than expansion.
A reclaim of the former channel would materially strengthen the bullish case.
Failure to regain that structure in the near term would imply continued consolidation or a deeper corrective extension, rather than immediate trend continuation.
Risk and Invalidation
Short-term invalidation levels are clearly defined and remain well above the long-term bearish threshold. A break below local invalidation would invalidate the immediate lower-timeframe count, but would still fall within the corrective allowances of the November macro thesis.
Only a decisive violation of the long-term invalidation level would challenge the broader bullish roadmap.
Outlook
Bitcoin is once again at a structural decision point. The successful defense of the 0.618–0.786 macro target zone keeps the larger bullish scenario alive, while the lower timeframe now determines whether the market can transition from correction into trend renewal.
Bottom line:
The roadmap from November remains valid. Bitcoin respected its macro targets with precision—what follows now will determine whether this recovery evolves into a renewed uptrend or remains a pause within a larger corrective phase.

Selena | XAUUSD - Highest Possiblities of Bullish ContinuationFOREXCOM:XAUUSD PEPPERSTONE:XAUUSD
After rejecting from the upper channel resistance, XAUUSD pulled back into a confluence zone consisting of institutional demand and trend support. This corrective move appears corrective rather than distributive, indicating preparation for further upside continuation rather than reversal.
Key Scenarios
✅ Bullish Case 🚀
As long as price holds above the institutional demand zone, bullish continuation remains favored.
🎯 Target 1:4550
🎯 Target 2:4600 Psychological resistance / Fib extension
❌ Bearish Case 📉
A clean breakdown and sustained close below trend support would invalidate the bullish bias and signal deeper correction.
Current Levels to Watch
Resistance 🔴: Psychological zone near highs
Support 🟢: Institutional demand + channel support
⚠️ Disclaimer: This analysis is for educational purposes only. It is not financial advice.

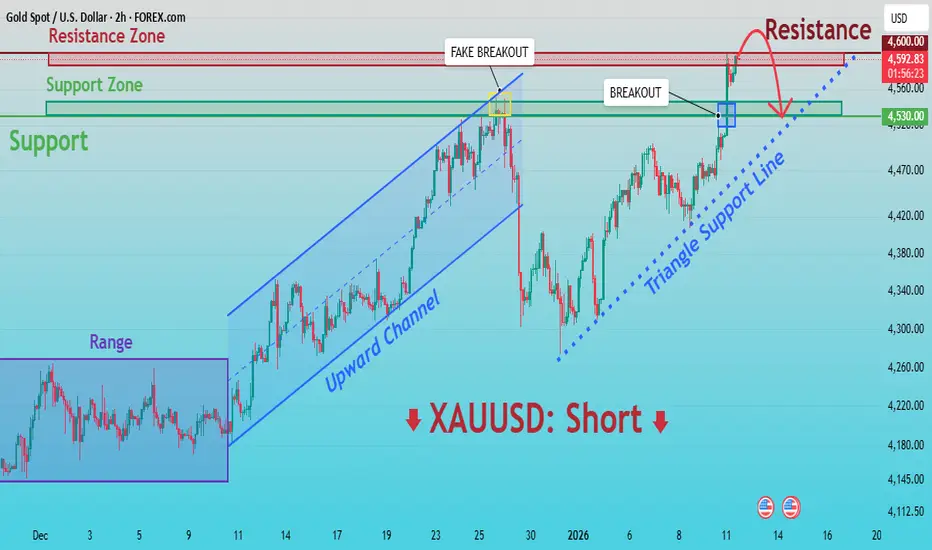
XAUUSD: Critical Supply Zone - Reaction May Define Next MoveHello everyone, here is my breakdown of the current XAUUSD setup.
Market Analysis
Gold is trading within a broader bullish environment, but recent price action shows signs of exhaustion near key resistance. After a period of consolidation inside a clear range, XAUUSD broke to the upside and formed a well-defined upward channel, confirming buyer control. This move brought price into the upper Resistance Zone around 4,590–4,600, where strong selling pressure emerged.
Currently, at this level, price printed a fake breakout, indicating a lack of acceptance above resistance and trapping late buyers. Following this rejection, gold pulled back sharply and then staged a recovery, breaking above the local structure again and retesting the Support Zone near 4,530. This area aligns with previous resistance turned support and a rising triangle support line, which is currently being tested. Despite the bullish recovery, price is once again approaching the major resistance area, where sellers have previously shown strong interest. The market structure suggests that the current move is corrective within a larger resistance context rather than the start of a fresh impulsive rally.
My Scenario & Strategy
My primary scenario favors a short setup while price remains below or reacts strongly from the 4,590–4,600 Resistance Zone. A rejection from this area could trigger a move back toward the 4,530 Support Zone and potentially lower if selling momentum increases.
However, a clean breakout and acceptance above 4,600 would invalidate the short bias and signal bullish continuation. Until that happens, the resistance area remains a key decision point, and caution is warranted near the highs.
That’s the setup I’m watching. Thank you for your attention, and always manage your risk.
GOLD - The battle for 4600 within the great consolidation...FX:XAUUSD is testing the 4581 zone as part of a correction, forming an intermediate bottom and consolidating above 4600, indicating a confident bullish trend.
PPI showed growth in November, retail sales exceeded expectations, and the unemployment rate fell to 4.4% in December, which slightly reduces the likelihood of an early easing of Fed policy, putting pressure on gold.
Geopolitics: Tensions between the US and Iran, as well as around the independence of the Fed. Risks are high...
Today, data on US unemployment benefit claims will be released. High figures could reinforce fears of an economic slowdown and support gold.
The short-term correction in gold is due to strong data from the US, but the upward trend remains influenced by geopolitics and pressure on the Fed. Weak employment data could bring the price back to record levels.
Resistance levels: 4612, 4630, 4643
Support levels: 4600, 4581, 4561
Consolidation is forming against the backdrop of a bullish trend. The market is likely to test 4581-4561 as part of profit-taking or correction before continuing to grow. However, if the bulls keep the price above 4600, growth may begin earlier...
Best regards, R. Linda!

SOLANA - The battle for resistance 145. The bulls have a chanceBINANCE:SOLUSDT.P breaks resistance and tries to stay above key levels. The fundamental background for cryptocurrencies is gradually improving. What can be expected in the short and medium term?
The crypto market has received support amid progress in US regulatory initiatives: the Digital Asset Market Clarity Act has been submitted for consideration, which increases regulatory predictability and attracts institutional capital. Progress in regulation is laying the foundation for sustainable growth in the crypto market by attracting institutional capital.
Bitcoin is strengthening against the backdrop of positive news related to market regulation and is moving into a local bullish trend. Against this backdrop, SOL is breaking through consolidation resistance and attempting to stay above 143.5 - 144.7...
Resistance levels: 156.5, 160.0
Support levels: 144.7, 143.5, 142. 0
If the bulls manage to keep SOL above the key support zone of 143.5 - 144.7 after breaking through resistance and a reversal pattern forms, a rally to 155 - 160 can be considered.
Best regards, R. Linda!

GOLD - Consolidation ahead of news. ATH retestFX:XAUUSD is trading around $4630, pretty close to its all-time high, but since the session opened, the price has jumped a lot because of the aggressive bull market, which could lead to a correction. News ahead...
US inflation (CPI) slowed in December, and the market expects 2-3 Fed rate cuts in 2026, which exceeds the regulator's forecasts. Protests in Iran and threats of possible intervention by the US; tensions surrounding the independence of the Fed (investigation into Powell); and the tense situation in Eastern Europe are creating geopolitical risks.
• US PPI data will be released today.
• Higher inflation figures may temporarily support the dollar and limit gold's growth.
• Traders are also awaiting the Supreme Court's decision on Trump's tariffs, with a 72% probability of cancellation. If this is confirmed, the market may react strongly...
Resistance levels: 4630, 4650, 4675
Support levels: 4600, 4577
Technically, the ideal scenario would be to wait for a correction, for example to 4605-4600, or to the support level of the trading range to form an ideal entry point. But against the backdrop of an aggressive market, bulls are likely to push the price up from the 4630 zone...
Best regards, R. Linda!

GBPUSD - Descending Channel with Stacked FVG Zones
Alright traders, let's talk GBPISD!
GBPUSD is showing some interesting price action right now. We've got a descending channel playing out on the 45-minute timeframe with two stacked FVG zones creating a decision area. Price just retested the 45M FVG and sellers stepped in - now it's acting as resistance.
Here's the key: 1.34273 is the line in the sand. Break below = bearish continuation. Hold above = potential bounce into the FVG zones.
The Structure
Price has been making lower highs and lower lows inside this descending channel. We saw a push up into the 45M FVG zone (1.3455-1.3475) but sellers rejected it hard. Now that zone has flipped from support to resistance.
Below that, we have the 2HR FVG zone (1.3440-1.3455) which could act as a retest area if we get a bounce. But if 1.34273 breaks, we're heading to the lower support at 1.3380.
Why This Setup Matters
Descending channel intact - trend is bearish until breakout
45M FVG rejected - sellers in control at that level
2HR FVG below - potential bounce zone if bulls step in
1.34273 is critical support - break = acceleration lower
BoE expected to cut rates - bearish for GBP
Dollar strength persisting despite Fed drama
Fundamental Picture
Mixed signals but leaning bearish for GBP:
UK GDP data due Thursday - expected to show 0.2% contraction
BoE's Taylor: "Interest rates should continue on a downward path"
UK inflation cooling faster than expected
Speculators cut bearish GBP positions by most in 5 months
Dollar holding near 1-month highs despite Powell drama
Fed expected to hold rates - supports USD
Japan yen drama pulling focus but USD still firm
Key Levels
Resistance:
1.3455-1.3475 - 45M FVG zone (now resistance)
1.3510 - Upper resistance
1.3575 - Major resistance / channel top
Support:
1.3440-1.3455 - 2HR FVG zone (potential bounce)
1.34273 - KEY SUPPORT (line in the sand)
1.3380 - Lower channel support
The Scenarios
Bearish (favored): Price stays below the 45M FVG zone, retests the 2HR FVG but fails to hold, breaks below 1.34273, and continues down the channel toward 1.3380. The descending channel structure supports this move, and weak UK data could accelerate it.
Bullish: Price bounces from the 2HR FVG zone, reclaims the 45M FVG (1.3455-1.3475), and breaks above the descending channel. Target would be 1.3510, then 1.3575. This needs strong UK GDP data or significant dollar weakness.
Chop scenario: Price oscillates between the FVG zones and 1.34273 support. Wait for a clear break before committing.
My Lean
I'm BEARISH here. The descending channel is intact, the 45M FVG got rejected, and the fundamentals favor USD strength (Fed holding, BoE cutting). The 1.34273 level is the trigger - break below that and we're targeting 1.3380.
If you're looking for shorts, wait for a retest of the 2HR FVG zone that fails, or a clean break below 1.34273.
What's your read on GBPUSD? Bulls or bears winning this one? 👇

Approaching a Major Inflection Point After 2.5‑Year DowntrendNHC is shaping up for a meaningful breakout after a ~2.5‑year downtrend.
We’ve still got a few days left in the monthly candle, but a close above $4.71 would strengthen the probability of a sustained trend reversal.
Why the setup is interesting
- Price has reacted cleanly from a macro 50% retracement (ATL → ATH).
- It’s also sitting right on the major 50% level from the COVID low to ATH.
- Price is currently resting on the old ATH region, turning prior resistance into support.
- We’re seeing a potential first test and impulsive break of the yearly pivot (need to see spike of volume relative by end of month with larger candle spread)
- Volume has been declining for ~2 years, hinting at seller exhaustion rather than active distribution.
Where caution is still warranted
- The monthly candle hasn’t closed, and price is pressing into the yearly pivot for the first time.
- Coming in sideways increases the chance of a rejection wick before any true breakout.
- A sharp pullback into S1 wouldn’t be unusual, especially if the pivot acts as initial resistance before a stronger rally and eventual breakout attempt.
Overall, the structure is improving, the higher‑timeframe levels are doing their job, and the pivot interaction will likely dictate whether we break now or after a cleaner retest.

ZEN Main Trend (anonymous) 01/15/2025Logarithm. Time frame: 1 week. A very long horizontal channel with a large increment, with the price being pulled toward its resistance. A conditional fractal on a smaller scale is observed, with a previous local pump and a false exit from the channel range. The overall trend reversal and transition to phase 3 of the trend pump bowl occurs only after a breakout and consolidation above the descending line of the main trend (indicated by the thick red line).
Research online to find out what, how, who the investors are, and at what price this "investing" is. When trading, manage your risks, as the channel is very long and there are many passengers. Medium-term interest rates and logic are shown.
Locally now Time frame: 1 day.

BTC - Structure Flip, Next Leg Loading...BTC just did something important.
Price broke above a key resistance, and that level has now flipped into support. This kind of structure shift usually confirms that the previous range is done and a new leg is starting.
That said, this doesn’t mean price can’t breathe.
A pullback toward the $92,000 demand zone is still possible, especially since it lines up nicely with the lower blue trendline. If that happens, it would still be considered a healthy correction.
As long as structure holds, the expectation remains the same:
one more impulse higher, with the $100,000 round number acting as the next magnet.
⚠️ Disclaimer: This is not financial advice. Always do your own research and manage risk properly.
📚 Stick to your trading plan regarding entries, risk, and management.
Good luck! 🍀
All Strategies Are Good; If Managed Properly!
~Richard Nasr

XAUUSD Short: Fails at Supply Zone, Sellers Regain ControlHello traders! Here’s a clear technical breakdown of XAUUSD (1H) based on the current chart structure. XAUUSD recently completed a strong bullish leg within a well-defined ascending channel, but momentum started to fade as price reached the major Supply Zone around 4,620–4,630. This area acted as a key rejection zone, where aggressive selling pressure appeared, leading to a clear breakdown from the ascending channel and signaling a shift in short-term market control. After the breakdown, price attempted to recover but failed to regain acceptance above the former structure. The rebound moved into a corrective phase and is now trading below the Supply Line, suggesting that the recent upside is corrective rather than impulsive. The market structure has transitioned into lower highs, reinforcing bearish pressure.
Currently, XAUUSD is approaching the 4,540–4,560 area, which aligns with a prior breakdown level and dynamic resistance from the descending supply line. This zone is expected to attract sellers again. Below current price, the Demand Zone near 4,520 is the first key support. A clean break below this level would confirm bearish continuation and open the door for a deeper move lower.
My scenario: As long as XAUUSD remains below the 4,620–4,630 Supply Zone and continues to respect the descending supply structure, the bearish bias remains valid. I expect price to show rejection from the current pullback zone and push lower toward 4,520 (TP1). A breakdown and acceptance below 4,520 would expose further downside toward 4,480–4,460 (TP2). However, a strong bullish breakout and acceptance back above 4,600–4,630 would invalidate the short scenario and suggest renewed bullish continuation. For now, structure favors sellers while price trades below supply. Manage your risk!

Tron continuing to climb the measured move lineUsually when you see a measured move line treated like a staircase by price action and by this many consecutive daily candles probability is good that the breakout will be validated. If so, the target for this one is around 43-44 cents. *not financial advice*

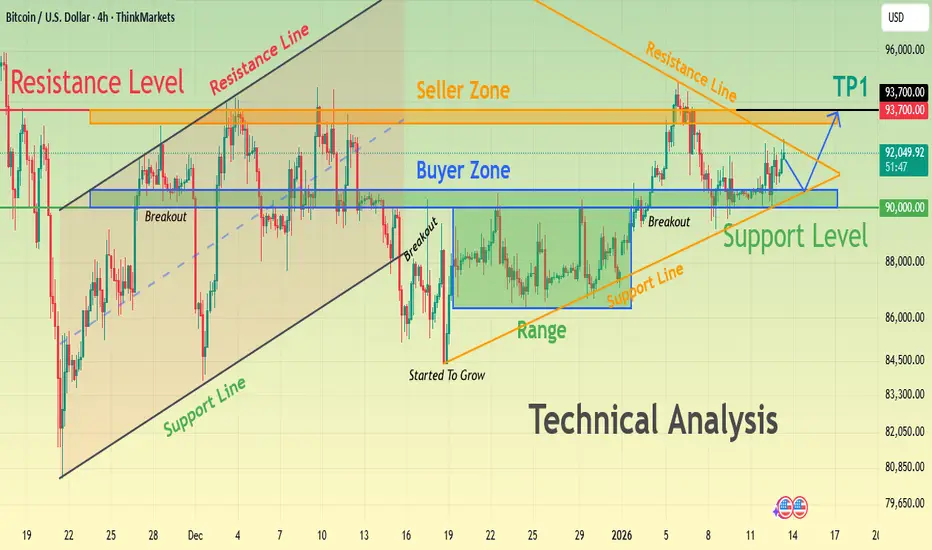
BTCUSD Consolidation Before the Next Big MoveHello traders! Here’s my technical outlook on BTCUSD (4H) based on the current chart structure. Bitcoin is trading within a broader bullish structure after reclaiming key levels and breaking above previous consolidation zones. Earlier on the chart, price respected a rising support line and formed a series of higher lows, signaling growing buyer strength. After a brief pullback, BTC entered a consolidation range, where the market paused before continuing higher. This range acted as an accumulation zone, and the subsequent breakout confirmed renewed bullish momentum. Currently, BTCUSD is trading above the Buyer Zone around the 90,000–91,000 area, which aligns with previous resistance turned support. Price recently broke out from this zone and is now consolidating just below the Seller Zone / Resistance Level near 93,700. This resistance also aligns with a descending resistance line, increasing its significance and making it a key reaction area. My scenario: as long as BTCUSD holds above the Buyer Zone and respects the rising support line, the bullish structure remains intact. A clean breakout and acceptance above the 93,700 Resistance Level would confirm continuation toward the next upside target (TP1). However, a strong rejection from resistance could lead to a corrective pullback back into the Buyer Zone before any further attempt higher. For now, price remains compressed between support and resistance, and a decisive move is likely soon. Please share this idea with your friends and click Boost 🚀
EURUSD Price Action - Support Holds at 1.1670, TP Near 1.1720Hello traders! Here’s my technical outlook on EURUSD (1H) based on the current chart structure. After trading inside a clearly defined range, EURUSD broke to the upside, showing initial buyer strength. However, this bullish move failed to sustain, and price turned around, transitioning into a descending channel. Within this channel, price respected both the falling resistance line and the internal support, forming a consistent sequence of lower highs and lower lows, confirming short-term bearish control. During the decline, EURUSD moved into the Seller Zone, where selling pressure remained active and pushed price lower toward the Buyer Zone. This Buyer Zone aligns with a key Support Level and represents an area where demand previously entered the market. From this level, price reacted strongly, producing an impulsive move up and a clear breakout from the descending channel, signaling a potential shift in short-term structure. Currently, price is holding above the reclaimed support, suggesting acceptance above the former bearish structure. My scenario: as long as EURUSD holds above the Buyer Zone and maintains support, a continuation move toward the Resistance Level around 1.1720 (TP1) is possible. This area also overlaps with the Seller Zone, where selling pressure may reappear. If price fails to hold above support and falls back below the Buyer Zone, the bullish scenario would weaken and the broader bearish structure could resume. For now, price is at a key decision area, with buyers attempting to confirm the breakout and build further upside momentum. Please share this idea with your friends and click Boost 🚀

GBPNZD - Ascending triangle on an upward trendFX:GBPNZD has moved into consolidation amid an uptrend and is forming another bullish structure. Focus on trigger 2.340
The global trend for the currency pair is bullish. Against the backdrop of the main trend, consolidation is forming in the form of an ascending triangle, which is generally a fairly strong bullish conglomerate. If resistance is broken, consolidation may move into a distribution phase
After the short squeeze, a weak reaction is forming and the market is quickly returning the price to the resistance level of 2.340. Closing above this level could trigger a rally to 2.35.
Resistance levels: 2.34, 2.355
Support levels: 2.338, 2.336
Before the resistance is broken, a long squeeze of local support may be triggered. However, a quick retest of resistance and a close above the level may trigger distribution towards 2.355.
Best regards, R. Linda!

GOLD (XAUUSD): Another BoS
I see another bullish setup on Gold.
There is a confirmed break of structure BoS on a 4H time frame
and a violation of a resistance of a local consolidation.
The market may rise more and reach 4700 level soon.
❤️Please, support my work with like, thank you!❤️
I am part of Trade Nation's Influencer program and receive a monthly fee for using their TradingView charts in my analysis.

GOLD - Consolidation ahead of news. Long squeeze?FX:XAUUSD is trading in the $4575-4600 range (consolidation) ahead of US inflation data (CPI) for December...
Inflation remains above the Fed's target (2%), making the data key to assessing the timing of rate cuts. XAU is consolidating below record highs. Profit-taking is observed ahead of the data release. Geopolitical risks and concerns about the Fed's independence support long-term demand for gold.
The reaction to CPI data may be short-term, as these factors remain a priority:
• Above forecast: dollar growth, gold correction to $4550 - 4520.
• Below forecast: dxy weakening, gold growth to $4650 - 4700
Gold retains its upside potential, but in the near term, its movement will depend on inflation data. Any correction can be seen as a buying opportunity amid ongoing geopolitical and monetary risks.
Resistance levels: 4600, 4630, 4650
Support levels: 4577, 4560, 4550
The initial retest of 4600 may end in a pullback, and a close below 4577 may trigger a decline to 4561 - 4550 before an attempt to grow (interest in the liquidity zone). However, against the backdrop of news reaction, gold may test 4550 - 4520 before continuing to rise. Very weak news may trigger a breakout of 4600 and an aggressive rally. It is important to monitor the context...
Best regards, R. Linda!

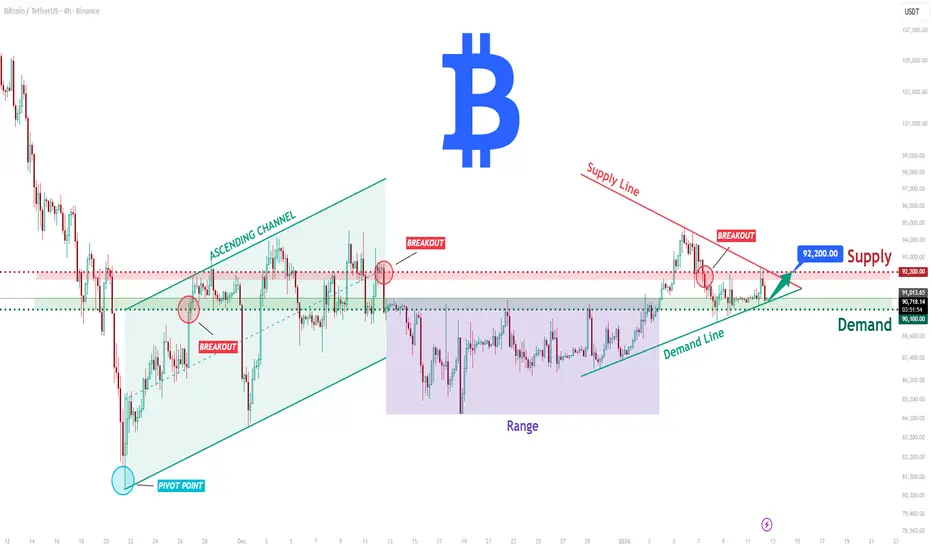
BTCUSDT Long: Demand Holding at 90,100 - Eyes on 92,200 SupplyHello traders! Here’s a clear technical breakdown of BTCUSDT (4H) based on the current chart structure. After a strong bearish move, BTC formed a clear pivot low, from which price transitioned into a bullish recovery phase. From this pivot point, the market developed a well-defined ascending channel, confirming a shift in market structure and increasing buyer control through a sequence of higher highs and higher lows. This channel guided price higher until BTC reached a key Supply Zone around 92,000–92,200, where selling pressure emerged. At this supply area, price experienced a rejection and breakout failure, indicating that sellers are actively defending this level. Following the rejection, BTC briefly broke below short-term structure and moved into a consolidation range, reflecting temporary balance between buyers and sellers. More recently, price has started to recover again, respecting a rising Demand Line, which signals that buyers are still defending the broader bullish structure.
Currently, BTC is trading between a key Demand Zone near 90,100–90,300 and the overhead Supply Zone around 92,200. This area represents a critical decision zone for the market, where the next directional move is likely to be defined.
My scenario: as long as BTCUSDT holds above the Demand Zone and continues to respect the rising demand trend line, the bullish bias remains valid. I expect buyers to attempt another push toward the 92,200 Supply Zone. A clean breakout and acceptance above this level would confirm bullish continuation and open the door for further upside. However, a strong rejection from supply followed by a breakdown below demand would weaken the structure and increase the probability of a deeper corrective move. For now, price remains in a compression phase between demand and supply — patience and proper risk management are key. Manage your risk!
EURJPY - NEW BREAKOUT!Hello traders,
the EURJPY has formed a descending channel.
Currently, the resistance line is broken!
Based on this breakout, I expect a bullish move.
🎯 TARGET: 185.500

ETHEREUM - Retest resistance before a possible declineBINANCE:ETHUSDT is trading within the range of 3050-3150, with a local and global bearish trend. The market is still waiting for positive drivers, and until they appear, it is possible to trade within the channels...
Against the backdrop of a global downtrend, Bitcoin is forming a bullish wedge/ascending triangle, which in the current circumstances I consider to be a consolidation pattern before a possible liquidation and decline to 80-75K, which in general could trigger a decline across the entire market. Ethereum is forming a trading range against the backdrop of a local downtrend.
Focus on trading boundaries, namely resistance at 3150
After a short squeeze and a price decline to 3060, a liquidity pool of 3060-3050 (area of interest for MM) has formed below the local level
Resistance levels: 3150 - 3181
Support levels: 3083, 3056, 3000
A retest of 3150 and a lack of momentum may confirm the dominance of bears in the market, which in turn may form a false breakout of resistance and a reversal to the zone of interest and liquidity pool 3050.
Best regards, R. Linda!
