XAUUSD: Bullish Trend Remains Intact in Rising ChannelHello everyone, here is my breakdown of the current XAUUSD (Gold) setup.
Market Analysis
Gold has confirmed a bullish shift after breaking out of a prior triangle structure, where price was previously compressed between descending resistance and ascending support. This breakout marked a clear change in market structure and initiated a strong impulsive move higher. After the breakout, price transitioned into a consolidation range, indicating temporary balance before continuation.
Currently, XAUUSD established a clear upward channel, respecting both the lower channel support and the ascending trend line. This structure confirms sustained bullish momentum with higher highs and higher lows. Price has continued to trend higher and recently pushed into a key Resistance Zone, where the market is currently showing signs of reaction and testing supply. Below current price, the former resistance has flipped into a well-defined Support Zone, which aligns with the prior breakout level and the lower boundary of the upward channel. This area has already shown buyer response, reinforcing its importance as a demand zone within the bullish structure.
My Scenario & Strategy
My primary scenario remains bullish as long as XAUUSD holds above the Support Zone and respects the upward channel structure. I expect buyers to defend this area and attempt another push toward the Resistance Zone. A successful breakout and acceptance above resistance would confirm continuation of the bullish trend and open the path toward higher targets.
However, a strong rejection at resistance followed by a breakdown below the support zone would weaken the bullish structure and suggest a deeper correction or consolidation. For now, price action continues to favor buyers while the ascending structure remains intact.
That’s the setup I’m tracking. Thank you for your attention, and always manage your risk.
Parallel Channel

BTCUSDT Above Support - $88,900 Resistance in PlayHello traders! Here’s my technical outlook on BTCUSDT (1H) based on the current chart structure. BTCUSDT is trading within a broader ascending channel, confirming an overall bullish structure despite recent volatility. After a sharp drop earlier on the chart, price formed a clear base and started to grow, establishing higher lows along the channel’s support line. This recovery phase shows that buyers remain active and are defending key levels. Price then moved into a consolidation area between a clearly defined Buyer Zone (support) and Seller Zone (resistance), creating a range-like environment inside the channel. Multiple breakouts and false moves around the Seller Zone highlight strong supply pressure in this area, while repeated defenses of the Buyer Zone confirm solid demand. The dashed midline reflects interim structure guiding price action within the channel. Currently, BTC is holding above the Support Level around the Buyer Zone (~87,300), while facing overhead Resistance near the Seller Zone (~88,900). The projected move suggests a potential bounce from support toward resistance, with TP1 aligned near the upper resistance area inside the channel. My scenario: as long as BTCUSDT holds above the Buyer Zone and the ascending support line, the bias remains bullish, with a move toward the resistance and TP1 as the primary objective. A strong rejection from resistance could lead to further consolidation. However, a clean breakdown below support would invalidate the bullish setup and signal a deeper pullback. Please share this idea with your friends and click Boost 🚀

Xauusd gold Elliott Wave update yearlyThis count is based on my assumptions so anything can happen not a trading or financial advice just for educational purposes only kindly do your own ta thanks trade with care good luck.

LTCUSDT - Retest of the liquidity zone on a downtrendBINANCE:LTCUSDT.P is forming a local rally after breaking through resistance at 78.0. The market is bearish, but within the bullish run, the altcoin may test liquidity at 79.4 - 81.0.
Bitcoin looks weak, a rebound from resistance is forming, and Friday's daily bar indicates strong bearish dominance. A fall in the flagship currency could trigger a fall in LTC after a local rally...
LTC looks slightly stronger than the market. The target of such a rally may be hidden behind 79.4 - 81.0. In the current situation: global downtrend, low market liquidity, I see this as a manipulative hunt for liquidity before a decline.
Resistance levels: 79.4, 81.0
Support levels: 78.0, 77.0, 75.4
A retest of this resistance cluster could end in liquidity capture and a false breakout. Consolidation below 79.4 could trigger a reversal and a decline.
Best regards, R. Linda!

EURUSD Short: Failed Break 1.1800 - Demand at 1.1740 as TargetHello traders! Here’s a clear technical breakdown of EURUSD (4H) based on the current chart structure. After a prolonged consolidation phase marked by a broad range, EURUSD formed a clear pivot low and transitioned into a bullish recovery. From that pivot point, price established a well-defined ascending channel, confirming a shift in market structure and sustained buyer control through higher highs and higher lows.
Currently, price is trading below a key Supply Zone near 1.1800, where a fake breakout occurred, indicating strong selling pressure at the highs. This rejection from supply suggests that buyers struggled to gain acceptance above resistance. Following the rejection, price broke below short-term structure and is now pulling back toward the 1.1740 Demand Zone, which aligns with prior breakout structure and the lower boundary of the ascending channel.
My scenario:as long as EURUSD remains below the 1.1800 Supply Zone, the risk of a bearish reaction stays elevated. A clear rejection from this resistance area, especially with bearish confirmation, would favor short positions, targeting a move back toward the 1.1740 Demand Zone as the first objective. Manage your risk!

GE Aerospace – Daily ChartMarket Structure
After a strong bullish trend, the stock experienced a V-shaped correction and rebounded back toward a key resistance zone. Price remains above the rising moving average, confirming that the primary trend is still bullish, but the current area is critical.
Short-Term Outlook
• Primary scenario:
The 316–318 zone is a major resistance. Price reaction here will define the next move.
• Key support:
300–295 zone, aligned with the moving average
• Bullish short-term targets (on breakout):
• 330
• 340
• Short-term stop loss:
Daily close below 295
• Bearish alternative:
Rejection from resistance may lead to a pullback toward 285–280
Mid / Long-Term Outlook
• Trend:
Bullish structure remains intact
• Price logic:
Recent move resembles a healthy pullback within a broader uptrend
• Long-term targets:
• First target: 350
• Extended target: 370 – 380
• Long-term invalidation:
Weekly close below 280
Fundamental Summary
• Strong exposure to aerospace and defense contracts
• Benefiting from global defense spending growth
• Long-term order backlog supports revenue stability
• Cyclical sensitivity, but solid structural growth outlook

Daily GOLD ChartGold remains in a strong bullish trend, currently consolidating inside an ascending channel. This phase represents a healthy correction, not a trend reversal. Price is still trading above the moving average, confirming bullish control.
Short-Term Outlook
• Primary scenario:
Price is oscillating in the upper half of the channel. Pullbacks toward channel support are potential buy zones.
• Key support zone:
Channel support around 4,180 – 4,220
• Short-term target:
Upper channel resistance at 4,550 – 4,600
• Short-term stop loss:
Daily close below 4,120
• Bearish alternative:
Breakdown of channel may trigger a deeper correction toward 4,000 – 4,050
Mid / Long-Term Outlook
• Trend:
Strong bullish structure (Higher Highs & Higher Lows)
• Pattern logic:
The current channel acts as a bullish continuation pattern
• Long-term targets (on breakout):
• First target: 4,700
• Extended target: 4,900 – 5,000
• Long-term invalidation / stop:
Weekly close below 3,950
Fundamental Summary
• Expectations of future interest rate cuts
• Persistent geopolitical and economic uncertainty
• Ongoing central bank gold accumulation
• Periodic weakness in the US dollar
Fundamentals remain strongly supportive for gold in the medium to long term.

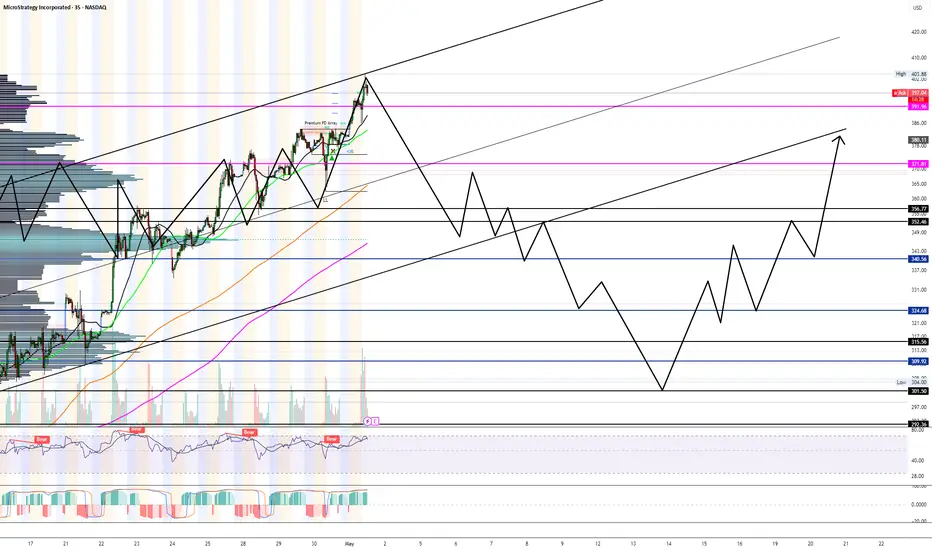
I think were due for bad earnings reaction for once.As seen in the chart, we are at the top of the range with highly over extended price movement and hitting the largest target number at $400 which has been sought after for months.
I think a snap down to $360-$350 is inevitable.
If we do pop up to $420+ then its a blow off top unless market reacts positively to government involvement to crypto.
BTCUSDT: Holding 87,300 Support Ahead of a 89,000 RetestHello everyone, here is my breakdown of the current BTCUSDT setup.
Market Analysis
BTCUSDT is trading within a well-defined ascending channel, reflecting a sustained bullish structure after breaking out of the prior consolidation range. Earlier in the chart, price spent significant time moving sideways inside a broad range, capped by a resistance zone near 89,000 and supported by demand below. A decisive breakout from the range confirmed a shift toward bullish market conditions.
Recently, BTC pushed back into the 89,000 Resistance Zone, where selling pressure appeared again. The current reaction from resistance looks corrective, not impulsive, suggesting temporary rejection rather than a trend reversal. Price is consolidating just above support, indicating compression between support and resistance within the bullish channel.
My Scenario & Strategy
My primary scenario remains bullish as long as BTCUSDT holds above the 87,300 Support Zone. Continued defense of this area could lead to another attempt to test the 89,000 Resistance Zone. A clean breakout and acceptance above resistance would confirm continuation within the channel and open the door for further upside.
However, on the flip side, a decisive breakdown below the support zone and channel structure would weaken the bullish bias and signal a deeper corrective move toward lower levels. For now, price remains constructive, with buyers defending structure while BTC consolidates below resistance.
That's the setup I'm tracking. Thank you for your attention, and always manage your risk.

EURUSD, H1 - possible continuation of uptrendPrice made a short pullback to the support level and it is seems to be ready to continue going higher. Trade carefully!

JPM — Bullish Channel at Decision PointTechnical Overview
• Price is moving inside a well-defined ascending channel
• Currently testing the upper channel resistance
• Trend remains bullish as long as price holds above the channel midline & SMA
Bullish Scenario
• Confirmation: Strong daily close above the channel top (~330)
• Targets:
• 345
• 360
• Stop-loss: 318 (back inside channel)
Bearish / Pullback Scenario
• Rejection from resistance may trigger a healthy correction
• Downside zones:
• 305
• 295 (lower channel support)
• Invalidation of trend: Daily close below 295
Trend Bias
• Short-term: Neutral → Bullish (breakout-dependent)
• Mid / Long-term: Bullish while inside the ascending channel
Fundamental Snapshot (Brief)
• JPM remains the strongest U.S. bank fundamentally
• Benefits from:
• High interest rates
• Strong balance sheet
• Market leadership in investment & commercial banking
• Fundamentally aligned with long-term bullish technical structure

EURUSD: 1.1750 Support Sets Up a Retest of 1.1800Hello everyone, here is my breakdown of the current EURUSD setup.
Market Analysis
EURUSD has confirmed a bullish shift after breaking out of the previous downward channel, signaling a clear change in market structure from bearish to bullish. This breakout marked the start of a strong impulsive move higher, with price establishing higher highs and higher lows. Following the breakout, EURUSD respected a rising trend line, which is now acting as dynamic support and reinforcing the bullish bias.
Currently, price pushed into the 1.1800 Resistance Zone, where selling pressure emerged, leading to a rejection and short-term pullback. This reaction looks corrective rather than impulsive, suggesting profit-taking instead of a trend reversal. The pullback is currently unfolding toward the Support Zone around 1.1750, which aligns with the previous breakout area and the ascending trend structure. This zone has already shown buyer reaction, indicating active demand.
My Scenario & Strategy
My primary scenario remains bullish as long as EURUSD holds above the 1.1750 Support Zone. I expect buyers to defend this area and attempt another push toward the 1.1800 Resistance Zone. A clean breakout and acceptance above 1.1800 would confirm bullish continuation and open the path toward higher targets.
However, a decisive breakdown below the support zone would weaken the bullish structure and signal a deeper corrective move. For now, price action favors buyers while the ascending structure and key support remain intact.
That's the setup I'm tracking. Thank you for your attention, and always manage your risk.

EURUSD in Uptrend – Retest of Support Before Next PushHello traders! Here’s my technical outlook on EURUSD (2H) based on the current chart structure. EURUSD is trading within a clear bullish environment after transitioning from a prolonged consolidation phase into an impulsive upward move. Earlier on the chart, price was moving inside a range, indicating balance between buyers and sellers. This range was eventually resolved to the upside, confirming a shift in market control. Currently, price is trading above the Support Level around the 1.1750 area, which also aligns with the Buyer Zone and the former range high. This zone is acting as a key demand area after the breakout. The recent pullback appears corrective, with price retesting support rather than showing impulsive selling pressure. As long as EURUSD holds above this support zone, the bullish structure remains intact. My scenario: if buyers continue to defend the 1.1750 Buyer Zone, EURUSD could resume its upward move toward the 1.1800 Resistance Level and potentially extend toward the 1.1820 TP1. A clean continuation above resistance would confirm further upside momentum. However, a breakdown below the support zone would signal a deeper correction and weaken the bullish setup. For now, the structure favors buyers while price respects support. Please share this idea with your friends and click Boost 🚀

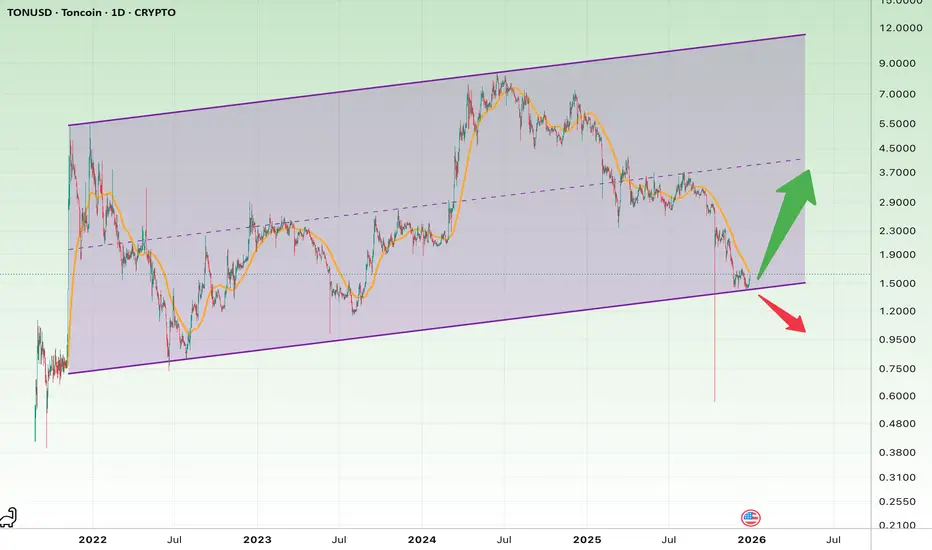
TON at a Major Long-Term SupportOverall Market Structure
• TON is trading inside a long-term ascending channel
• Price is currently sitting right at the lower boundary of this channel
• This zone represents a high-importance decision area from a technical perspective
Short-Term Scenario (Trading View)
Bullish Short-Term Scenario
• Price reaction at the lower channel support
• High probability of a technical rebound after heavy selling pressure
• Suitable for short-term swing trades
Logical entry zone:
• $1.50 – $1.65
Short-term stop-loss:
• $1.38
• A confirmed breakdown below this level invalidates the setup
Short-term targets:
• First target: $1.95
• Second target: $2.30
• Extended target (strong momentum): $2.80
📌 Risk-to-reward is attractive, but the scenario depends entirely on holding channel support.
Bearish Short-Term Scenario
• A confirmed breakdown below the channel
• Increased downside momentum and liquidation pressure
Downside targets:
• $1.20
• $0.95
• Critical support zone: $0.75
Mid- to Long-Term Scenario (Investment View)
Bullish Long-Term Outlook
• As long as price remains inside the ascending channel, the bullish market structure remains intact
• The current zone represents a strong long-term accumulation area
Long-term stop-loss:
• $1.10 (weekly close below this level = exit signal)
Long-term targets:
• Conservative target: $3.50
• Mid-cycle target: $5.00
• Full bull-market target: $7.00 – $9.00
📌 Achieving higher targets requires:
• Increasing volume
• A favorable broader crypto market
• Positive ecosystem developments
Fundamental Overview (Brief)
• TON is the native blockchain of the Telegram ecosystem
• Potential access to hundreds of millions of Telegram users is a major strategic advantage
• Key focus areas:
• In-app payments
• Telegram Mini Apps
• Web3 integration inside Telegram
• Main risks:
• Heavy dependency on Telegram’s strategic decisions
• Strong competition from L2 networks and high-performance blockchains
Fundamental takeaway:
TON has strong long-term growth potential, but remains a high-volatility asset, making risk management essential.
Final Summary
• TON is at one of its most critical technical levels
• Short-term: high-quality bounce opportunity with defined risk
• Long-term: suitable for gradual accumulation, not all-in entries
• A breakdown below channel support would invalidate the bullish thesis
EURJPY: Bullish Continuation Ahead?! 🇪🇺🇯🇵
There is a high probability that EURJPY will continue
rising after the market opening, following a confirmed
breakout of a resistance line of a bullish flag pattern
on a 4h time frame,
Expect a movement up at least to 184.83 level,
❤️Please, support my work with like, thank you!❤️
I am part of Trade Nation's Influencer program and receive a monthly fee for using their TradingView charts in my analysis.

SILVER - Record High $72.70Executive Summary
Silver just hit an ALL-TIME HIGH of $72.70 on December 24, 2025, capping off a historic year that has seen the precious metal surge +148.54% YTD - outperforming gold's impressive +70% gain. Currently trading at $71.80, silver is riding a powerful ascending channel on the 4H timeframe with no signs of slowing down. Safe-haven demand, Fed rate cut expectations, inclusion on the U.S. critical minerals list, and rising industrial use have created a perfect storm for silver bulls.
BIAS: BULLISH - Strong Uptrend Intact
This is one of the most bullish setups I've seen. +148% YTD, record highs, ascending channel intact, and technicals screaming "BUY." The trend is your friend.
Current Market Context - December 24, 2025
Silver is having a historic year:
Current Price: $71.8050 (+0.50% on the day)
Day's Range: $70.2124 - $72.693
52-Week Range: $28.3390 - $72.693
ALL-TIME HIGH: $72.70 (hit today)
Technical Rating: BUY
Performance Metrics - ALL GREEN (HISTORIC):
1 Week: +12.68%
1 Month: +43.50%
3 Months: +63.61%
6 Months: +96.26%
YTD: +148.54%
1 Year: +142.28%
This is the best performing major asset of 2025. Silver has more than doubled from its 52-week low of $28.34.
THE BIG STORY - Silver Outshines Gold in Historic Rally
Record-Breaking Performance
Silver has surged more than 150% year-to-date, significantly outpacing gold's impressive 70%+ gain. This is gold's biggest annual gain since 1979, and silver is beating it handily.
Key milestones:
ALL-TIME HIGH: $72.70 (December 24, 2025)
Previous record broken multiple times this month
Up 143.56% from 52-week low of $28.94
Up 142.08% from 2025 low of $29.116 (April 4)
Month-to-date: +24.87%
Three consecutive winning sessions
Largest 3-day gain: +9.12% ($5.893)
Why Silver Is Outperforming Gold
Strong investment demand
Inclusion on U.S. critical minerals list
Rising industrial use (solar panels, electronics, EVs)
Tighter supply dynamics
Rotation from gold investment demand
Safe-haven appeal in uncertain times
FUNDAMENTAL DRIVERS - The Perfect Storm
1. Safe-Haven Demand
Geopolitical tensions driving investors to precious metals
U.S. President Trump calling for regime change in Venezuela
Global uncertainty supporting haven assets
Investors flocking to tangible assets
2. Fed Rate Cut Expectations
Markets pricing in two rate cuts for 2026
Non-yielding assets like silver thrive in low-rate environments
Trump wants next Fed chairman to lower rates
Falling U.S. dollar supporting precious metals
Interest rates ticking lower
3. Industrial Demand Surge
Silver added to U.S. critical minerals list
Solar panel production driving demand
Electric vehicle growth increasing silver usage
Electronics and technology applications expanding
Industrial use creating structural demand
4. Supply Constraints
Tight mine supply globally
Limited new production coming online
Inventory drawdowns
Supply unable to keep pace with demand
5. Broader Precious Metals Rally
Gold broke above $4,500 for first time
Platinum up ~160% YTD
Palladium up ~100% YTD
Copper and base metals climbing
Entire commodities complex in bull mode
Expert Analysis
Fawad Razaqzada (City Index/FOREX.com):
"The lack of any bearish factors and strong momentum, all backed by solid fundamentals, which include continued central bank buying, a falling U.S. dollar and some level of haven demand" is supporting precious metals.
Societe Generale Analysts:
"The risk of a major drop in the gold price would seem largely linked to a slowing of outright gold buying, such as by emerging market central banks. Barring such an event, investor positions suggest that the extraordinary surge in gold prices is likely to continue."
Gold target: $5,000/oz by end-2026 (Societe Generale)
ADM Investor Services:
"With the dollar weakening, interest rates ticking lower, and the U.S. President calling for regime change in Venezuela the bull camp has a plethora of bullish themes."
Technical Structure Analysis
Price Action Overview - 4 Hour Timeframe
The chart shows a textbook bullish structure:
Ascending Channel Pattern:
Clear ascending channel established
Lower trendline (support) rising from ~$58 area
Upper trendline (resistance) at ~$73-74 area
Price respecting channel boundaries well
Midline (dashed) providing dynamic support/resistance
Higher highs and higher lows throughout
Recent Price Action:
Strong rally from channel bottom
Price currently near upper channel (~$71.80)
Recent pullback found support at midline
Recovery to new highs
Momentum remains strong
No signs of channel breakdown
Key Observations:
Price at all-time high territory
Channel intact and well-defined
Trend structure extremely bullish
Pullbacks being bought aggressively
Volume supporting the move
Key Support and Resistance Levels
Resistance Levels:
$72.693 - Day's high / immediate resistance
$72.70 - ALL-TIME HIGH
$73.00 - Psychological level
$74.00-$75.00 - Upper channel resistance
$80.00 - Extended bullish target
$100.00 - Major psychological target (analyst projections)
Support Levels:
$71.00 - Immediate support
$70.00 - Psychological support / recent breakout level
$68.00-$69.00 - Channel midline support
$65.00-$66.00 - Secondary support
$62.00-$63.00 - Channel bottom support
$58.00-$60.00 - Major support zone
Channel Analysis
Channel width: approximately $10-12
Channel slope: strongly bullish (steep angle)
Current position: Near upper channel
Midline: ~$68-69 area (dynamic support)
Channel bottom: ~$62-63 area (strong support)
Channel top: ~$73-74 area (resistance)
Moving Average Analysis
Price trading well above all major moving averages
All MAs sloping sharply upward
Golden cross patterns on multiple timeframes
MAs providing dynamic support on pullbacks
Trend structure extremely bullish
Technical Rating
The TradingView technical gauge shows "BUY" - confirming the bullish bias across multiple indicators.
SCENARIO ANALYSIS
BULLISH SCENARIO - Continuation to New Highs
Trigger Conditions:
Price breaks above $73.00 with volume
Channel breakout to upside
Gold continues rally toward $5,000
Fed signals more rate cuts
Dollar weakness continues
Price Targets if Bullish:
Target 1: $73.00-$74.00 - Upper channel
Target 2: $75.00-$76.00 - Channel breakout target
Target 3: $80.00 - Extended target
Moon Target: $100.00 (analyst projections for 2026)
Bullish Catalysts:
Record highs attracting momentum buyers
Gold rally continuing ($4,500+, targeting $5,000)
Fed rate cut expectations
Dollar weakness
Safe-haven demand (Venezuela, geopolitics)
Industrial demand (solar, EVs, electronics)
Critical minerals list inclusion
Supply constraints
Entire precious metals complex in bull mode
BEARISH SCENARIO - Pullback Within Channel
Trigger Conditions:
Rejection at upper channel ($73-74)
Profit-taking after massive rally
Dollar strength
Fed hawkish surprise
Risk-on rotation out of safe havens
Price Targets if Bearish:
Target 1: $70.00 - Psychological support
Target 2: $68.00-$69.00 - Channel midline
Target 3: $65.00-$66.00 - Secondary support
Extended: $62.00-$63.00 - Channel bottom
Bearish Risks:
Overbought conditions after +148% YTD
Near upper channel (potential rejection)
Profit-taking at record highs
Holiday thin volumes
Potential dollar bounce
Fed policy uncertainty
NEUTRAL SCENARIO - Consolidation Near Highs
Most likely short-term outcome:
Price consolidates between $70-$73
Digests recent gains
Builds base for next leg higher
Healthy consolidation after massive rally
Channel midline provides support
MY ASSESSMENT - BULLISH
The weight of evidence overwhelmingly favors bulls:
Bullish Factors (Dominant):
+148.54% YTD - Best performing major asset
ALL-TIME HIGH just hit ($72.70)
Ascending channel intact and well-defined
Technical rating: BUY
Outperforming gold significantly
Multiple fundamental drivers aligned
Safe-haven demand strong
Fed rate cuts expected
Industrial demand surging
Supply constraints
Entire precious metals complex bullish
No bearish factors visible (per analysts)
Bearish Factors (Minor):
Near upper channel (potential short-term resistance)
Overbought after massive rally
Holiday thin volumes
Profit-taking risk at record highs
My Stance: BULLISH - Buy Dips
This is one of the strongest trends in any market right now. +148% YTD with no signs of slowing. The fundamentals are aligned, the technicals are bullish, and the channel is intact. Don't fight this trend.
Strategy:
Buy dips to channel midline ($68-69)
Buy dips to $70 psychological support
Target upper channel ($73-74) and beyond
Tight stops below channel support
Don't short this market
Respect the trend - it's massively bullish
Trade Framework
Scenario 1: Breakout Trade Above $73
Entry Conditions:
4H candle closes above $73.00
Volume confirmation
Gold holding above $4,500
Trade Parameters:
Entry: $73.00-$73.50 on confirmed breakout
Stop Loss: $71.00 below recent support
Target 1: $75.00 (Risk-Reward ~1:1)
Target 2: $78.00-$80.00 (Risk-Reward ~1:2.5)
Target 3: $85.00+ (Extended)
Scenario 2: Buy the Dip at Channel Midline
Entry Conditions:
Price pulls back to $68-69 zone
Bullish rejection candle
Channel midline holds
Trade Parameters:
Entry: $68.00-$69.00 at channel midline
Stop Loss: $65.00 below secondary support
Target 1: $71.00-$72.00 (Risk-Reward ~1:1)
Target 2: $73.00-$74.00 (Risk-Reward ~1:1.5)
Target 3: $75.00+ (Extended)
Scenario 3: Buy at $70 Psychological Support
Entry Conditions:
Price tests $70.00 level
Bullish bounce
Volume spike on recovery
Trade Parameters:
Entry: $70.00-$70.50 at psychological support
Stop Loss: $68.00 below midline
Target 1: $72.00-$72.70 (ATH retest)
Target 2: $73.00-$74.00 (upper channel)
Target 3: $75.00+ (Extended)
Risk Management Guidelines
Position sizing: 2-3% max risk per trade
Respect the channel - it's your guide
Don't short this market
Buy dips, don't chase highs
Use channel levels for entries/exits
Scale out at targets
Move stop to breakeven after first target
Holiday volumes may be thin - use appropriate size
Invalidation Levels
Bullish thesis invalidated if:
Price closes below $62 (channel bottom)
Ascending channel breaks down
Gold crashes below $4,000
Dollar surges significantly
Fed signals no more rate cuts
Bearish thesis invalidated if:
Price closes above $75 (channel breakout)
New all-time highs with momentum
Gold breaks $5,000
Industrial demand accelerates further
Conclusion
Silver is having a historic year. With +148.54% YTD gains, it's the best performing major asset of 2025, significantly outpacing gold's impressive +70% rally. The precious metal just hit an ALL-TIME HIGH of $72.70 and shows no signs of slowing down.
The Numbers:
Current Price: $71.8050
ALL-TIME HIGH: $72.70
YTD Performance: +148.54%
1-Year Performance: +142.28%
52-Week Low: $28.34
Technical Rating: BUY
Key Levels:
$72.70 - ALL-TIME HIGH
$73.00-$74.00 - Upper channel resistance
$71.80 - Current price
$70.00 - Psychological support
$68.00-$69.00 - Channel midline
$62.00-$63.00 - Channel bottom (major support)
The Setup:
Silver is in a powerful ascending channel with all fundamentals aligned. Safe-haven demand, Fed rate cuts, industrial demand, and supply constraints have created the perfect storm. The technical rating is "BUY" and the trend is undeniably bullish.
Strategy:
Buy dips to $68-70 support zone
Target $73-74 (upper channel) and $75+
Stops below channel support
Don't fight this trend
Respect the channel
Analysts are targeting gold at $5,000 by end-2026. If silver continues to outperform, $100 silver is not out of the question.

AVAXUSDT - The hunt for liquidity before the fall BINANCE:AVAXUSDT , within the context of a global downtrend and low liquidity associated with market conditions, is forming a short squeeze ahead of a possible decline.
The global trend is protracted and downward, which generally indicates the dominance of bears in the medium and long term.
Bitcoin is consolidating against the backdrop of a downward trend, which generally creates negative sentiment in the market.
AVAX is forming a short squeeze of consolidation resistance at 12,460, formed against the backdrop of a global downward trend. This is a manipulative maneuver to accumulate liquidity before a possible decline.
If the bears keep the price below 12.540 - 12.460, then a decline can be expected in the short and medium term.
Resistance levels: 12.46, 12.54
Support levels: 12.03, 11.94, 11.26
A false breakout of resistance could confirm the end of the correction or consolidation and trigger a continuation of the main downtrend.
Best regards, R. Linda!

BTCUSDT: Buyers Defend 86K Support, Upside in FocusHello everyone, here is my breakdown of the current BTCUSDT setup.
Market Analysis
BTCUSDT has shifted its structure after breaking out of a prolonged Downward Channel, signaling a loss of bearish control and the start of a stabilization phase. Following the breakout, price entered a broad range, bounded by a clear Resistance Zone around 90,300 and a Support Zone near 86,000. This range reflects market indecision after the strong sell-off.
Currently, price has formed a triangle structure, with descending resistance and ascending support lines, indicating compression and preparation for a directional move. Recently, BTCUSDT tested the lower boundary of the range and successfully defended the Support Zone, followed by a breakout from the short-term structure, suggesting renewed buyer interest. Current price action shows consolidation above support, favoring a bullish continuation scenario.
My Scenario & Strategy
My primary scenario is bullish as long as BTCUSDT holds above the 86,000 support zone. The recent pullback appears corrective within the broader recovery structure. I expect price to continue higher toward the range high and resistance zone around 90,300.
Therefore, a clean breakout and acceptance above this resistance would confirm bullish continuation and open the path for further upside expansion. However, a sustained breakdown below the support zone would invalidate the bullish setup and increase the risk of a deeper move lower. For now, structure and price behavior favor buyers while support remains intact.
That's the setup I'm tracking. Thank you for your attention, and always manage your risk.

GOLD - The market may update its ATH after a correction...FX:XAUUSD bounces off 4475 and updates its local maximum in the distribution phase to 4519.4. Against the backdrop of low liquidity associated with the end of the calendar year, movements may be sharp and unpredictable...
The fundamental background remains unchanged, supporting gold: a weak dollar, tense geopolitical situation, mixed data from the US. However, the main problem at the moment is low liquidity due to the holidays.
The Asian market bought up the supply and drove up the price. After such a strong movement, the market may enter a consolidation or correction phase, during which it may test 4508-4500 before rising.
Resistance levels: 4519, 4526, 4550
Support levels: 4508, 4500
A low-liquidity market is easier to manage (in terms of manipulation). Accordingly, use strong setups and short targets for trading, as movements can be sharp and unpredictable.
I expect the bull market to continue after the correction.
Best regards, R. Linda!

XAUUSD Maintains Support – Buyers Eye $4,560Hello traders! Here’s my technical outlook on XAUUSD (Gold, 2H) based on the current chart structure. Gold continues to trade within a well-defined ascending channel, confirming a sustained bullish market structure. After a prolonged consolidation phase (range) on the left side of the chart, price successfully broke above resistance, signaling a shift in control from sellers to buyers. This breakout marked the beginning of the current impulsive bullish leg. Following the breakout, price accelerated higher and is now approaching the Seller / Resistance Zone around 4,500–4,510, where selling pressure has started to appear. The recent pullback is bringing price back toward the Buyer Zone near 4,430, which aligns with the previous breakout level and the midline/support of the ascending channel. This confluence makes the area a key demand zone to watch. Structurally, the pullback remains corrective, with price still holding above channel support and the broader bullish trend intact. My scenario: as long as Gold holds above the 4,430 Buyer Zone, the bullish structure remains valid. A strong reaction from this area could trigger another push toward the 4,560 (TP1) and potentially higher if a clean breakout occurs. A decisive breakdown below the buyer zone would signal a deeper correction. For now, buyers remain in control while price respects the ascending channel. Please share this idea with your friends and click Boost 🚀

GOLD - Hunting for liquidity ahead of growth. Focus on 4475FX:XAUUSD reached a new historic high of around $4,525. However, profit-taking is causing a correction, with the 4,475-4,470 range being the area of interest in the bull market.
The dollar is weakening, with the market anticipating two rate cuts in 2026. Geopolitical risks are supporting demand for safe-haven assets. Positive US GDP data for Q3 (+4.3%) did not support the dollar due to expectations of a slowdown in growth in Q4.
The dollar index has hit its lowest level since early October. Today, US jobless claims data will be released, which may increase volatility. The overall positive sentiment in the stock markets is holding back more active growth in gold.
The upward trend in gold continues. Any significant correction is likely to be seen as a buying opportunity, given the Fed's accommodative monetary policy and geopolitical uncertainty.
Resistance levels: 4500, 4525
Support levels: 4475, 4470, 4466, 4452
Focus on the current trading range of 4475-4525. A false breakdown of support could attract buyers waiting for favorable prices. I do not rule out a retest of 4452-4442 before growth (against the backdrop of aggressive profit-taking).
Best regards, R. Linda!

LLY | This Healthcare Co. Is a Great Pick | LONGEli Lilly & Co. engages in the discovery, development, manufacture, and sale of pharmaceutical products. The firm's products consist of diabetes, oncology, immunology, neuroscience, and other products and therapies. The company was founded by Eli Lilly in May 1876 and is headquartered in Indianapolis, IN.

XAUUSD Long: Demand Zone Holds, $4,540 in SightHello traders! Here’s a clear technical breakdown of XAUUSD based on the current chart structure. Gold previously completed a corrective phase after breaking above a descending resistance line, which marked a shift in market control from sellers to buyers. Following this breakout, price entered a consolidation Range, where the market absorbed supply and built a base before the next impulsive move higher. After leaving the range, XAUUSD accelerated into a strong bullish leg and formed an ascending channel, confirming sustained buying pressure. The breakout above the channel base was decisive, and price continued to print higher highs and higher lows. Recently, gold reached the Supply Zone around 4,500, where selling pressure appeared and caused a short-term rejection. This reaction pushed price back toward the Demand Zone near 4,430, which aligns with the channel support and previous breakout structure.
Currently, price is pulling back in a controlled manner within the bullish channel. The rejection from supply looks corrective rather than impulsive, suggesting profit-taking instead of trend reversal. Buyers are expected to defend the demand area as long as the channel structure remains intact.
My scenario: as long as XAUUSD holds above the 4,430 Demand Zone, the bullish structure stays valid. A strong reaction from this area could lead to another push toward the 4,500 Supply Zone, with a potential continuation toward 4,540 if a clean breakout occurs. A decisive breakdown below demand would invalidate the bullish setup and signal a deeper correction. For now, the bias remains bullish while price respects the ascending channel. Manage your risk!
