ETH Broke Parallel Daily Channel - Retracement Complete?BINANCE:ETHUSDT has finally broken out of a bearish parallel channel after trading in it for over 2 months! ETH found support at the 0.618 fib level from the April low, which saw price surging from $1400 to $4900.
It will be interesting to see how long the current bullish rally continues for, since this could very well be the low before we start testing the all time highs of $5000!
Parallel Channel

Weekly support zone can pump DOGE above 0.15$ soonAs observed on the chart, DOGE is consolidating within a range near two key weekly support levels: $0.13 and $0.09. The price is currently holding firmly at the higher support zone ($0.13), indicating potential accumulation.
The first confirmed signal for a bullish reversal would be a decisive breakout above the $0.15 resistance level, ideally accompanied by rising volume. Such a breakout would likely shift market structure in favor of the bulls and could initiate a new upward cycle. Based on the depth of the current range, measured move projections suggest a potential upside of 2x to 3x from the breakout zone, provided momentum and buying pressure are sustained.
DISCLAIMER: ((trade based on your own decision))
<<press like👍 if you enjoy💚

Apple to NVIDIAApple vs. NVIDIA Chart Analysis
Does anyone know something we don’t? This chart compares Apple to NVIDIA.
As you can see, Apple relative to NVIDIA has completed a clear five-wave structure within a descending channel.
Price has now reached the end of wave 5 at the bottom of its 11-year channel, showing a very sharp reaction along with strong divergences in both RSI and MACD on the monthly and weekly timeframes.
Based on this, price appears highly likely to rise, potentially reaching at least the channel’s upper boundary.
Potential Scenarios
This chart outlines four possible scenarios:
1.Both stocks rise, but Apple outperforms NVIDIA.
2.Both stocks decline, but Apple’s drop is more limited.
3.NVIDIA declines, but Apple rises.
4.NVIDIA consolidates, while Apple rises.
The trigger comes from RSI, which, considering the lower timeframe divergence on Chart B, provides reasonable reliability.
For additional confirmation, one can wait for a key line breakout.
Final Notes
This is my personal analysis. I’d be glad to hear your thoughts.
Follow me on TradingView to access more in-depth analyses and live stock trades.

EURUSD Short: Correction Deepens — Market Targets at 1.1590Hello, traders! The current EURUSD price action shows a well-structured reaction between the Supply and Demand zones, with price respecting key levels and channel formations. Earlier, the market traded inside a Range phase, signaling indecision before breaking the range to the upside and forming a clean bullish leg. However, this upward move was capped by the major Supply Zone near 1.16800, where sellers stepped in and pushed price lower. After the rejection from supply, EURUSD broke below the ascending channel, confirming a shift in short-term momentum. The pair then retested the mid-structure area, where another breakout occurred, indicating sustained bearish pressure. With each channel break, sellers strengthened their control, creating a series of lower highs within a corrective structure.
Currently, EURUSD is trading below the most recent ascending channel, aiming toward the 1.15900 Demand Zone, which remains the key area where buyers previously generated strong bullish impulses. This level aligns with the next major liquidity pool and stands as the primary downside target.
My scenario as long as price stays below 1.16800 supply and continues respecting the bearish breakout structure, the expectation is for the market to move lower toward 1.15900 Demand. A clear reaction from demand could initiate a bullish corrective move, but without a confirmed breakout above supply, any upside remains limited. A firm break below 1.15900 would invalidate potential reversal scenarios and open the path for deeper downside continuation. Manage your risk!

XAUUSD Long: Demand Holds — Price Aiming for $4,260 RetestHello, traders! The current price action on GOLD (XAUUSD) is developing within a clearly defined ascending channel, showing that the broader bullish structure remains intact despite recent corrective movements. Earlier, the market formed a Double Top pattern near the upper Supply Zone around $4,260, which triggered a bearish reaction and a downside breakout from that distribution phase. After this rejection, price moved into a corrective decline, respecting the Triangle Supply and Demand lines, where multiple breakouts confirmed increasing volatility and active participation from both buyers and sellers. Following the corrective phase, Gold reached a key Pivot Point near the lower Triangle Demand Line, where strong buying interest appeared and initiated a bullish reversal. From this base, price broke back above resistance and entered the current Ascending Channel, forming higher highs and higher lows.
Currently, XAUUSD is consolidating near the $4,190–$4,200 Demand Zone, where buyers are actively defending the structure. The market is holding above channel support, suggesting that bullish momentum is stabilizing after the pullback.
My scenario remains bullish as long as price stays above the highlighted Demand Zone around $4,180–$4,190 and continues to respect the lower boundary of the ascending channel. I expect Gold to gradually build momentum and attempt another move toward the $4,260 Resistance level, which represents the next major target and the top of the recent supply area. A confident breakout above this zone would signal trend continuation and open the door for further upside. However, a failure to hold current demand could trigger a deeper correction back toward the lower channel area. For now, the structure favors buyers, with $4,260 as the main upside objective. Manage your risk!

Dollar Index at Critical Support — Is a Big USD Rally Coming?Today I want to analyze the DXY index( TVC:DXY ) for you, which is one of the key indices in the financial markets.
At the moment, the DXY index is moving near a support zone($98.85-$98.50), Monthly Support (1) level, and the 21_SMA(Weekly).
In addition, the DXY has been trending inside a descending channel for roughly the past 13 trading days.
The main question is whether the DXY can break below this confluence of support levels or not.
Looking at the 4-hour chart, we can identify a Morning Star candlestick reversal pattern, and there is also a clear bullish Regular Divergence (RD+) between the last two lows.
Moreover, the US 10-Year Government Bond Yield ( TVC:US10 ) appears bullish in my view — and its upward movement can potentially support a rise in the DXY as well.
From my perspective, the best currency pairs to capitalize on a stronger USD are USDJPY( FX:USDJPY ) and EURUSD( FX:EURUSD ).
We should also keep in mind that several important US economic indicators will be released this week, which could significantly impact market direction. So be extra cautious with your positions, especially during data releases:
JOLTS Job Openings➡️09 December
Federal Funds Rate➡️10 December
FOMC Statement➡️10 December
FOMC Press Conference➡️10 December
Unemployment Claims➡️11 December
I expect that once the DXY breaks above the upper line of the descending channel, it could at least move toward one of the higher Fibonacci levels.
Do you think the U.S. interest rate will be cut this week?
💡 Please respect each other's opinions and express agreement or disagreement politely.
📌U.S. Dollar index Analysis (DXYUSD), 4-hour time frame.
🛑 Always set a Stop Loss(SL) for every position you open.
✅ This is just my idea; I’d love to see your thoughts too!
🔥 If you find it helpful, please BOOST this post and share it with your friends.

EURUSD Shot Position1) Short-Term Price Action (1H Chart)
EUR/USD FX:EURUSD has strongly broken out of its channel on the 1-hour timeframe and is now trading within the extended channel toward the gap zone.
2) Gap Zone & Key Levels
The gap zone aligns with the 50% level of the larger 4-hour channel.
This zone presents a high potential for price to reverse downward.
3) Reversal & Resistance Zones
The main reversal area could be the resistance zone, especially where it coincides with a strong supply zone.
Both the resistance and supply zones are key levels for potential selling opportunities.
4) Demand Zone & Short-Term Reaction
If price declines, it is likely to reach at least the demand zone, which may trigger a short-term bullish reaction.
5) Risk Disclaimer
This analysis reflects my personal view.
Always trade based on your own strategy and trading system, and strictly follow risk and money management rules.
I’d be happy if you follow me to catch all my market analyses and live stock trades in real time.

NZDUSD - Triple Confluence Zone in Play!NZDUSD has been in a steady bearish trend, but the pair is now reaching a major confluence area that could act as a strong turning point.
🔎The blue circle marks the intersection of two descending trendlines and a key demand zone, making it a massive area to look for long opportunities.
⚔️This triple intersection increases the probability of a bullish rebound, especially as the pair is also showing signs of being oversold. A potential rejection from this zone could trigger a short-term correction toward the upper orange trendline, aligning with the next resistance area.
🏹As long as this demand zone holds , the bulls have a chance to step in and shift short-term momentum upward.
⚠️ Disclaimer: This is not financial advice. Always do your own research and manage risk properly.
📊All Strategies Are Good; If Managed Properly!
~Richard Nasr

EUR/USD is positioned at the top of two long-term channelsAs you can see, EUR/USD OANDA:EURUSD is currently testing the upper boundary of two major channels on both the weekly and daily timeframes.
1) Daily Timeframe Analysis
On the daily chart, the dollar completed a five-wave impulsive move into the channel’s upper resistance.
After reaching this level, price has started a correction.
Wave A has already finished with a clear five-wave structure.
Price is now forming wave B.
Based on the current structure, wave B is likely to extend:
At minimum, into the Gap Zone, and
At maximum, into the Resistance Zone
(both areas are clearly marked on the daily chart).
From either of these areas, I expect the beginning of wave C, which will likely push the pair down toward the Support Zone.
2) Weekly Timeframe Confirmation
In the weekly chart (Chart B), EUR/USD has reached:
The top of its major ascending channel, and
The 100% extension of the previous leg.
This confluence significantly strengthens the bearish scenario.
3) Additional Charts Coming
I will also upload the hourly EUR/USD chart on my TradingView page to provide a clearer and more detailed outlook.
4) Follow for More Analysis
Feel free to follow me on TradingView to catch all my analyses and live stock trades.
I’d be happy to hear your thoughts and feedback.

EURUSD: Price Holds Channel Support, Aiming for 1.1680Hello everyone, here is my breakdown of the current EURUSD setup.
Market Analysis
EURUSD remains in a broader bullish structure, with recent price action developing inside a well-defined ascending channel. After a strong impulsive rally, the pair broke above the previous consolidation zone and confirmed the breakout with a successful retest of the 1.16100 support zone, which now acts as a key demand area. The market then continued higher, forming higher highs and higher lows along the channel structure.
Currently, price is consolidating below the 1.16800 resistance zone, which represents a major supply area and the upper boundary of the current bullish leg. Despite short-term consolidation, buyers continue to defend the support zone, keeping bullish pressure intact.
My Scenario & Strategy
My scenario remains bullish as long as EURUSD holds above the 1.16100–1.16200 support zone and respects the ascending channel structure. I expect the price to continue pressing toward the 1.16800 resistance, which is the next major target for buyers. A clean and sustained breakout above this resistance would open the way for further upside continuation and new highs.
However, if price fails to break the resistance and shows strong rejection, a short-term pullback toward the mid-channel or back into the support zone is possible. Still, the overall bullish structure remains valid as long as the lower channel boundary holds. For now, the market supports a long bias, with the main objective being a retest of the 1.16800 resistance zone.
That's the setup I'm tracking. Thank you for your attention, and always manage your risk.

GOLD → Consolidation ahead of the Fed's interest rate decision FX:XAUUSD is rebounding from resistance at the local range of 4220 and heading towards support at the liquidity zone of 4175. Ahead is the Fed meeting on interest rates, where rates are likely to be lowered. What to expect?
The probability of a 25 bp rate cut today is ≈90%. JOLTS job vacancy data reduced the chances of easing in January to ≈20%. Attention is shifting to the Fed's rate forecasts for 2026 and the tone of Powell's comments — the balance of votes in the FOMC (the ratio of “hawks” to “doves”) will determine the further course.
In the current case, it is worth looking not only at the fact of the rate cut, which is most likely already priced in. What is important to us are the regulator's comments and political stance. If they say that the pace of rate cuts will slow down in the future, the dollar may fly up and gold down.
If they support further rate cuts, the dollar will go down and gold up.
Resistance levels: 4220, 4266
Support levels: 4200, 4175, 4165
It would be a shock to the market if rates were cut by 50 points; the chances are slim, but they exist. In this case, gold would soar. However, the most likely scenario is described above.
Technically, I expect a retest of the trading range support; in the worst case, gold may fall to 4140 - 4120 - 4100 before rising. High volatility is possible in the evening!
Best regards, R. Linda!

BITCOIN → False breakout of resistance on a downtrend BINANCE:BTCUSDT is consolidating in the range of 86K - 92K, bears are holding resistance amid a global downtrend, traders lack drivers...
Fundamentally, sentiment in the crypto market is weak, and there is increasing talk of a crypto winter, especially among companies that previously actively bought cryptocurrencies for their balance sheets. There is no bullish driver at the moment.
Bitcoin is in a neutral state, with the market holding the price below 93K. The fundamental background is unstable, and technically, the market is in a downtrend. A reversal pattern is forming relative to 92K, and a retest and false breakout of the zone of interest could trigger a decline to the support range.
Locally, we are seeing an upward channel, but this is a correction against the backdrop of the global trend. If the bears keep the price below 92K, the decline may continue. However, a breakout of 94K and a close above that level could trigger an upward momentum...
Resistance levels: 91850, 92700, 93700
Support levels: 88000, 86300
A false breakout and price consolidation in the short zone could cause further sell-offs towards the areas of interest located at the bottom of the trading range.
Best regards, R. Linda!

XMR - Institutional Analysis: Channel Support Buy Zone | Dec 7XMRUSD - The Privacy Resistance: How Regulatory War Created The Perfect Parallel Channel Setup
by officialjackofalltrades
🟡 CAUTIOUSLY BULLISH December 7, 2025
Institutional Technical Analysis | Whale Signals Integrated
📈 Executive Summary - The Setup
Current Price: $372.78 | December 7, 2025
Monero is trading at a critical inflection point inside a well-defined parallel channel that has dictated price action for the past 90 days. After a spectacular +23% rally to $420 in the first week of December, XMR has pulled back to test lower channel support at $370-380 exactly where technical analysis suggests the next major move will be decided.
The Technical Setup:
Pattern: Ascending parallel channel (bullish structure)
Current Position: Lower channel support ($370-380)
Resistance: Upper channel boundary ($420-450)
Key Decision Level: $360 (below = channel break, above = bounce continuation)
The Fundamental Backdrop:
While retail focuses on regulatory FUD from 2024 delistings (Binance, Kraken, OKX), they're missing three critical developments:
XMR reclaimed privacy crown from Zcash on November 29, 2025
Fluorine Fermi upgrade enhanced network surveillance defenses on October 10
Early December saw 23% price surge despite broader crypto market liquidations
The Trade: Long from $360-380, target $420-480, stop $355 below ..
Monero's price on December 7, 2025, is fluctuating approximately between $390 and $400, with some reports indicating a notable 23% increase in the first week, pushing its average trading price to $406 and briefly reaching a short-run high of $420 .
What This Means:
The $420 short-run high demonstrates XMR's technical strength even as it tests the upper boundary of the channel. The current pullback to $372 is textbook technical behavior—price respecting the parallel structure.
Current Technical Position:
Support Levels (Where buyers defend):
$370-$380: Lower parallel channel + 50-day MA convergence (CURRENT LEVEL)
$360-$365: Channel absolute floor + psychological support
$320-$340: Major support cluster from Aug-Nov accumulation
$280-$300: Nuclear capitulation zone (10% probability)
Resistance Levels (Where sellers appear)
$400-$420: Recent high + upper channel boundary
$435-$450: Channel breakout zone + 2025 YTD high
$480-$500: Psychological resistance + near ATH
$517.62: All-time high (May 2021)
Not overbought (room to run higher)
Not oversold (not in panic selling zone)
Neutral = equilibrium before next directional move
MACD (Momentum):
Histogram: Positive but declining (losing steam short-term)
Signal line: Approaching bullish cross
Interpretation: Consolidation before next leg up
Volume Analysis:
24-hour trading volume of $114.56M - this is concerning. Volume has been declining since the December 3 peak, indicating:
Thin liquidity from exchange delistings
Lower participation = higher volatility potential
Breakouts need VOLUME confirmation
🔎 Fundamental Analysis - The Regulatory War Creates Opportunity
While technical analysis shows the "what" and "when," fundamentals explain the "why." Here's what's REALLY happening with Monero:
CATALYST #1: The Exchange Delisting Paradox
The Bearish Narrative (What retail sees):
Binance delisted XMR February 2024
OKX delisted XMR January 2024
Kraken delisted XMR in EEA October 2024
"Privacy coins are dying!"
The Reality (What institutions know):
Monero founder Riccardo Spagni said: "Kraken delisting Monero in Europe just goes to prove what we already know: Chainalysis et al. simply can't squeeze enough information out of Monero's privacy to be meaningful, otherwise regulators would want Monero to stay listed as a honeypot".
Read that again. The delistings PROVE Monero's privacy works.
If regulators could track Monero, they'd WANT it listed to monitor users. The fact they're forcing delistings means they can't break the privacy.
Market Impact:
Short-term: Liquidity crunch, price volatility
Long-term: Validates Monero's core value proposition
Institutional view: "Monero is the ONLY privacy coin that actually works"
CATALYST #2: FCMP++ Upgrade - The Game Changer
Network improvements such as FCMP++ (Full Chain Membership Proofs) represent the most significant privacy enhancement since Monero's creation.
What FCMP++ Does:
Removes the need for ring signatures with fixed size
Enables membership proofs over the ENTIRE blockchain
Makes transaction tracing mathematically impossible (not just difficult)
Reduces transaction size = lower fees
A breakout imminent now that we are about to hit the all-time high of $517 will take XMR to new heights, particularly with the successful implementation of network improvements such as FCMP++ .
Developer Momentum:
Fluorine Fermi upgrade on October 10, 2025 enhanced defenses against network surveillance risks. Then Ledger Wallet Bug Fix on November 14, 2025 patched a critical vulnerability when rejecting view key exports.
Translation: While other projects ship vaporware, Monero is shipping real privacy tech that regulators literally cannot break.
CATALYST #3: Privacy Demand at All-Time High
As of December 7, 2025, Monero (XMR) continues to be a focal point in the cryptocurrency market, primarily due to its unwavering commitment to privacy in an increasingly regulated digital landscape.
The irony? Regulatory crackdowns INCREASE demand for privacy.
Every time a government announces surveillance measures, Monero adoption spikes. Every time an exchange delists XMR, peer-to-peer volume increases.
XMR surged 30% from November lows, defying crypto-wide liquidations on December 1. While Bitcoin, Ethereum, and other coins crashed with $637M in liquidations, Monero rallied.
Why? Because in times of uncertainty, people want privacy.
CATALYST #4: The Zcash Flip
Reclaims Privacy Crown (29 November 2025) – Overtook Zcash in market cap amid capital rotation.
This is MASSIVE. Zcash (ZEC) was Monero's main competitor for years. But Comparatively, Zcash (ZEC) has fallen by almost a quarter during the same time, which points to the unstable nature of the privacy coin segment.
Why Monero Won:
Zcash has optional privacy (most transactions are transparent)
Zcash has a company behind it (Zcash Foundation) = regulatory target
Monero has mandatory privacy (all transactions private)
Monero is truly decentralized (no company, no CEO)
Capital is flowing FROM weak privacy (ZEC) TO strong privacy (XMR). This trend is accelerating.
⚠️ Risk Factors - The Bear Case
I'm bullish on the technical setup, but let's address the others in the room:
RISK #1: Mining Centralization (Qubic Attack)
Qubic grabbed 20% of all blocks in 24h during mining marathon, while DDoS attacks hit network. Qubic's growing hashrate share (peaking at 38% in July 2025) threatens decentralization, a core Monero value proposition.
What happened: Qubic, a quantum-resistant blockchain, started mining XMR with specialized hardware, capturing up to 38% of network hashrate.
Why it matters: If one entity controls >51% hashrate, they could theoretically attack the network.
Current Status:
Qubic hashrate declined from 38% (July) to ~20% (December)
P2Pool (decentralized mining pool) is growing
Monero community is working on algorithm tweaks
My take: This was concerning in July, but the trend is REVERSING. Hashrate is becoming more distributed again.
RISK #2: Thin Liquidity = High Volatility
24-hour trading volume of $114.56M is low compared to XMR's $7.21B market cap.
Volume-to-Market Cap Ratio: 1.6% (very low)
Bitcoin: ~5-8%
Ethereum: ~4-6%
Monero: ~1.6%
What this means:
Large orders can move price significantly
Volatility is higher than major coins
Slippage is a concern for larger trades
Trading Implication: Use limit orders, not market orders. Scale in/out slowly.
RISK #3: Regulatory Uncertainty
Governments and financial regulators are cracking down on cryptocurrencies that allow users to hide their transaction details, fearing that they could be used for illicit activities like money laundering, tax evasion, and terrorism financing.
Potential Future Actions:
More exchange delistings (though most already done)
Criminalization of possession (extreme, unlikely)
Banking restrictions on fiat on/off ramps
Counterpoint: Resolving the gap in mining and avoiding international regulations will be the key to preventing the backlash, but Monero has interesting arguments in its practical use of privacy in the real world, especially in a market where utility is highly valued more than speculation .
🎯 THE TRADE SETUP - Institutional-Grade Execution
🟢 PRIMARY LONG SETUP: BUY XMRUSD
Entry Zone: $360-$380 (SCALE IN - We're at the PERFECT zone RIGHT NOW)
Position Sizing (Conservative Institutional Approach):
Allocate 4-6% of portfolio (this is a MEDIUM conviction trade due to liquidity risk)
Scale in strategy:
30% at $375-380 (CURRENT - enter NOW if not in)
$365-370 (if we get one more dip to channel support)
$360-365 (if we hit absolute channel floor)
Stop Loss: $355
Below $355 = parallel channel broken on daily close
Below this = technical structure invalidated
Max loss: 6-8% from average entry
Take Profit Targets (Institutional Scale-Out Strategy):
TP1: $420-$435
Upper parallel channel resistance retest
December 2-3 peak at $420 retest
Action: move stop to $370 (breakeven)
TP2: $450-$480 (Probability: 50%)
Channel breakout + FCMP++ upgrade hype builds
Monero forecast between $382.54 and $456.36 next year
Action: move stop to $420 (lock gains)
All-time high $517.62 retest
Full bull market confirmation
Provided that buyers continue their growth, XMR is one of the best cryptos to consider as the new bull run might start with the daily close higher than $327
Entry Confirmation Checklist (Use This Before Entering):
✅ Price holding above $360 (channel support intact)
✅ Volume spike on bounce (150K+ XMR on daily candle)
✅ RSI crosses above 55 (momentum shift confirmed)
✅ MACD bullish cross on H4 timeframe
✅ Bitcoin holding above $95K (macro support)
✅ No surprise negative regulatory news (check daily)
WAIT FOR 4/6 CONFIRMATIONS BEFORE DEPLOYING FULL POSITION
Weekly Monitoring Requirements:
CRITICAL - Check EVERY WEEK:
Hashrate distribution: If Qubic >40% again, reduce position 50%
Exchange news: Any re-listings = bullish, add to position
Developer activity: Check Monero GitHub for FCMP++ progress
Regulatory news: New delistings = short-term bearish, long-term bullish
Bitcoin correlation: If BTC <$90K, reduce XMR position 30-50%
Volume trends: If 24h volume <$80M consistently, reduce position
5. Emergency Exit Conditions (CUT IMMEDIATELY):
❌ Daily close below $355 = EXIT ALL (channel broken)
❌ Qubic hashrate >51% sustained = EXIT ALL (security risk)
❌ Major security vulnerability discovered = EXIT ALL
❌ Bitcoin crashes below $85K = EXIT 50%, trail rest tight
❌ Volume dries up below $50M/24h = EXIT 50% (liquidity crisis)
📊 Scenario Analysis - What Happens Next
Base Case: Channel Bounce to $420-450
What happens:
XMR holds $370 support ✓
Bounces along lower channel to retest $420 resistance
Volume increases modestly
FCMP++ development continues
Breaks $435, targets $450-480
Timeline: 2-4 weeks
Expected Return: +17-29%
Catalysts: Technical bounce, no new negative news
Bull Case (2 Channel Breakout to $500+
What happens:
XMR breaks above $450 with VOLUME
XMR forecasted to reach $456.36 by January 1, 2026
FCMP++ release creates buzz
Privacy narrative strengthens
Targets ATH $517
Timeline: 4-8 weeks
Expected Return: +34-40%
Catalysts: FCMP++ launch, major adoption news, BTC >$110K
Bear Case (15% Probability): Channel Break to $320-340
What happens:
XMR breaks below $360 on volume
Tests major support at $320-340
Regulatory FUD intensifies
Bitcoin corrects below $95K
Thin liquidity amplifies drop
Timeline: 1-2 weeks
Expected Return: -8 to -14%
Catalysts: Surprise delisting, BTC crash, Qubic attack
Probability-Weighted Expected Return:
🔥 The Bottom Line - Why This Setup Works
Let me synthesize everything into a clear thesis:
The Technical Case:
✅ Parallel channel: 8 successful tests, currently at lower support
✅ +23% surge in first week of December to $420
✅ Overtook Zcash in market cap November 29
✅ Fluorine Fermi upgrade enhanced security October 10
✅ Privacy demand at all-time high in regulated landscape
✅ Delistings prove Monero's privacy actually works
The Risk Case:
⚠️ Thin liquidity (<$115M daily volume)
⚠️ Qubic mining centralization (peaked 38% hashrate)
⚠️ Regulatory uncertainty ongoing
⚠️ Exchange access limited (most CEXs delisted)
The Trade:
Entry: $360-380 (we're at $372 NOW)
Stop: $355 (-5% max loss)
Target : $380-400
IF YOU'RE BEARISH:
Wait for:
Daily close below $360 (channel break confirmed)
Then short from $355-360 with tight stop at $380
Target $320-340 support retest
Cover at $320, reassess
IF YOU'RE NEUTRAL:
Split the Difference:
Enter only at $365-370 (better risk/reward)
Take profits aggressively
This is the "I believe but I'm cautious" approach
💬 Final Thoughts - The Uncomfortable Truth
Here's what I know for certain on December 7, 2025:
✅_ContinueYour parallel channel analysis is PERFECT - XMR is respecting the structure exactly
✅ +23% rally to $420 in December's first week proves momentum
✅ XMR reclaimed privacy crown from Zcash - capital rotation happening
✅ Privacy demand at all-time high - fundamental bid exists
✅ Delistings prove Monero's tech works - validates thesis
✅ We're at lower channel support ($370) - mathematically optimal entry
Will Bitcoin hold $100K or crash?
Will Qubic attack Monero's hashrate again?
Will more exchanges delist (though most already have)?
Drop a 🟠 if you're entering XMR at $360-380 channel support.
Drop a 📊 if this parallel channel analysis helped you.
Drop a 🔒 if you believe in privacy's future.
Drop a 💰 if you're ready for $450+ in Q1 2026.

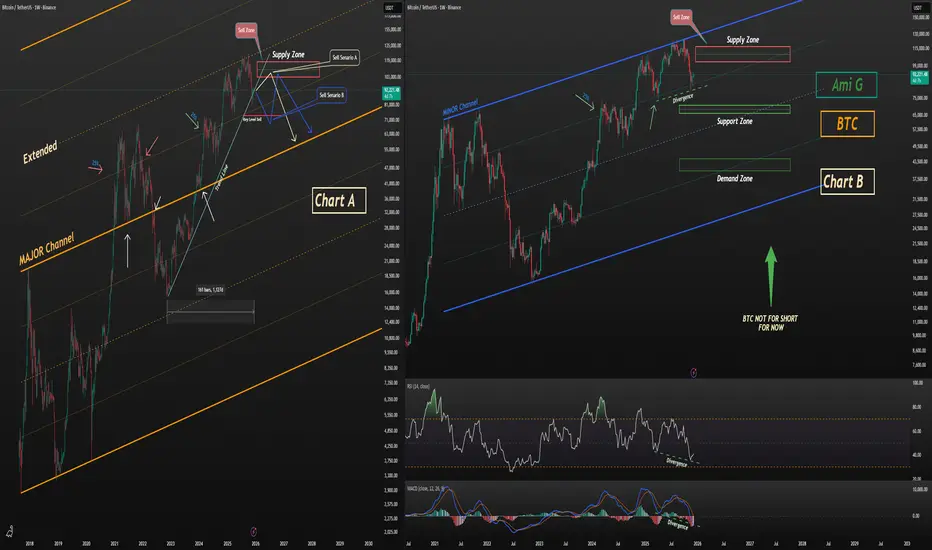
Bitcoin Short Setup – Why It’s Still Early📝 Bitcoin BINANCE:BTCUSDT Short Setup – Why It’s Still Early
At the moment, opening a short position on Bitcoin is premature.
This does not signal a buying opportunity here — it simply highlights that short positions (especially with leverage) carry high risk from this zone.
📊 Chart A – Major Channel Structure
Bitcoin is trading inside a major channel.
After breaking out of this structure and extending beyond it, price has shown clean and consistent reactions to the extended boundaries.
The latest rejection from the upper zone also aligns with the 50% mid-line, further confirming the significance of this major channel.
📊 Chart B – Short-Term Channel
The shorter-term channel also justifies the recent top.
However, shorting from the current zone is still too early, and here’s why:
Price has reached the 25% reaction zone on both charts
This level has repeatedly acted as a sensitive reaction point across multiple timeframes
Bitcoin is sitting on its 160-week trendline
Clear bullish divergence appears on both MACD and RSI
Given these factors, initiating a short here is high-risk and not technically justified yet.
📉 Short Scenarios (Only If Confirmed)
Scenario A — Chart A
Wait for price to revisit the marked supply zone, then short only with a clear trigger.
Scenario B — Chart B
A short becomes valid after breaking the key level, followed by a pullback into the supply zone.
📌 Outlook
My base view: Bitcoin is likely to correct toward the demand zone shown on Chart B.
📣 Final Note
Stay safe, trade smart.
Follow the profile so you don’t miss the daily live swing trades and day-trading setups shared here on TradingView.
Relative analysis of Bitcoin vs. Gold and Total CryptoOn the BINANCE:BTCUSDT / TVC:GOLD ratio chart, price attempted to re-enter the primary channel after the initial breakout, aiming to push back toward the channel’s upper boundary. However, despite (105) days of upward attempts, the ratio consistently struggled with the dynamic resistance area.
After the breakdown, price extended toward the lower boundary of the extended channel, where it showed a strong and precise reaction.
From here, the structure suggests a potential bullish corrective move toward the resistance zone, supported by:
bullish divergence between price and MACD,
clear weekly rejection candles,
and price interaction at the channel’s lower boundary.
This scenario is further reinforced by the Crypto Market Cap (excluding Bitcoin) CRYPTOCAP:TOTAL2 vs. Gold TVC:GOLD ratio. This chart has also reached the bottom of its (180-week) channel, formed a weekly bullish divergence, and has now returned back inside the channel.
As shown on the chart, the TOTAL crypto channel exhibits cleaner and more consistent reactions compared to the Bitcoin channel.
If our key level is broken, the bullish scenario becomes invalid, and price is likely to move toward the support zones. This analysis will be updated accordingly.
BINANCE:BTCUSDT
TVC:GOLD
CRYPTOCAP:TOTAL2

BTCUSDT Long: Demand Line Holds — Path Toward 96,500 Opens UpHello, traders! BTCUSDT is respecting the Triangle Demand Line after completing a full bearish cycle inside the descending channel earlier. Sellers maintained control for an extended period, pushing price steadily lower until it reached the pivot point near 88,800, where buyers finally stepped in and broke the bearish structure. This pivot zone became the foundation for a new bullish sequence, with price forming higher lows along the Triangle Demand Line. After the breakout from the descending channel, BTCUSDT entered a consolidation Range, where multiple fake breakouts occurred on both sides. This range acted as a transition phase before buyers regained momentum. Following the range, price made another bullish attempt, but faced resistance near the 96,500 Supply Zone — an area where sellers have shown strong activity in the past.
Currently, BTCUSDT is moving toward the Triangle Demand Line once again, retesting it as support. As long as buyers defend this trendline and price remains above the Demand Zone at 88,800, the bullish structure stays intact.
My scenario: if the trendline holds, BTCUSDT may bounce and continue moving toward the 96,500 resistance, which remains the main upside target for the current bullish leg. A clean breakout above 96,500 would open the path for stronger continuation. However, if price fails to hold the demand line, a corrective pullback toward the lower demand region becomes possible. For now, the market structure remains bullish while price respects the Triangle Demand Line. Manage your risk!

GOLD (XAUUSD): Support & Resistance Analysis Ahead of FOMC
Here is my latest support and resistance analysis for Gold.
As you can see, the market continues consolidating
between Support 1 and Resistance 1, forming a horizontal range.
Before the FED, expect a continuation of a sideways price action within.
After FOMC & FED Interest rate decision, consider a breakout of
one of the underlined structures as a confirmation.
❤️Please, support my work with like, thank you!❤️
I am part of Trade Nation's Influencer program and receive a monthly fee for using their TradingView charts in my analysis.

XAUUSD: Buying Pressure Aims for the $4,260 ResistanceHello everyone, here is my breakdown of the current Gold (XAUUSD) setup.
Market Analysis
Gold continues to trade within a broader bullish structure, with price action developing inside a well-defined ascending channel. After the previous impulse move higher, the market entered a consolidation phase below the $4,260 Resistance Zone, where sellers repeatedly defended the level. Earlier, XAUUSD produced a breakout from the upward channel structure and formed a temporary base above the mid-support area near $4,200, confirming that buyers still control the broader trend.
Currently, price is holding above the Triangle Support Line, showing that demand remains active on dips. The recent pullback into the $4,200–$4,190 support area looks corrective rather than impulsive, suggesting that bearish pressure remains limited for now. As long as price stays above this triangle support, the bullish market structure remains valid.
My Scenario & Strategy
My scenario is bullish while XAUUSD holds above the $4,200 Support Zone and respects the Triangle Support Line. I expect price to stabilize in this area and attempt a renewed push toward the $4,260 Resistance Zone, which is the key barrier for continuation.
Therefore, a clean breakout above $4,260 would confirm bullish continuation and open the door for further upside expansion toward higher historical levels. However, if price fails to hold the triangle support and breaks below $4,190–$4,180, this would weaken the bullish structure and could trigger a deeper corrective pullback toward the lower channel boundary. For now, the market maintains a long bias, with the main objective being a renewed test and potential breakout of the $4,260 resistance zone.
That’s the setup I’m tracking. Thank you for your attention, and always manage your risk.

BTCUSD Buyers Defend Support — Market Targets $91,5K — $93K ZoneHello traders! Here’s my technical outlook on BTC/USD based on the current market structure. After a strong bullish recovery from the lower demand area near $83,500–$85,000, the price formed a steady impulsive move upward and entered a consolidation phase inside the marked range below the key $93,000 resistance level. Multiple breakout attempts from the range were followed by corrective pullbacks, showing active participation from both buyers and sellers. Once BTC broke above the range, the price initiated another bullish leg but quickly transitioned into a symmetrical triangle structure, defined by the descending Triangle Resistance Line and the rising Triangle Support Line. Currently, BTC is compressing inside this triangle while holding above the critical $89,500 Support Level, which is acting as the main short-term demand zone. Buyers continue to defend this area, keeping the bullish bias technically valid. The price is now approaching the upper triangle resistance again, hinting at a possible volatility expansion. As long as BTC remains above $89,500, the bullish scenario stays in play. I expect a breakout from the triangle toward TP1 at $91,500, followed by a potential continuation toward TP2 at $93,000, which is the major resistance zone. However, a breakdown below the triangle support would invalidate the setup and may trigger a deeper corrective move. For now, the market remains in a compression phase, preparing for its next directional impulse. Please share this idea with your friends and click Boost 🚀

EURUSD Rising Channel Intact as Price Targets 1.16800 ResistanceHello traders! Here’s my technical outlook on EUR/USD based on the current market structure. After an earlier breakout from the lower consolidation area, the price entered a steady ascending channel, forming a sequence of higher highs and higher lows while respecting the rising Support Line. The previous bullish impulse was followed by a corrective phase, where EURUSD consolidated inside the marked range, allowing the market to release pressure before continuing higher. After the range breakout, the pair resumed its upward movement and is now trading inside a new rising price channel. At the moment, price is holding above the 1.16400 support level, which is acting as a key demand area and the lower boundary of the current ascending structure. Buyers continue to defend this zone, keeping the short-term bullish bias intact. The market is now pressing toward the major 1.16800 resistance level, which aligns with the upper channel boundary and serves as the next critical obstacle for the bulls. As long as EURUSD remains above the 1.16400 support, the bullish scenario stays valid. I expect a continuation toward the TP1 target at 1.16800, where strong seller reaction is likely. A clean breakout above this resistance could open the door for further upside continuation. However, a failure to hold the current support may lead to a deeper pullback toward the lower channel area. For now, the structure favors buyers, with resistance at 1.16800–1.17000 as the main upside objective. Please share this idea with your friends and click Boost 🚀

EURJPY: Uptrend Continues 🇪🇺🇯🇵
EURJPY finally completed a bullish accumulation
and broke a resistance of a horizontal range yesterday.
The market will most likely continue rising.
Next resistance - 183.0
❤️Please, support my work with like, thank you!❤️
I am part of Trade Nation's Influencer program and receive a monthly fee for using their TradingView charts in my analysis.

NZDCHF CHANNEL BREAKOUT|SHORT|
✅NZDCHF has broken down out of the rising channel after running buy-side liquidity at the highs, showing clear ICT displacement and a shift in order-flow toward discount levels. Price is now drawing toward the next sell-side pocket near the target zone. Time Frame 2H.
SHORT🔥
✅Like and subscribe to never miss a new idea!✅

BNBUSDT the resistance Broke wait for volume and pumpAs observed on the chart, BNBUSDT has executed a decisive breakout above its descending channel, indicating a potential trend reversal. The price is now consolidating in a range, which is typical behavior following a significant breakout as the market digests the move and builds a new support base. We anticipate the next upward impulse to begin upon an increase in trading volume, which would confirm buyer commitment and likely propel price toward higher resistance targets.
DISCLAIMER: ((trade based on your own decision))
<<press like👍 if you enjoy💚
