BTC/USDT 4H Chart Review🧭 1. Main Market Structure
The chart shows:
A broad downward channel that has been in place since the end of October.
The price bounced off the upper line of the channel, made a local upward impulse (orange trend line), and then broke it, returning back towards the lower regions of the channel.
➡️ This means that the dominant trend is still downward, and upward bounces are corrections.
🧨 2. Current Chart Situation
BTC has broken through:
the local uptrend (orange line)
fell below the 88,500–89,000 zone (green)
is heading towards further support levels
Currently, the price looks like a typical retest of the broken structure and a continuation of the decline.
🟩 3. Key Price Levels (S/R)
Resistance (upper – green):
91,600 – 92,000 – key level, a breakout would negate the local downtrend
95,000 – 97,500 – upper range of the descending channel
Support (lower – red):
85,300 – 85,800 – local support (price is currently reacting here)
83,000 – 83,100 – strong horizontal support
79,800 – strong support, historically strong in this timeframe
76,600
75,000 – lower band of a potential drop + near the lower boundary of the channel
➡️ The most logical downside targets are 83,000 and 79,800.
📉 4. Descending Channel (black) (lines)
The price has rebounded from the upper range of the channel and is heading towards the lower range.
The middle line of the channel has been broken down → a signal of trend continuation.
The lower boundary of the channel indicates a potential low around 75,000–78,000.
🔄 5. Stoch RSI
Currently oversold in the oversold zone, it is starting to curve upwards.
In a downtrend, long signals are weaker, but a short-term rebound is possible.
🧭 6. Scenarios
📉 Bearish scenario (more likely)
Technical rebound to 88,500 – 89,000
Rejection from this zone → continued decline
Targets:
83,000
79,800
Extremes: 76,000 – 75,000
➡️ This scenario is consistent with the trend and a rebound from the upper channel.
Parallel Channel

EURUSD Long: Channel Support Intact, Path Open Toward 1.1625Hello, traders! EURUSD is trading within a developing ascending channel, where price action continues to respect both the higher lows and the upper boundary of the structure. This upward movement formed after buyers defended the Demand Zone around 1.1550, which acted as a strong pivot area and triggered a bullish reversal via a clear inverse Head and Shoulders pattern. This pattern gave buyers the momentum needed to break back above the mid-range structure.
Currently, after reclaiming this level, EURUSD made a steady climb inside the ascending channel. However, price is now approaching the 1.16250 Supply Zone, which has previously acted as a strong reaction area where multiple breakouts and fake breakouts occurred. This remains the key short-term barrier that buyers need to overcome for further upward continuation.
My scenario: if buyers maintain structure above the Demand Zone at 1.15900 and hold the ascending channel’s support, EURUSD may continue pushing toward the 1.16250 level. This zone, aligned with the channel’s upper boundary, is the main target for the current bullish leg. A clean breakout above this resistance could open the door for a stronger bullish extension. However, if price reaches the Supply Zone and shows weakness or rejection, a corrective pullback toward the channel’s lower boundary is possible while still preserving the bullish structure. As long as EURUSD holds above the Demand Zone and respects the channel, the bullish scenario remains valid. Manage your risk!

BTCUSD: Channel Momentum Points Toward $93,700 TargetHello everyone, here is my breakdown of the current Bitcoin setup.
Market Analysis
BTCUSD has shifted from a prolonged bearish phase into a clear bullish recovery after breaking out of the major downward channel. The price confirmed the end of the bearish structure once it broke above the descending trendline and reclaimed the Support Zone around $89,800–$90,200, which previously acted as a strong demand area during the selloff. After the breakout, Bitcoin established a new upward channel, forming higher highs and higher lows, indicating that buyers are currently in control. The price is now moving steadily along the channel's Support Line, respecting its structure and maintaining bullish momentum. Recent price action also includes several breakout confirmations, showing that buyers successfully defended the Support Zone and turned it into a base for further growth.
Currently, BTCUSD is approaching the $93,000–$93,700 Resistance Zone, which remains the main obstacle for buyers. This level acted as strong resistance earlier and aligns with the mid-upper region of the ascending channel, making it a key reaction area where sellers may attempt to slow down the bullish trend.
My Scenario & Strategy
My scenario remains bullish as long as Bitcoin stays above the $90,200 support zone and continues to trade within the upward channel. The structure suggests that buyers may attempt another push toward the $93,700 resistance, where the next major reaction is expected.
Therefore, a clean breakout above $93,700 would confirm further bullish continuation and open the path toward higher targets, potentially extending the uptrend to the upper channel boundary. However, if BTC reaches the resistance and shows signs of rejection or weakening momentum, we may see a pullback toward the channel’s Support Line — yet the broader bullish structure will remain valid as long as the zone around $90,200 holds. For now, the market supports a long bias, with the primary objective being a retest of the $93,700 resistance zone, which stands as the key level buyers are aiming for.
That’s the setup I’m tracking. Thank you for your attention, and always manage your risk.

EURUSD: Sellers Target Move Toward 1.15200 SupportHello everyone, here is my breakdown of the current EURUSD setup.
Market Analysis
EURUSD continues to trade within a corrective market structure after a strong bullish impulse that formed an Upward Channel earlier in the month. Once price broke below that channel, the pair shifted into a broader consolidation, forming a descending Triangle pattern defined by a Triangle Resistance Line above and a Triangle Support Line below. After dropping from the 1.16000 Resistance Zone, the market produced a clear fake breakout above this level, signaling strong seller presence. This rejection aligned with the Triangle Resistance Line, confirming it as a firm boundary preventing further upside. On the downside, EURUSD also created a fake breakout at the Triangle Support Line, showing that buyers remain active around the 1.15200 Support Zone.
Currently, price is trading in the middle of this triangle structure, moving away from resistance and showing early signs of bearish momentum building toward the lower boundary. The broader picture reflects a balanced but weakening market, where sellers still hold the advantage as long as price remains under the 1.16000 Resistance.
My Scenario & Strategy
My scenario is bearish, based on the repeated rejections from the 1.16000 Resistance and the overall pressure along the Triangle Resistance Line. As long as EURUSD stays below this key zone, the probability favors further downside movement inside the triangle. My expectation is for price to make another minor pullback toward the 1.15850–1.15900 area, where short-term liquidity may form, before resuming the decline toward the 1.15200 Support Zone. This level aligns with the Triangle Support Line and represents the main downside target for the current move.
Therefore, a clean breakout below 1.15200 would signal stronger bearish continuation and open the path for deeper declines. However, if price rejects the support again and forms higher lows, we may see another corrective bounce back into the triangle — but the bearish bias holds as long as the 1.16000 Resistance remains intact. For now, the market supports a short scenario with a focus on a move toward the 1.15200 support area.
That's the setup I'm tracking. Thank you for your attention, and always manage your risk.

BTC Buyers Hold Control — Targeting $95,700 Resistance RetestHello traders! Here’s my technical outlook on BTC/USD based on the current market structure. After breaking out of the Buyer Zone near $86,400–$88,000, the price entered a sustained upward channel, forming higher highs and higher lows along the Support Line. However, BTC recently approached the Resistance Line inside the channel and showed signs of exhaustion, indicating that buyers are losing momentum as the price nears the local Seller Zone around $94,000–$95,700. The chart currently shows the market trading within a rising corrective structure, with bulls trying to hold the Support Line to maintain the short-term uptrend. As long as the price stays above the Buyer Zone and respects the channel’s Support Line, the bullish scenario remains valid. The structure suggests a potential pullback from Resistance toward the mid-channel area before buyers attempt another move upward. A continuation of this trend may push BTC/USD toward the TP1 target at $95,700, where the previous rejection occurred. A clean breakout above this level would open the door for stronger bullish expansion. However, a breakdown below the Support Line or a drop back into the Buyer Zone could weaken the trend and expose the price to deeper declines. Please share this idea with your friends and click Boost 🚀

AVGO at a Critical Breakout: AI Boom or Pullback Ahead?Bullish Scenario (Breakout Above Channel)
Entry:
• Valid breakout above $405–410
• Preferably a daily close above the channel top
Targets:
1. Target 1: $430
2. Target 2: $455–460 (main target)
Stop Loss:
• $395
(If price falls back below the broken resistance)
Bearish Scenario (Rejection From Channel Top)
Entry:
• Bearish rejection at the upper channel
• Confirmation through reversal candles
Targets:
1. Target 1: $380 (midline)
2. Target 2: $350–355 (bottom of channel)
Stop Loss:
• $408–412
(Above the channel top and wick of rejection)

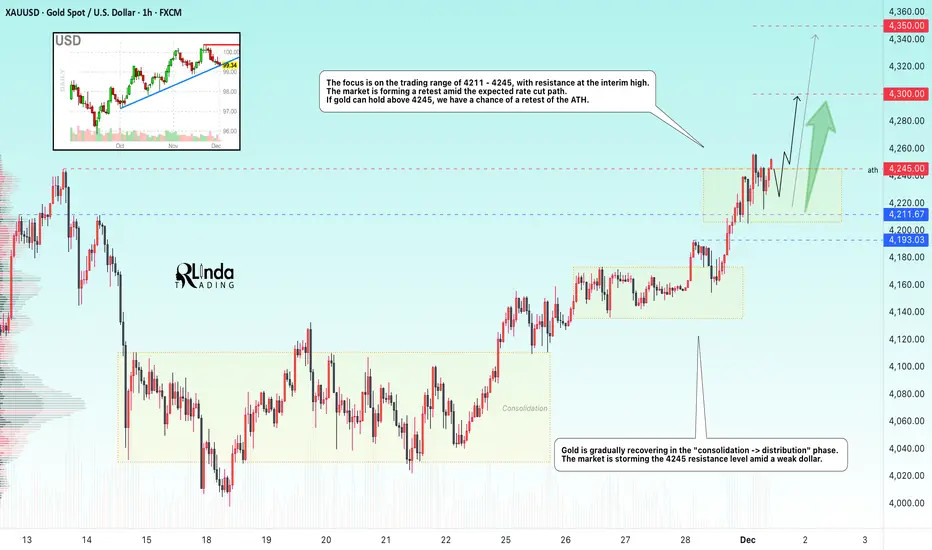
GOLD → The bullish trend continues. Retest of 4250FX:XAUUSD is trading at six-week highs near $4,250, supported by a weaker dollar and expectations of a Fed rate cut. The market is storming key resistance...
The probability of a December rate cut is 87%. The dollar is posting its worst week in four months after failing to consolidate above 100.0. A break in local trend support could trigger a decline in the index, which would support gold.
Today's focus is on the ISM Manufacturing PMI (forecast: 48.6). Weakness in the data could increase pressure on the dollar and support gold.
Gold maintains its upward trend, supported by loose monetary policy. Key data this week could boost momentum ahead of the Fed meeting.
Resistance levels: 4245, 4300
Support levels: 4211, 4193
A retest of 4245 could end with a pullback within the current consolidation at 4211 - 4245. Two scenarios: If the bulls hold the price above 4245, a rally to 4300 is expected. Otherwise, the market could retest 4215 - 4211 with the aim of a long squeeze before rallying. The trend is bullish, and the fundamental background is relatively positive.
Sincerely, R. Linda!
GBPUSD → Attempt to change the trendFX:GBPUSD is attempting a trend reversal. The likelihood of an interest rate cut is quite high, which could support the pound's rise.
The dollar is attacking the uptrend support level, failing to consolidate above 100.0. Ahead of the interest rate meeting, another rate cut could weaken the dollar, which in turn would support the pound sterling.
The currency pair is breaking downtrend resistance, and bulls are attempting to hold the price above 1.3191. A prolonged squeeze could shift the imbalance toward buyers, which in turn could trigger a rally.
Support levels: 1.3191, 1.3124
Resistance levels: 1.337, 1.353
The price has entered the trading range of 1.3191 - 1.3370. Consolidation is forming above key support, but the market may test this area of interest before continuing its rise at the European session's opening. A false breakdown and price holding above 1.3191 could support further growth.
Best regards, R. Linda!

SOLANA → Countertrend correction. Bear market BINANCE:SOLUSDT.P is forming a correction after retesting the intermediate bottom of 120.0. Ahead lies a fairly strong and important zone of interest, to which the market may react...
The market structure is bearish. After updating the low within the bearish trend, a countertrend correction to the liquidity zone is forming. A retest of resistance at 143-145 may end in a false breakout and a fall.
Bitcoin is also stagnating. There is no strong support from the fundamental side, and the market is also far from technical support. There is still potential for a fall...
Resistance levels: 143.35, 145.67, 150.8
Support levels: 133.12, 128.3
The coin is within the trading range of 120.0 - 144.0. Accordingly, after a retest of support, a retest of resistance is forming, but pressure on the market is being exerted by a weak fundamental background and a downward trend. A false breakout of this zone of interest could trigger a sell-off...
Best regards, R. Linda!

BITCOIN → Retest of the 94,000 zone of interest...BINANCE:BTCUSDT.P is rebounding from its interim low of 80,000. However, it is still too early to talk about a bull market, as a countertrend correction is forming under the current circumstances.
Globally, Bitcoin is in a downtrend, with the zone of interest for a countertrend correction being 94,000-95,000. The market structure is bearish, and a retest of the break-even zone could trigger a downward movement within the trend.
After a strong liquidation to 80K, the market is forming a pullback, which is a basic phenomenon. There is no confirmation of a trend reversal yet, and the fundamental background is neutral, without clear support. Various analytical services suggest that the market is in a cleansing phase and has so far only liquidated short-term traders, reaching a cumulative average break-even price. A classic pullback. Technically, the zone of interest or magnet for the medium-term market is 75K (on the daily timeframe).
Resistance levels: 93,000, 94,000, 97,300
Support levels: 89,000, 86,000
In the current situation: a bearish trend, weak purchasing power, and a weak fundamental background, I consider a pullback to be the primary reaction to the 93-94K zone. However, the market is not constant, and if support appears (news or other drivers) and Bitcoin manages to stay above 95K, then growth can be expected.
Sincerely, R. Linda!

BTCUSD (2H) – Elliott Wave Completion + Breakout SetupBITSTAMP:BTCUSD
Bitcoin has completed a clear 5-wave corrective structure, currently consolidating near a demand zone after sweeping liquidity around $87,300.
Price is now attempting to break short-term structure, forming a potential reversal setup. A confirmed breakout above the $89,800–$90,300 resistance zone may trigger a bullish continuation toward the descending trendline and mid-range level.
Key Scenarios
✅ Bullish Case 🚀
Break & hold above $90,300
→ 🎯 Target 1: $95,800
→ 🎯 Target 2: $105,100 (Extended target if trendline breaks)
📌 Entry Zone: $88,500–$90,300
📌 Stop Loss: $83,900
❌ Invalidation:
A strong break below $83,900 confirms bearish continuation toward the lower demand at $80,500.
Levels to Watch
Support: $87,300 / $83,900
Resistance: $90,300 / $95,800 / $105,100
⚠️ This chart is for educational purposes only. Not financial advice.

HUBC – Short-Term Bullish SetupThe price is consolidating in the 217–221 zone and attempting a breakout.
RSI remains above 60 and the price is trading above the 50-day MA, indicating
bullish momentum.
Buying Zones: 217–221 (CMP), and around 210 on dips.
Stop-Loss: 205 (Closing Basis)
Targets: 239 / 250
Long-term structure also remains positive; dips can be considered for accumulation.

Selena | ETHUSD 1H – Bullish Continuation SetupCOINBASE:ETHUSD
The recent rejection from the upper trendline created short-term corrective movement. Liquidity sweeps below minor support hint at accumulation, and as long as price remains above the invalid zone at 2899, bullish momentum is favored. Holding demand could fuel another expansion toward the next resistance block.
Key Scenarios
✅ Bullish Case 🚀
Hold above Demand Zone (≈ 2990–3020) →
→ 🎯 Target 1: 3110
→ 🎯 Target 2: 3180
→ 🎯 Target 3: 3220 (Top Resistance)
❌ Bearish Breakdown 📉
Break below 2899 invalidation zone
→ Potential retracement toward 2755 – strong support zone
→ Deeper demand sits near 2621 if structure fully collapses.
Current Levels to Watch
Resistance 🔴: 3110 | 3180 | 3220
Support 🟢: 3020 | 2899 | 2755
⚠️ Disclaimer: Educational analysis only. Not financial advice.

AUDUSD Sell Setup 4H Chart
AUD/USD on the H4 timeframe is offering a potential short opportunity, but only with confirmation. The RSI being overbought aligns with the expectation of a near-term pullback, yet the decisive element will be a bearish engulfing candle at the channel resistance.
Until that appears, this remains a watch-and-wait environment, not an early entry zone. Market Structure:
Channel-Bound Price Action
On the 4-hour timeframe, AUD/USD has been respecting a clearly defined descending channel. Price is currently trading near the upper boundary, which typically acts as dynamic resistance.
Key implications:
The closer the price is to the top of the channel, the higher the probability of a corrective pullback. However, channels often break when momentum and fundamentals align, so resistance must be confirmed by price rejection — not assumed.
Momentum Conditions: RSI Overbought
RSI on the H4 chart has moved into overbought territory.
This signals short-term exhaustion in bullish momentum. Increased likelihood of a corrective move lower. However, RSI becoming overbought in an uptrend can indicate strength, not necessarily a reversal.
3. Candlestick Confirmation: Bearish Engulfing as Key Trigger
Given the context, a bearish engulfing candle at channel resistance offers exactly the kind of confirmation needed before entering a short position. So we'll wait for that trigger.
Targets
First target (T1): Middle Channel midline.
Second target (T2): Opposite boundary of the channel.

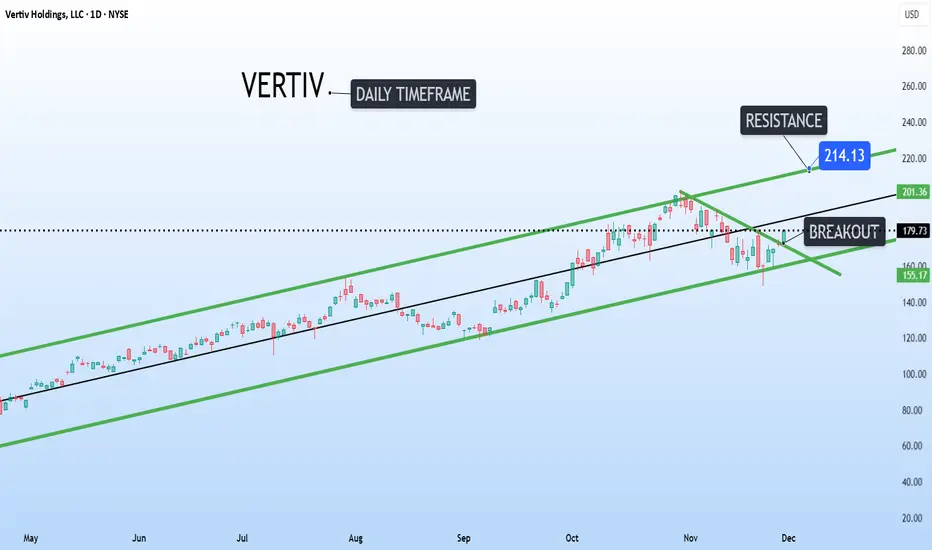
Vertiv Holdings Breakout with target around 214Vertiv Holdings NYSE:VRT is printing a textbook breakout setup on the daily timeframe.
Price has reclaimed the diagonal trendline at $170 and looks ready to push higher within this massive ascending channel.
The next major resistance target aligns with the channel top around $214.
Unlocking Potential: Power Finance Corporation Analysis! 💼📈Traders, let's delve into Power Finance Corporation today ! 🌟 In the daily timeframe, we're witnessing a range-bound movement, with the price testing previous swing highs. 🔄 Anticipate a breakout above this level(red box), potentially targeting Rs. 450 and beyond. But before that it may come around at Rs.400 to go up further. PFC appears poised for bullish action! 🚀 Options traders, explore 400 CE or below 400 CE options with ample liquidity. Let's capitalize on this opportunity! 💼📊
Thank you. See you again in the next post!
Best regards,
Alpha Trading Station

Long 4H support Retracement substructure 3 drive systemwe see two pushes down and a fair value gap below we shall enter here and target last swing high we may break it as the weekly has a very strong upward momentum.

VRT – Mini Downtrend Break & Momentum Turning UpVRT - CURRENT PRICE : 179.73
VRT breaks out from a minor down channel while holding strongly within the long-term ascending trend channel. 📊 The breakout candle shows renewed buying interest, supported by RSI turning higher from the mid-zone and MACD showing early bullish improvement. 💪 With momentum improving and the long-term trend intact, the setup supports a buy-on-breakout strategy toward the upper channel.
ENTRY PRICE : 176.00 - 179.73
FIRST TARGET : 195.00
SECOND TARGET : 215.00
SUPPORT : 160.00

BTC. End of correction long.Only if we can take the 94.6 level the true long confirmed. Otherway it flat between 85 -95 +/-

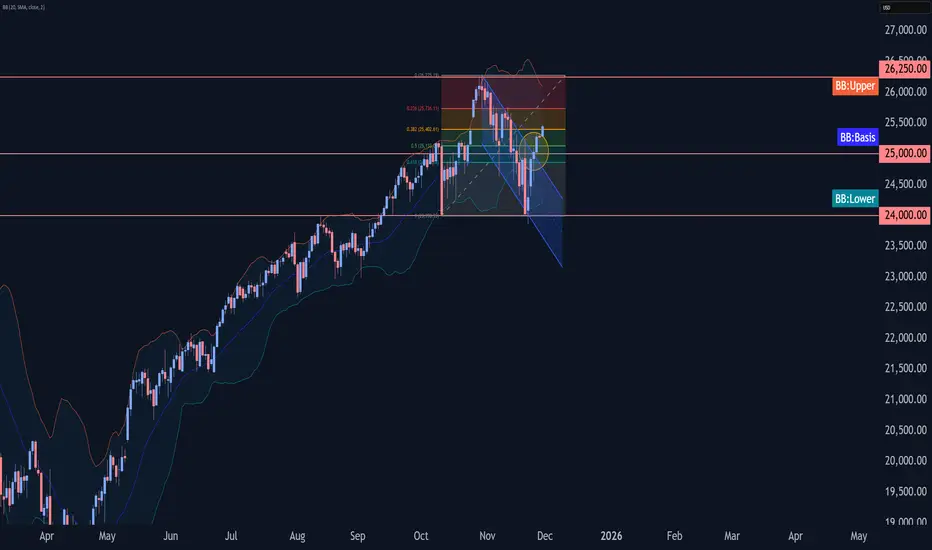
Nasdaq-100 Wave Analysis – 28 November 2025
- Nasdaq-100 broke resistance zone
- Likely to rise to resistance level 0.3000
Nasdaq-100 index recently broke the resistance zone between the round resistance level 25000.00 and the resistance trendline of the daily down channel from October (which encloses the previous primary ABC correction 2).
The breakout of this resistance zone accelerated the active short-term impulse wave 1 of the intermediate impulse wave (1) from November.
Given strong daily uptrend, Nasdaq-100 index can be expected to rise to the next resistance level 26250.00 (former top of wave (5) from October).
BTC : Short Trade setup from Ascending ChannelBitcoin is trading inside an ascending channel and has just tapped into a supply zone, making this a clean scenario for a short‑term counter‑trend short back toward prior support. The idea is to fade the move inside the supply, then ride price down to the support level where buyers previously stepped in.
Price has been respecting an ascending channel. Current location is at the upper band plus an overlapping supply zone, which often acts as a magnet for profit‑taking and short entries.
After a strong impulsive leg up, price is overextended into supply on the 15m chart, with RSI elevated and showing potential for momentum fade rather than fresh trend acceleration.
Take Profit:
TP1: Mid‑channel near 90,000–90,200 to secure partial profits.
TP2: Support zone around 89,200–89,300, where the last strong breakout originated.
Stop Loss: Conservative: Just above the supply zone and recent high, around 92,300–92,500.

#ERAUSDT #1D (Bitget Futures) Descending channel on support LONGCaldera just printed a morning star on daily with good bounce back volume, bottom seems likely.
⚡️⚡️ #ERA/USDT ⚡️⚡️
Exchanges: Bitget Futures
Signal Type: Regular (Long)
Leverage: Isolated (1.3X)
Amount: 4.8%
Current Price:
0.2508
Entry Zone:
0.2503 - 0.2187
Take-Profit Targets:
1) 0.3245
2) 0.3921
3) 0.4598
Stop Targets:
1) 0.1593
Published By: @Zblaba
EURONEXT:ERA BITGET:ERAUSDT.P #1D #Caldera #RaaS #Rollups #DeFi caldera.xyz
Risk/Reward= 1:1.2 | 1:2.1 | 1:3.0
Expected Profit= +49.9% | +87.4% | +124.9%
Possible Loss= -41.7%
Estimated Gaintime= 1-2 months

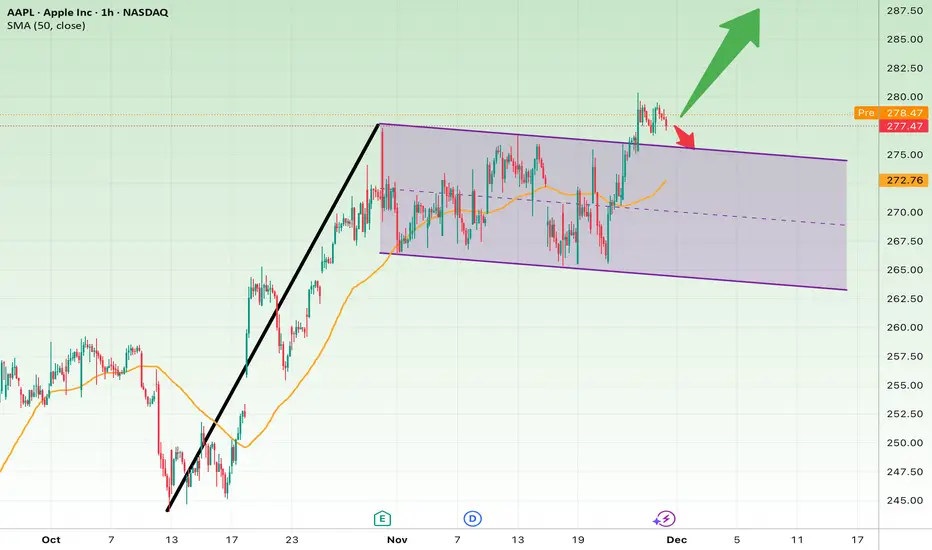
AAPL Breaks Out: Bull Flag Targets Point to $287–$295!After a strong rally (black trendline), AAPL entered a descending corrective channel, which looks like a classic bull flag pattern.
Now the price is breaking above the upper boundary of the channel, suggesting that the correction may be over.
Bullish Scenario (More likely now)
If the price holds above the channel, continuation upward is expected.
Bullish Targets:
• $282
• $287
• $295 (extended target)
Bearish Scenario (Failed breakout)
If price falls back inside the channel, the correction resumes.
Bearish Targets:
• $273
• $268
• $262 (major support)
Stop Loss
• Long: Below $274
• Short: Above $280.50