AVAX / USD [AVALANCHE] EWP TC FIB ANALYSIS WEEKLY TFAVAX remains inside a long-term descending channel, keeping the macro bias bearish. The 2024 rally topped near the 0.618 Fib + channel resistance, consistent with a Wave B in an ABC correction. Price has since broken support and appears to be unfolding Wave C, likely as a 5-wave impulse. Current structure suggests further downside toward the $6 region (possibly lower) before any meaningful macro bottom can form. Only a reclaim of $20 and a channel breakout would invalidate this bearish count. Until then, rallies remain corrective.
Like and follow for more charts like this.
Parallel Channel

MSTR at Key Support: Bounce Opportunity or Breakdown Risk?Market Structure
MSTR is trading inside a long-term descending channel, indicating that the broader trend remains bearish / corrective.
Price has recently reacted right at the lower boundary of the channel, which is a critical support zone.
The moving average is still above price, suggesting that bullish momentum has not yet been confirmed.
Bullish Scenario (Support Bounce)
• Current zone: Major support at the channel low
• If this level holds:
• Target 1: 160 – 165
• Target 2: 190 – 200 (midline of the channel)
• This move would be considered a technical bounce or corrective rally, not a full trend reversal.
Bullish Stop Loss:
❌ Daily close below 130 – 125
Bearish Scenario (Channel Breakdown)
• If price breaks and closes below the channel support:
• Target 1: 110
• Target 2: 90 – 80
• A breakdown would likely accelerate downside momentum.
Bearish Stop Loss (for shorts):
❌ Daily close back above 145 – 150
Final Thoughts
• Risk-to-reward favors a cautious long at support, but confirmation is still needed.
• MSTR remains highly correlated with Bitcoin, so BTC volatility can quickly trigger either scenario.
• Best approach:
• Wait for clear bullish confirmation, or
• Trade short-term with strict risk management.

USDCAD: Bullish Outlook Explained 🇺🇸🇨🇦
USDCAD will likely continue rising on Monday, following
a confirmed breakout of a resistance line of a falling channel.
The violation occurred after a test of a strong intraday support.
Expect a rise at least to 1.704 level.
❤️Please, support my work with like, thank you!❤️
I am part of Trade Nation's Influencer program and receive a monthly fee for using their TradingView charts in my analysis.

Weekly Down-Channel: Support Rebound Play ?ENA/USDT is trading at the lower boundary of a well-respected weekly descending channel. This area acts as dynamic support, so the primary idea is a controlled rebound toward the channel midline first, and potentially the upper boundary if momentum follows. Confirmation comes from strong rejection wicks and a weekly close holding the channel support (plus a break of minor bearish structure on lower TFs). A clean weekly close below the lower band invalidates the bounce and favors bearish continuation.

UJ. Bulls Building Momentum, Weekly Analysis and PlanThe Week:
In the past couple of week the bulls manage to stop what was looking like a bearish momentum and make it their momentum. Two weeks ago we get a very sharp Hammer on solid volume confirming strong bullish presence, this week this was further confirmed by pushing the price back to 157 again on supporting volume, and this level was mentioned to be re-tested in our previous Idea on UJ. On Sunday Japan is having a General Election which will have a significant impact on the pair, so be ready for the gaps on Monday.
Daily Chart:
What is most interesting at this TF is volume, which has been overall falling in the past 4 days, but another interesting fact is the ultra high volume on some very narrow candles , which is a sign of warning and being very careful as the MM's are moving lots of money either one direction or the other. The current trading range is L152 H159.454, and if the bulls are to continue what they have started we will see a re-test of the high and possibly a breakout, other wise we are going back to 152.
4h Chart:
For about a week the price was moving smoothly up in a fairly tight channel, only at the end of this week the PA breakout of it to enter in a even smaller side channel, which we have to be very thankful to see, because offers us an absolutely amazing trading entries at breakout.
The current 4h range is quite wide L152.707 H157.331, there is also a strong mid level to be careful, where the 4h,Daily and Weekly mid-ranges are meeting forming a possible support.
1h Chart:
When we zooming further in, the side channel that the PA entered on Friday, becomes clearer at what it has to offer. The plan will be to trade the breakouts of the channel.
Now, on the upside the path is much clearer with a possible stop at 158.349, whether on the down side there might be some challenges like the Fangorn Forest, but that shouldn't scary us as we have the possibility to trade on rallies or up-scaling.
One Trade to rule them all, One Trade to find them, One Trade the win them all and then re-invest them.
"sorry I shouldn't watch LOtR before I write the ideas"
The Plan
Side Channel Breakout either upper or lower band: Targets
Up 158.349 and 159.218
Down 155.500, 155.000 and 152.700
Thank you for dedicating some of your precious time reading this idea.
I hope you have a profitable week

GU, Trading Heaven, Weekly Analysis and PlanThe Week:
Last week shooting star didn't fail to deliver as mentioned in last week report, but it fail to form the evening star, which is a bit disappointing. On Friday the bulls took the matter in their hands and managed to absorb some of the losses incurred during the week. Volume stays high above average, and with the narrow candle, it seems to me we that we are getting early signs of accumulation phase.
Daily Chart:
Here the trend is mostly bullish the high low hasn't been approached yet. Next possible targets for the bears is the demand zone around 1.34, at this level we also have the Daily low band and Weekly mid range. Volume wise, we have the first three candles of the week, very narrow, but on very high volume, positions are being marked there, probably accumulating for the next move.
4h Chart:
New range formed L1.35074 H1.37334. This is where the pair currently trades we are right in the middle of Daily range, pretty uncomfortable place to trade, being patient and waiting for the PA to reach a more solid level could be a good choice. The bullish pullback on Friday has reached the 4h and Daily mid-range levels, and a rejection from here is highly probable. Ideally we want to see the price entering the demand zone before engaging in trades(lower risk). But there is also a good trading opportunities on the breakout of the channel or within the channel. We will get a closer look at the entries at the 1h TF.
1h Chart:
As you can see on the chart the current 4h range is about 220 pips wide and has about 150 pips from each side to support or resistance, looks like a trading heaven. There are so many trading possibilities for both rejections or breakouts. I will try to summarise them as best as I can in the "Plan" section.
The Plan
Resistance Rejections
current 1.36215
4h upper band 1.37334
D upper band 1.38738
Support Rejections
4h lower band 1.35087
D lower band 1.33436
Breakouts
Short 1.35087
Long 1.37334
This are just a few possibilities, but honestly the current set up offers so much.
Targets I leave to you to decide which level you want to attack.
Thank you for dedicating some of your precious time reading this idea.
I hope you have a profitable week

Gold, Holding Ground. Weekly Analysis The Week:
The bulls managed to sustain most of the bearish pressure and actually closed the week in green. The last two weekly candles (shooting star and hanging man) suggest some kind of consolidation or pausing point, Bulls and Bears in full war mode. In the incoming week I don't expect the PA to exit the current range L4274.25 H5592.65, which is great for rejection strategies within the range.
Daily Chart:
On daily chart, things are slightly different. First comes the hammer on Monday which stopped the price from falling and pushing it all the way up to 5091.95 which is just above the Daily and Weekly Mid-Range. Another interesting observation is the volume on Thursday and Friday, the candles are just marginally different but the volume on the down candle on Friday much healthier (although still below average). This information give us a warning about the current level which might be hard to break and open the possibility to short from here.
4h Chart:
This TF has created a new trading range L4402.39 H5091.95 and also currently we have two mini-trends, which might be an early sign of pause and consolidation which was already noted on the weekly chart.
Downtrend High 5597.72 Low 4402.39 LH 5091.95
Uptrend Low 4402.39 High 5091.95 HL 4659.10
Of course we don't mind at all if it's trading up, down or sideways (especially in a large range like this one) because there trading possibilities regardless of the trend.
1h Chart:
At this timeframe first thing we note is the breakout of the down channel which started on Wednesday and ended on Friday.
The price then entered into a supply zone, which will give us the chance to early trades on Monday.
The Plan:
The metal remains highly volatile, so there is more risk involved but also greater profits.
Short Rejection current level 4950 or 5091.95 Target 4h mid-range 4750 or lower.
Long Breakout 5091.95 Target 5445
Thank you for dedicating some of your precious time reading this idea.
I hope you have a profitable week

GOLD - Consolidation in a symmetrical triangle. Up or down? FX:XAUUSD showed signs of recovery on Friday, but the price is stuck within the boundaries of a symmetrical triangle, which generally indicates market uncertainty.
Key fundamental factors
The ADP, JOLTS, and unemployment claims reports pointed to weakness in the labor market, supporting expectations of two Fed rate cuts this year, which is positive for gold. Upcoming US-Iran talks are supporting demand for safe-haven assets, despite the conclusion of the Ukraine talks. Other central banks (the ECB and the Bank of England) easing policy has strengthened the dollar, putting pressure on gold.
Gold's attempt at recovery looks vulnerable. Although weak employment data and geopolitical risks provide support, the main counterforce remains the global rotation of capital in favor of the US dollar.
Technically, the market may have a chance to break through the correction resistance, but will there be support from traders?
Resistance levels: 4901, 5021, 5100
Support levels: 4811, 4751, 4670
I expect that before attempting a breakout, the market may try to test liquidity in the 4812 zone. However, if the market breaks through the resistance conglomerate and manages to close above 4901, then the market will be able to continue its growth towards 5000.
Otherwise, if 4812 does not hold the price, the market will close within the boundaries of a symmetrical triangle (flat).
Best regards, R. Linda!

EURJPY - Breaking through resistance. Ready for growth FX:EURJPY is consolidating above the previously broken resistance level of 184.75 as part of a bullish trend. If the bulls maintain support, the price will be able to continue growing.
The euro continues to strengthen against the weak Japanese yen. The market is consolidating above the interim high of 184.75. Support plays an important role before the continuation of growth
The trend is bullish, with the 182.7 long squeeze triggering a recovery phase in which the currency pair calmly overcame key resistance at 184.39-184.75 and formed consolidation above the level, confirming bullish intentions
Resistance levels: 185.53, 186.42
Support levels: 184.75, 184.39
Consolidation above 184.75 - 185.0 followed by a breakout of local resistance could trigger another rally within the bullish trend.
Best regards, R. Linda!

GOLD - Correction (local downtrend). Range?FX:XAUUSD is showing increased volatility on Thursday, fluctuating within a wide range of 4800-5100. The market may move into consolidation...
Key fundamental factors
The USD's rise to two-week highs is putting pressure on gold. A weak ADP private sector employment report (22K vs. 48K forecast) supports expectations of two Fed rate cuts this year (limiting gold's decline). The agreement on negotiations between the US and Iran in Oman on Friday temporarily reduces demand for safe-haven assets.
Today's JOLTS (job openings) data and weekly jobless claims may strengthen or weaken expectations for Fed rates.
Gold is balancing between conflicting factors: a strong dollar and reduced geopolitical risks are weighing on prices, while weak employment data and general uncertainty about Fed policy are providing support.
Resistance levels: 4941, 5021, 5100
Support levels: 4856, 4751, 4670
The market is in a correction phase, with pressure in the 4950-5000 zones intensifying local sell-offs ahead of the news. The structure will be broken if gold breaks through the 4950 conglomerate and downward resistance and consolidates above this zone. But at the moment, I am considering a decline to 4751-4670 and a possible rebound with the aim of forming a sideways range.
Best regards, R. Linda!

COIN [Coinbase] EWP TC FIB ANALYSIS DAILY TFCOIN – Daily Structure Overview
After five swings up, completing a motive wave, price formed a double top near 430 and has since entered a corrective phase. The market is now retracing the entire bullish leg from the 2022 low, with downside targeting the golden zone around the 85 area. This region represents a major confluence support and potential termination zone for the correction. As long as price holds above the golden zone, the higher-timeframe bullish structure remains intact. Upon completion of the correction, the next impulsive advance may resume, with the primary bullish target remaining at 795. A sustained break below the 85 zone would invalidate this scenario and suggest a deeper corrective structure.
Like and follow for more charts like this.

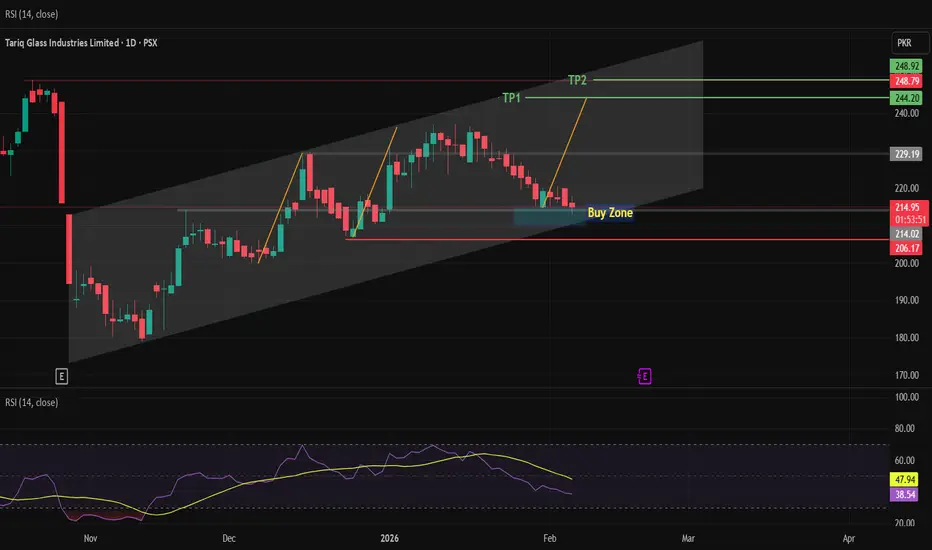
TGLTGL PSX
📉 Current Price: 213 PKR
📊 Buy Zone: 213–214 PKR (channel support + prior lows)
⚡ Momentum: RSI ~36 → mildly oversold, possible bounce
🎯 Targets:
TP1: 244 PKR ✅
TP2: 248 PKR 🚀
💡 Fundamentals:
🏗️ Construction & industrial demand → steady revenue
💰 P/E reasonable + dividends → total return buffer
🛡️ Risk Management:
Stop-loss: 206 PKR ❌
💬 Takeaway:
“Dip = ✅ Buy opportunity. Fundamentals support it. Enter smart, ride the bounce, target highs 244–248 PKR!” 🚀📈
BTCUSDT Short: Sellers in Control - Next Stop $69,000 SupportHello traders! Here’s a clear technical breakdown of BTCUSDT (3H) based on the current chart structure. BTC previously traded within a well-defined consolidation range, where price moved sideways for an extended period, indicating market balance and accumulation. This ranging phase eventually resolved to the upside, leading to a strong impulsive rally. The bullish expansion culminated at a clear pivot high, where buying momentum began to fade and profit-taking emerged. From this pivot point, market structure shifted, and BTC transitioned into a descending channel, characterized by consistent lower highs and lower lows. Price respected the channel boundaries well, confirming controlled bearish pressure rather than a disorderly sell-off.
Currently, BTC has broken below a key Supply Zone around 73,500–74,000, which previously acted as strong resistance. This breakdown confirms a bearish continuation scenario rather than a temporary pullback. Price briefly attempted to reclaim this zone but failed, suggesting acceptance below former resistance. Below current price, the Demand Zone around 69,000 stands out as the next major area of interest. This level represents a strong historical demand area and a potential zone for buyers to step in.
My primary scenario favors further downside continuation as long as BTC remains below the descending supply line and the broken supply zone. Any pullback toward the supply line or the 73,500 area is viewed as a corrective retest and a potential short opportunity rather than a bullish reversal. The main downside objective remains the 69,000 Demand Zone (TP1), where partial profits can be considered and where a stronger reaction is likely. If price reaches this demand area, market reaction will be critical in determining whether BTC forms a base for a bounce or continues lower. However, a strong reclaim and acceptance back above the supply zone and the descending supply line would invalidate the bearish scenario and signal a potential trend shift. Until that happens, structure, trend, and price behavior continue to favor sellers, with downside pressure dominating the current market phase. Manage your risk!

EURUSD: Buyers Defend 1.1780 - Upside in Focus 1.1870Hello everyone, here is my breakdown of the current EURUSD setup.
Market Analysis
EURUSD was previously trading within a well-defined downward channel, where price consistently respected the descending resistance and support boundaries, forming a series of lower highs and lower lows. This structure confirmed sustained bearish control and orderly downside continuation. During this phase, several bearish pushes developed smoothly within the channel, highlighting strong seller dominance. After breaking the channel, EURUSD continued higher and successfully reclaimed the Support Zone around 1.1780, which acted as a key decision level. The breakout and subsequent hold above this zone confirmed a change from bearish structure into a bullish recovery phase. Price then accelerated toward the 1.1870 Resistance Zone, where supply became active again, resulting in consolidation and multiple breakout attempts.
Currently, price is trading above the rising trend line, while also forming a descending corrective structure beneath the triangle resistance line. Despite the pullback, the market continues to respect higher lows, suggesting that the recent decline is corrective rather than impulsively bearish. The ability of EURUSD to hold above the support zone keeps the bullish structure intact.
My Scenario & Strategy
My primary scenario favors a long continuation as long as EURUSD holds above the 1.1780 Support Zone and respects the rising trend line. The current consolidation appears to be a corrective pause within a broader bullish structure. A successful break and acceptance above the triangle resistance and the 1.1870 Resistance Zone would likely trigger renewed upside momentum. If buyers manage to reclaim and hold above resistance, the next bullish leg could extend higher, following the direction of the dominant trend.
However, a decisive breakdown below the support zone and trend line would weaken the bullish scenario and signal a potential deeper correction or range formation. For now, structure favors buyers, with pullbacks viewed as opportunities for continuation rather than trend reversal. EURUSD remains at a key technical decision area, and price reaction around support will be critical for the next move.
That’s the setup I’m tracking. Thank you for your attention, and always manage your risk.

Gold Holds Demand - Long Scenario After Correction Toward $5,180Hello traders! Here’s my technical outlook on XAUUSD (1H) based on the current chart structure. Gold initially traded within a well-defined range, indicating a period of accumulation and market balance. This consolidation eventually resolved to the upside, leading to a strong impulsive move and confirming bullish intent. Following the breakout, price respected a clean ascending channel, forming higher highs and higher lows. Multiple bullish breakouts along the structure confirmed sustained buyer control. However, after reaching the Resistance / Seller Zone around 5,180–5,200, bullish momentum weakened, and price faced strong rejection, resulting in a sharp corrective drop. This pullback drove price into a major Buyer Zone around 4,880–4,925, which aligns with a key horizontal support level and a previous breakout area. Price briefly dipped below this zone but quickly reclaimed it, forming a fake breakdown — a strong sign of seller exhaustion and buyer defense at demand. Currently, XAUUSD is stabilizing above the Buyer Zone, suggesting the correction may be complete. As long as price holds above this demand area, the structure favors a long scenario on pullbacks rather than continuation to the downside. A healthy retracement and consolidation within or just above the Buyer Zone could provide a favorable long opportunity. Bullish confirmation from this area increases the probability of a continuation move toward the 5,180 Resistance / Seller Zone (TP1). This level represents the first major upside target and an area where partial profits can be considered. If bullish momentum strengthens and price breaks above the Seller Zone with acceptance, the move could extend further toward higher resistance levels, confirming trend continuation. The long scenario remains valid as long as price holds above the Buyer Zone and avoids acceptance below support. A decisive breakdown and acceptance below the Buyer Zone would invalidate the long bias and shift focus back toward bearish continuation. Until that happens, Gold remains positioned for a bullish recovery from demand within the broader market structure. Please share this idea with your friends and click Boost 🚀

QQQ - Ready For A BreatherI believe I have identified another Wyckoff distribution pattern on QQQ. In early October, we saw the first signs of selling. We got a selling climax at the start of November. We have consolidated within this range over the past 3 months, testing the channel's highs and lows. It is not a perfect Wyckoff schematic, but the volume has certainly supported a move lower especially as of late.
For confirmation, I would like to see this current support level hold one more time. If it does, it would be the buyer's last gasp before taking out the low like a crashing elevator. I am effectively looking for some form of bear flag, descending triangle, or rising wedge pattern.
I will consider this trade invalidated if we begin to see strong closings above the midline of the channel. At that point, I may need to reassess the quality of the pattern or confirm that the pattern has failed.
The target to the downside would first be the 200 MA, which currently rests at 577. Below there is 560. I am still a bit fuzzy on the calculations of Wyckoff, but the point-and-figure chart suggests the final target should be about 520. I feel we would need a strong catalyst to reach those levels, but anything is possible these days.

WIF/USD * Daily TF EWP TC FIB AnalysisAnalysis of WIF/USD Chart Using Elliott Wave Theory
1. Elliott Wave Count & Structure:
The chart follows a clear Elliott Wave multi zigzag structure.
The impulse wave peaked at around $4.86, marking a significant high.
The correction followed in a three-wave ABC structure, which seems to have found support at a key Fibonacci level (0.618 - 0.65 retracement).
2. Trend Channel & Key Support Levels:
A parallel trend channel is visible, where price has bounced off the lower boundary, indicating strong support. Key support zone around 55¢, which aligns with the lower boundary of the trend channel.
3. Potential Price Targets & Future Projections:
The bullish scenario suggests a Wave Y target above $30 (potentially $36).
The large green box in the upper right suggests a potential high-reward zone, likely driven by a new impulse wave (Wave Y).
4. RSI Indicator & Momentum Shift:
RSI was previously oversold but is now turning upwards, indicating potential momentum recovery. A break above the 50 RSI level would confirm bullish continuation.
According to cryptonews.com : The biggest meme coin sensation in 2024!
Be careful with meme coins
So let you guide by BTC and VIX if you want to invest in this coin.

TOTAL [Crypto Total Market Cap] EWP FIB TC ANALYSIS WEEKLY TFCrypto Total Market Cap (Weekly) – Structural Pullback Within a Primary Uptrend
The weekly structure of the total crypto market cap continues to support a larger bullish framework, even though price is currently undergoing a corrective phase.
After completing a strong impulsive advance that pushed price into the upper region of the long-term rising channel, the market printed what appears to be a wave (5) / terminal structure, followed by rejection near the upper channel boundary. Since then, price action has shifted into a corrective retracement, characterised by overlapping candles and declining momentum — typical behaviour after an extended impulse.
Importantly, this pullback remains technically constructive:
• Price is holding above the former breakout zone and the median of the rising channel
• The current decline aligns with Fibonacci retracement support (0.382–0.5 zone) of the prior advance
• No decisive weekly close below structural support has occurred
• Momentum (RSI) is cooling off from overbought conditions rather than breaking down aggressively
From an Elliott Wave perspective, this correction can be interpreted as a wave (4) / higher-degree consolidation, allowing the market to reset before attempting continuation. As long as price remains within the channel and above key fib supports, the broader bullish bias remains intact.
If this support region holds, the market could resume its primary trend and eventually challenge the upper channel again, with expansion targets projected higher over the coming quarters. A loss of the highlighted support zone, however, would suggest a deeper corrective phase and require reassessment of the larger structure.
Bottom line:
This looks less like distribution and more like a necessary structural pause within a long-term uptrend. Patience and confirmation are key — continuation is favoured while support holds.
Like and follow for more charts like this.

EJ, Weekly Overview and Upcoming Week PlanThe Week:
Last week the pair didn't move much, the bulls handled well the bearish pressure and held the price from closing below 183.000. Looking at the volume (high) there was a lot of liquidity going into the pair, but with a just a marginal change, that tell us there is some indecision here, and we have to be more patient until we get a better signal.
Daily Chart:
Very Doji week, every day the bears tried to push lower but all they found each time was plenty of bulls protecting the lower levels. As confirmed on the weekly chart there is currently a lot of indecision. Next week we should have some better confirmation of where we are going next, breakout strategies on the ready and lets dive deeper into the 4h and 1h to get a closer look at the entry levels.
4h Chart:
The current trading range is L181.801 and H183.751, on Friday we saw a small break into the resistance of this range but it fail to keep the price above it. In the incoming week we are looking for further breakout test either support or resistance.
1h Chart:
The 1h chart confirm the overall view and the bouncing between support and resistance (doji on the daily chart). The trading plan seems very straightforward, especially for breakout traders.
The Plan:
Resistance Breakout 183.751 Target as high as 186.0
Support Breakout 181.801 Target 180.500
Thank you for dedicating some of your precious time to reading this idea.
I hope you have a profitable trading week.
Every week I publish ideas, thoughts, chart readings, and plans about Gold, EU, GU, EJ and UJ, follow so you don't miss them.
Next week, I will be publishing a very interesting report/study about target optimisation and profit maximisation. If it's something you might be interested in, please follow to not miss it

Target (TGT) Could be attempting to Reverse Bear TrendThis is an analysis of the 1 Week or Macro timeframe. We zoom out to get a feel for the big picture moves.
Where Target's current price action has reached, it warrants attention and to me is a critical area to watch.
Why critical? Well, we have reached the Upper bounds of Targets Bearish Channel so we either attempt for a break of the resistance holding us down or we continue the Bearish trend downwards.
Why Bearish channel or trend? Because technical analysis 101 says that the observation of Lower Highs and Lower Lows are indicative of a bearish trend.
It can't be any clearer. With this established, its always important to remember:
The Trend Is Your Friend. Probabilities dictate that price action will continue to move in the direction of the established trend. Until ofcourse it doesn't by printing reversal signs/ signals, etc.
Notice the Green rectangle highlighting the Price action of the last 10 months-ish.
In April 2025, we reached a price of around $86.00, bounced from here to around $105.00 and again fell back down to around $86.00 in the Fall of 2025.
Reaching $86.00 twice, is a Double bottom formation. A potential sign of an attempt to reverse trend.
Now in recent Price Action we are currently around $112.00. This is our first Higher high since we began our Bearish trend in October 2021.
The Green Zone can also potentially becoming a multi year consolidation range.
Which is why again i would say is a critical area and warrants attention.
What i'm looking to see is how price action interacts with this current price zone highlighted in Orange, titled "Confluence of Resistance". Its not going to be easy as people will look to unload stock, as many have held stock since the highs of $231.00.
A clear sign that Bullish Trend is getting stronger is if we break above the Red Resistance Trend line and Confirm Support and show clear signs of moving above the Orange zone as well.
Another sign would be a clear HIgher Low Print.
But do keep in mind, probabilities point to Current Trend Continuing unless something big happens.
So its exciting to see what plays out in the coming weeks to months as Target attempts big things or the big things fizzle out.
Follow for more updates.

Gold (XAUUSD) – 15m • Short-term trend is bullish inside an ascending channel
• Price is sitting on a key support at 4,850–4,860
• Above 4,850 → bullish continuation toward 4,920 / 4,980
• Below 4,840 → deeper pullback toward 4,800
• Stop-loss for longs: below 4,830
Summary: This is a decision zone — hold support = upside continuation

DF (Canada) - Slow And Steady Wins The Race?Given all the crazy volatility across metals, stocks, and crypto at the moment, I thought Id have a look for those quieter slow and steady stocks / etfs that are just ticking away and staying out of the drama.
Dividend 15 Split Corp II has quietly put together a very strong run, gaining over 54% in the last year. While the big tech names usually grab the headlines, this Canadian split share corporation has been trending steadily higher in a clear channel. It essentially acts as a leveraged bet on reliable dividend payers, and right now, in the current market, that momentum is hard to ignore.
Fundamentally, this strength is being driven by the performance of its underlying portfolio, which consists of 15 high-quality Canadian blue chips like banks, utilities, and telcos. As interest rate pressure eases, money has been rotating back into these yield-heavy sectors. Because of the split share structure, the Class A shares (DF) amplify the gains of those underlying stocks, which explains the aggressive move up compared to the broader Canadian TSX. The recent pause in price action looks like a healthy breather rather than a reversal.
Technically, the chart is well-behaved. The price has been respecting a rising channel for months, making higher highs and higher lows. The recent pullback successfully tested support near the moving average (the red line), and buyers stepped back in. The RSI is sitting at a comfortable 63, meaning there is still room to run before it gets technically overbought. It might be a little more expensive than it could be, but depends how long you want to hold it.
Might be worth a watch if you like yield with a side of momentum. ..................................................
PLEASE NOTE: Nothing I post is trading advice. All investing involves risk, and past performance doesn’t predict future results. Trends can and do end. For 2026 , my goal is to try and post one new asset each day. Something outside the usual gold, silver, BTC, or big tech names. I like to find stocks worldwide showing steady trends with some good gains, a recent pullback, and signs of renewed strength. I don’t necessarily hold positions in these. They are simply companies I find interesting at the time of posting. I’ll often revisit them within a week to see how they went and share any updates. If you enjoy these posts, please BOOST and FOLLOW ME to discover more under-the-radar stocks and businesses from around the world. ..................................................

Gold, Thoughts, Ideas and Weekly PlanThe Week.
The precious metal expanded its gains at the beginning of the week to 5600$ before losing them all, including some of the previous week, closing with a massive shooting star.
That is a big sign of weakness and might be a sign of a pause, if not some serious correction, which could drop the price to either 4260 or 3900
Daily chart:
The trend is still up, and the gold remains strong, but the Friday candle is something to consider seriously. The chart hasn't printed anything like that in the past year, and even more, it is a clear signal of lots of longs being liquidated. For now, the daily chart confirms the possibility of a low test. The current trading range is 4260-5600, with a mid-range around 5070.
4h Chart:
Since Thursday, the PA entered a waterfall and the price kept falling until the end of the session on Friday, where it finally found some support, total lost 16.07% or 900 pips. This indeed was a very heavy fall, and it is highly likely to enter into a congestion with a possibility of correction to 5145, giving the wide range in which the gold is trading now, in both cases, there will be serious opportunities to trade.
1h Chart
Digging deeper into the chart at 1h, we can see a very well-defined bottom with that hammer some hours before Friday's close. This will be the first line of support for any trade next week, above the 1h upper band matches perfectly with the 4h mid range level, also confirming a good resistance point. Once we have identified our trading range is time to turn to the actual plan.
The Plan:
Trades within the current range 4692 -5151
This range is really wide, 400+ pips, offering a great rejection setup either at support or resistance with Target either the mid-range level 4927 or the opposite band (i.e if trading rejection at support, target resistance)
Trades outside of the range (breakouts)
Breaking support 4692 Targets: 4539(Daily bottom band) or 4275( Daily range extension and also weekly bottom band)
Breaking resistance 5151.35 Target next LH 5450.85
Thank you for dedicating some of your precious time to reading this idea.
I hope you have a profitable trading week.
Every week I publish ideas, thoughts, chart readings, and plans about Gold, EU, GU, EJ and UJ, follow so you don't miss them.
Next week, I will be publishing a very interesting report/study about target optimisation and profit maximisation. If it's something you might be interested in, please follow to not miss it.
