GBPAUD bearish prognosis
OANDA:GBPAUD view, still bearish expectations.
-Trend based analysis.
-Price is bounce from PA top line (white doted), we have 2 sup zones visible (violet doted), from which price is make bounce, which will take and for SL zone. Currently price in CHANNEL.
-GBP CPI negative results in week before.
SUP zone: 0.05900
RES zone: 2.02300, 2.01300
Parallel Channel

Parallel channel Longafter redrawing trendlines i see retracememnt will go to 0.7 level which is more aggressive.

HTZ:From Breakdown to Breakout,Bullish Reversal Gaining TractionHertz Global Holdings, Inc. (NASDAQ: HTZ)
Technical Outlook: Potential Reversal Following Structural Breakout
Date : 5 November 2025
Summary
Hertz Global Holdings (HTZ) has exhibited signs of a potential medium-term trend reversal following a prolonged downtrend since mid-2023. Multiple bullish technical signals — including a breakout from key continuation patterns, RSI divergence, and sustained support retests — point toward a possible shift in market sentiment.
Price Action and Technical Developments
1. Downtrend continuation : Since July 2023, HTZ has been in a persistent downtrend, reinforced by a breakdown below major horizontal support.
2. Symmetrical triangle breakdown (Feb 2024) : The stock failed to hold within a consolidation structure, confirming bearish momentum at that stage.
3. Bullish divergence (Sept 2024) : Despite registering new price lows, the RSI formed higher highs, suggesting weakening downside momentum and potential for reversal.
4. Falling wedge breakout (Nov 2024) : Price action reversed from a classic bullish pattern, followed by a strong rally through the end of November.
5. Symmetrical triangle breakout (Apr 2025) : HTZ broke out of consolidation on elevated volume, coinciding with a break above the long-term descending trendline — a key technical inflection point.
6. Current setup (Nov 2025) : The share price is consolidating within a falling channel. On 4 November 2025, it rebounded from a confluence of supports — including the uptrend line from September 2024 and prior resistance turned support — reinforcing near-term bullish bias.
Trading Idea
Entry Zone: 4.71 - 5.50
Target: 10.50 and 15.00
Support: 4.71
Conclusion
After a long downtrend, HTZ is showing a clear shift in momentum. With multiple bullish patterns confirmed and strong support holding, the stock may be entering a new uptrend phase toward USD 10.50 and USD 15.00.

EURUSD: Rebound Phase Developing From 1.1510 Support ZoneHello everyone, here is my breakdown of the current Euro setup.
Market Analysis
EURUSD has been forming a complex market structure, transitioning through several distinct phases. Initially, the pair traded within a Range Zone, showing indecision between buyers and sellers. A strong bullish breakout from the range led to the creation of an Upward Channel, where buyers maintained momentum until the price reached the 1.1660 Resistance Zone. This level acted as a significant supply area, resulting in multiple rejection points and eventually a bearish breakout from the channel.
Recently, EURUSD began consolidating in a Descending Triangle Pattern, with the Triangle Resistance Line serving as a dynamic barrier against bullish attempts and the Triangle Support Line acting as a demand zone. Currently, the pair is testing this support zone around 1.1500–1.1480, which has already provided several short-term rebounds. A clear break below this area could confirm a continuation of the bearish structure, potentially pushing price lower toward 1.1450 and even 1.1400. On the other hand, a rebound from the support line with strong bullish momentum could signal the beginning of a reversal move, targeting the resistance levels at 1.1530–1.1540.
My Scenario & Strategy
From my perspective, EURUSD sits at a pivotal technical point. If the Triangle Support Line continues to hold, I expect a bullish breakout attempt above the triangle’s resistance, confirming a possible trend reversal toward higher levels. Short-term traders could look for long entries near the 1.1500 support zone with tight stop-losses below 1.1480, aiming for a retest of 1.1530–1.1540. However, if the pair breaks and closes below 1.1480, it would invalidate the bullish scenario and likely trigger renewed selling pressure toward 1.1450–1.1400. For now, I remain cautiously bullish, expecting a potential rebound from the support base before a decisive move unfolds.
That's the setup I'm tracking. Thank you for your attention, and always manage your risk.

XAUUSD: Bulls Defend Channel Support, Eyeing $4,130 ReboundHello everyone, here is my breakdown of the current Gold setup.
Market Analysis
Gold (XAUUSD) continues to trade within a well-defined upward channel, showing a clear structure of higher highs and higher lows. After a series of breakouts and retests, the price recently tested the channel support and the key demand zone around $3,900–3,920, confirming buyers’ activity in that area.
Currently, previous fake breakout above the $4,130 resistance area led to a pullback, but the market is now stabilizing and showing early signs of bullish momentum. This zone aligns with both the lower boundary of the ascending channel and a horizontal support area — a technically strong confluence that often attracts long positions.
My Scenario & Strategy
The current setup suggests that as long as the $3,900 support holds, gold remains in a bullish structure. A confirmed bounce from the lower channel boundary would likely trigger a new impulsive move toward the $4,130 resistance zone, which is also the previous breakout area. If buyers manage to break and hold above that resistance, the next potential upside target is around $4,200–$4,250, aligning with the upper boundary of the channel.
My strategy here is to look for bullish confirmation signals (candlestick patterns or volume breakout) near the support zone and aim for long entries with targets toward $4,130 and higher. A daily close below $3,880 would invalidate this scenario and open the door for a deeper correction.
That's the setup I'm tracking. Thank you for your attention, and always manage your risk.

Sell order EURUSD in bear channel RR 1:2 My other trade in EUR USD for reversal failed, and bear channel is forming. going short on the entry price by order.

CenturyplyHi,
Price traded in parallel channel and now traded near to the support area so possiblity that it will be moves upper side let's see what happens
This idea is for Educational purpose and paper trading only. Please consult your financial advisor before investing or making any position. Facts or Data given above may be slightly incorrect. We are not SEBI registered

BTCUSD Rebounds from Support — Bulls Eye $106K Recovery MoveHello traders, I want to share with you my opinion about Bitcoin (BTCUSD). Bitcoin has been experiencing a prolonged corrective phase following a previous bullish rally. The market recently retested the Buyer Zone near $103,800–$104,200, where strong demand has once again emerged. This area has historically acted as a reliable support level, preventing deeper declines and triggering multiple rebounds. Currently, the structure is forming a descending wedge pattern, characterized by converging resistance and support lines. This technical formation often signals potential bullish reversals, especially when it appears near a key demand zone. The latest test of the lower wedge boundary coincided with the Support Level, resulting in a sharp reaction from buyers. From my perspective, as long as the price holds above the Buyer Zone, the probability of a bullish breakout increases. A confirmed breakout above the resistance line would likely validate a move toward the $106,000 TP1 level, which aligns with previous local highs and the upper boundary of the pattern. However, if BTC fails to break the resistance and falls back below $103,800, sellers could temporarily regain control, pushing the price lower before another accumulation phase develops. Overall, the current setup favors the bulls, with clear structural support and a tightening pattern suggesting that Bitcoin may soon attempt a rebound toward $106,000 and potentially higher levels. Please share this idea with your friends and click Boost 🚀

Euro continued Weakness Points to 1.1480 RetestHello traders, I’d like to share my view on EURUSD. The current market structure shows a clear bearish momentum, with the pair consistently forming lower highs and lower lows inside a well-defined descending channel. The rejection from the 1.1660 Resistance Zone — which coincides with a strong Seller Zone — marked the beginning of a sustained downtrend. After a fake breakout attempt above the resistance, the market quickly reversed and continued to decline, confirming that sellers remain in control. The pair is now trading close to the Buyer Zone, which aligns with the Support Level around 1.1500–1.1480. This area has historically acted as a key demand region, making it crucial for the next price reaction. At the moment, EURUSD is respecting both the Resistance Line and the Support Line within the channel, showing the continuation of the bearish cycle. My primary scenario anticipates a potential short-term pullback toward the upper boundary of the channel (around 1.1560–1.1580) before another bearish impulse develops toward TP1 at 1.1480. However, a confirmed breakout above 1.1600 could invalidate this bearish setup and open the way for a broader correction toward the 1.1660 Resistance Level. Until then, the trend remains bearish, and I favor short opportunities targeting 1.1480 as the next key level. Please share this idea with your friends and click Boost 🚀

EURUSDThe price has found support at the 1.1475 zone and is moving within a curved channel. Any type of channel movement is tough to predict as the price will be moving in a zig-zag or choppy.
Nearby resistance is seen at 1.1511.
If the price doesn't gain strength to move up, once again it can try to test the support zone. If it follows the curved channel support, the price can test 1.1511.
Always do your analysis before taking any trade.

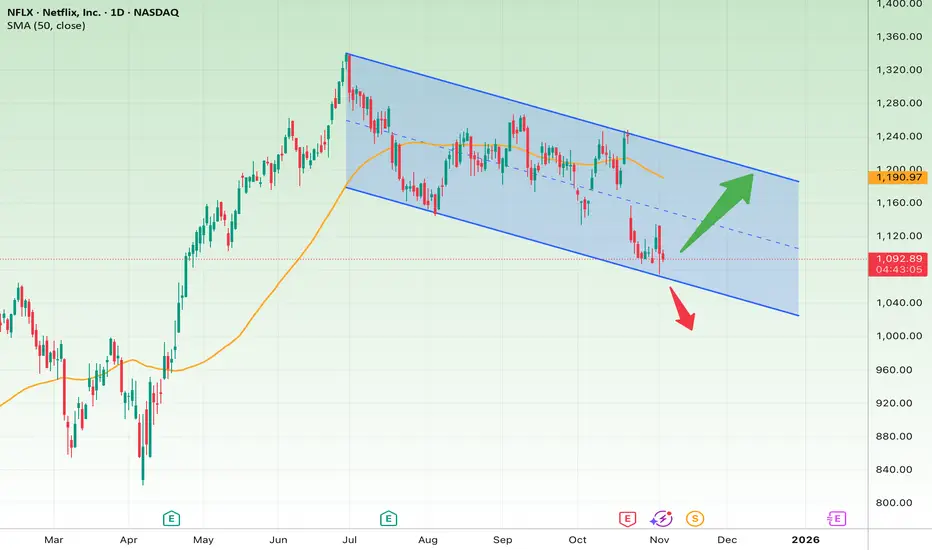
Netflix in a Downtrend ChannelThe Netflix (NFLX) daily chart shows a well-defined descending channel that started from around $1,350 and remains intact. The price is currently trading near the lower boundary of the channel ($1,080–$1,100) — a critical zone where buyers may attempt to step in or where a potential bullish divergence could form.
Short-Term Outlook (next few days to weeks):
In the short term, the $1,080 area acts as strong support. If the price manages to hold above this level and bounce back over $1,130, a corrective move toward $1,180–$1,200 is likely — an area that aligns with both the 50-day SMA and the midline of the channel.
However, a confirmed breakdown below $1,080 could trigger further downside toward $1,020 or even the lower channel line near $980.
• Bullish short-term target: $1,180–$1,200
• Bullish stop loss: Below $1,075
• Bearish short-term target: $1,020–$980
• Bearish stop loss: Above $1,130
Long-Term Outlook (1–3 months):
As long as the price remains within the descending channel, the broader trend stays bearish. Yet, the channel is starting to narrow, which often signals a potential end to the correction phase.
A breakout above the upper boundary ($1,220–$1,250) with confirmed closes would signal a trend reversal, opening the way toward $1,350–$1,400.
Conversely, if the lower channel support around $980 breaks down, the next downside target would be $915.
• Bullish long-term target: $1,350–$1,400
• Long-term stop loss: Below $980
In summary, Netflix is sitting at a decisive point within its downtrend channel — holding above $1,080 could spark a short-term rebound, while a breakdown could send the stock below $1,000 toward deeper support levels.
BITCOIN (BTCUSD): Pullback From Key Support
Bitcoin is currently trading within a wide horizontal range on a daily.
We see a test of its support now.
There is a high chance that the price will bounce from that, following
a formation of a confirmed bullish imbalance candle.
Goal - 105170
❤️Please, support my work with like, thank you!❤️
I am part of Trade Nation's Influencer program and receive a monthly fee for using their TradingView charts in my analysis.

ETH/USD: Bullish Channel Under Pressure?
Daily ETH/USD chart shows price respecting a long-term ascending channel from the $3,200 low. After consolidation between $3,800–$4,200, ETH has pulled back to the channel midline (~$3,900) amid selling pressure.
• Key Support: $3,600–$3,700 (lower channel line + 0.618 Fib)
• Immediate Resistance: $4,100–$4,200 (upper line + psychological level)
• Volume: Declining on red candles → weakening bearish momentum
Bullish Case: Hold above $3,700 → retest $4,200
Bearish Case: Break below $3,600 → target $3,200–$3,000
Trade Idea: Long on pullback to $3,700 (SL below $3,550); short below $3,600.

EURUSD Short: Sellers Targeting Move Toward 1.1480 SupportHello traders! EURUSD continues to move within a clear bearish structure after facing strong rejection from the 1.1660 Supply Zone. The pair recently formed a Pivot Point at the top of the Ascending Channel, where a Fake Breakout signaled exhaustion among buyers and triggered renewed selling pressure.After breaking below the Ascending Channel, EURUSD established a new Descending Channel, confirming that sellers have regained momentum. The Supply Line has been well-respected, with each pullback offering another opportunity for sellers to enter the market.
Currently, the price is hovering near the Demand Line, around the 1.1520–1.1500 area, which coincides with a previous pivot zone. While a minor rebound from this level is possible, overall momentum remains bearish as long as price trades below the 1.1600–1.1660 Supply Zone.
From my perspective, EURUSD is likely to continue its downward move toward the 1.1480 Demand Level, aligning with the lower boundary of the current channel. A confirmed breakdown below 1.1480 could open the door for a deeper decline toward 1.1450. However, a strong bullish reaction from this area could lead to a temporary pullback toward 1.1560–1.1580 before the next leg lower. For now, I remain bearish on EURUSD, monitoring potential short setups from the upper channel boundary with a primary target near 1.1480. Manage your risk!

GOLD → Consolidation is narrowing... Price is weakening FX:XAUUSD is trading near $4,000, consolidating after the Fed's statements and awaiting new macro data. The trading range has narrowed to $3,886–4,046, forming a symmetrical triangle (unpredictability)
Fed caution: Powell ruled out guarantees of a rate cut in December, which supported the dollar and limited gold's growth.
US shutdown: Could become the longest in history, causing economic concerns, but is expected to end this week.
Weak data: ISM Manufacturing PMI (48.7) pointed to contraction in the sector, which is holding back the dollar's strengthening.
This week, attention is focused on ADP and ISM Services — assessing the impact on Fed rates.
NFP (if published) — a key benchmark for the labor market.
Accordingly, gold is in wait-and-see mode. Clear signals from the data or the Fed will be needed to break out of the range. The $4000 level remains a psychological equilibrium point.
Resistance levels: 4000, 4030, 4050
Support levels: 3956, 3915, 3900
At the moment, the price is far from the key consolidation boundaries, and the market is uncertain. In this case, we are considering trading within the channel. I expect to see a retest of the flat resistance or the triangle boundary and a rebound.
Best regards, R. Linda!

USDCAD: Time For Correction 🇺🇸🇨🇦
There is a high chance that USDCAD will continue retracing
from the underlined blue resistance.
The price formed a double top pattern on that and violated
a support line of a rising channel with a bearish imbalance candle
after its test.
I will expect a down movement to 1.4047
❤️Please, support my work with like, thank you!❤️
I am part of Trade Nation's Influencer program and receive a monthly fee for using their TradingView charts in my analysis.

ETH Retracement Ethereum has broken the 0.618 retracement zone, and is just at the bottom of the downward channel of the bull-flag created as it reached it's new ATH after a strong bull run. Should this channel support break, the bull flag is invalidated, and I'd expect further retracement to the 0.5 FIB zone ($3,365) - with strong downward momentum, we could see a breach to the $2,997 area (0.382 FIB).

EURUSD shortEURUSD has been in a down trend creating lower lows and lower highs
price retraced creating a rising wedge
we had a break out and see continued momentum to the down side

CADJPY - The Trio Retest Setup!📈CADJPY has been on a strong bullish run lately, but price is now approaching a critical confluence zone, the perfect Trio Retest Setup.
The red circle highlights the intersection of two upper trendlines (the rising channel and the short-term wedge) together with a major horizontal resistance at 111.00.
⚔️This trio intersection creates a powerful technical barrier, suggesting that the pair is overbought in the short term. From here, I’ll be looking for signs of exhaustion or reversal patterns to catch the next corrective leg down.
🔎A potential retracement could send CADJPY back toward the 106.00–105.00 support zone, which also aligns with the lower boundary of the main ascending channel.
Until the trio zone is broken decisively to the upside, the bears might step in to cool off the momentum.
⚠️ Disclaimer: This is not financial advice. Always do your own research and manage risk properly.
📊All Strategies Are Good; If Managed Properly!
~Richard Nasr

TeslaI have taken 2 time frames to get confused. 😇 The 15-minute time frame shows a resistance breakout out and the hourly time frame shows a descending channel resistance.
It is always better to take less risky trade entries.
If the price is unable to break the channel's resistance and fall, watch whether the price is showing bullish strength around the 440 to 444 zone. If there is bullish strength, buy above 445 with the stop loss of 440 for the targets 449, 454, 459 and 464.
Always do your analysis before taking any trade.

EURCAD: Consolidation Trading 🇪🇺🇨🇦
EURCAD is trading in a horizontal range.
The price has just tested its support.
There is a high chance that the price will bounce from that
and reach a resistance of the range soon.
Goal - 1.621
❤️Please, support my work with like, thank you!❤️
I am part of Trade Nation's Influencer program and receive a monthly fee for using their TradingView charts in my analysis.

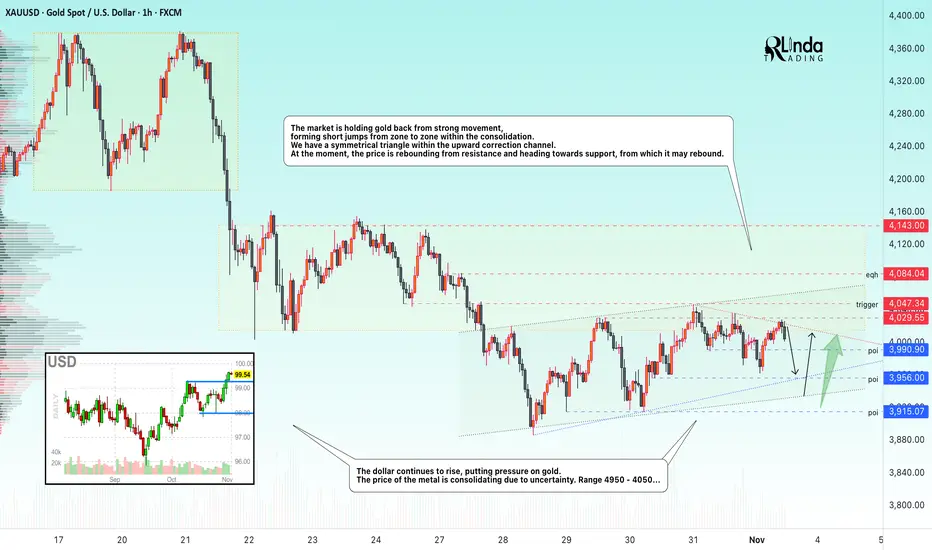
GOLD → Consolidation within a symmetrical triangle The market is holding gold back from strong movement, forming short jumps from zone to zone within consolidation. We have a symmetrical triangle within an upward correction channel.
Key supporting factors:
The US shutdown is becoming the longest in history, increasing economic risks.
China is canceling tax breaks for retailers. Trump may announce new tariffs related to China.
ISM Manufacturing PMI data (US) is ahead - a rare indicator during the shutdown.
The probability of a Fed rate cut in December has fallen to 69% (from 91.7% a week ago).
Technically, consolidation may continue until the price breaks one of the boundaries of the symmetrical triangle.
Support levels: 3990, 3956, 3915
Resistance levels: 4030, 4047, 4085
Traders are uncertain about the future direction, and as a result, the market is consolidating. There are limit levels both below and above that are holding back movement. Accordingly, until there is a clear fundamental background, it is possible to focus on trading within the channel. I expect a rebound from 3960 for a retest of resistance. However, a close above 4030 could trigger growth, while a close below 3956 would confirm the weakness of the market and trigger a fall to 3900.
Best regards, R. Linda!
BTCUSDT: Buyers Aim for Recovery Toward $115K ResistanceHello everyone, here is my breakdown of the current Bitcoin setup.
Market Analysis
Bitcoin (BTCUSDT) is showing a constructive bullish setup after rebounding from the 106,600–107,000 Support Zone. This area has consistently acted as a strong demand region, confirming buyers’ interest each time price tested the lower boundary of the Upward Channel. The market structure has remained bullish overall, characterized by a series of higher highs and higher lows since the correction phase in mid-October.After a recent fake breakout below the support line, buyers quickly regained control, pushing price back above the channel’s lower boundary. This rejection from support and recovery above 110,000 suggests renewed bullish momentum.
Currently, BTCUSDT is approaching the midline of the channel, while short-term resistance lies at 115,400 — a level that coincides with a previous fake breakout zone and horizontal supply area.
My Scenario & Strategy
As long as BTCUSDT holds above the 109,000–110,000 region, the bullish scenario remains valid. I expect the price to continue climbing toward the 113,000–115,400 Resistance Zone in the near term. A clean breakout above 115,400 could open the way for another bullish leg toward the upper boundary of the channel near 117,000–118,000.
However, a confirmed rejection from 115,400 could trigger a temporary pullback toward the support trendline before another potential push higher. In my view, Bitcoin remains in a healthy uptrend, and I prefer to look for long opportunities from dips above the support line, targeting 115,400 (TP1) and potentially 117,000 (TP2).
That's the setup I'm tracking. Thank you for your attention, and always manage your risk.
