Memecoin DailyView | The Web3 Power of Memeland💀 Hey , how's it going ? Come over here — Satoshi got something for you !
⏰ We’re analyzing Meme on the 1-Day timeframe .
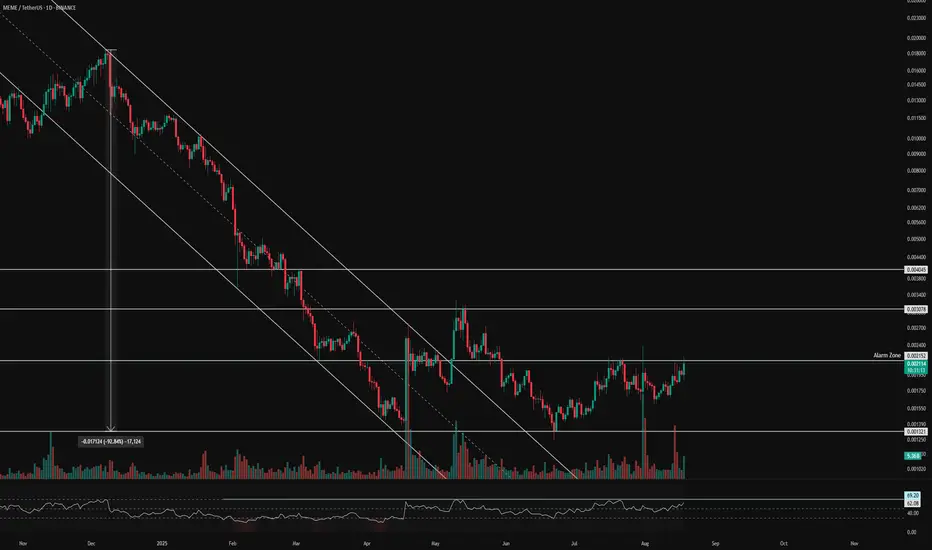
👀 On the daily timeframe of Memecoin, we can see that after a deep 93% correction, MEME broke out of its descending channel. It then faced another pullback on lower timeframes. A very strong bottom was formed around 0.001321, and from this level, with increasing volume and trades, MEME moved upward towards the resistance at 0.002152. Currently, it is trying to break this resistance, which has previously acted as the top of the box and caused rejections .
⚙️ The key RSI level is at 69.20–70. If this level is broken, increased buying momentum could push MEME into the Overbought zone, attracting more buyers .
🕯 Today, the number of long trades has increased, and the size of today’s daily candle looks strong so far. With more buying volume, MEME could break this resistance and aim for higher price levels .
💡 This coin was created by the 9GAG team, who are active in the memecoin sector. The project is a new form of internet money inspired by meme culture. It currently ranks #337 on CoinMarketCap. The project is fully decentralized and operates as a DAO, where NFT holders take part in governance and decision-making .
🔔 The Alert zone is at 0.002152. If this level breaks and confirms, it could provide a good entry for long trades. The short position alert zone is below the daily bottom, but personally, I would avoid shorting this coin .
❤️ Disclaimer : This analysis is purely based on my personal opinion and I only trade if the stated triggers are activated .
Parallel Channel
BONK 4H Analysis – Key Triggers Ahead💀 Hey , how's it going ? Come over here — Satoshi got something for you !
⏰ We’re analyzing BONK on the 4-hour timeframe timeframe .
👀 In the 4-hour timeframe of Bank, we can see that Bank had a good descending channel, which with the recent drop reacted to the midline of the channel and then moved towards the top of the channel, and with a strong 4-hour whale candle, it stabilized above its descending channel and is now completing a pullback to its channel in multi-timeframe.
⚙️ The key RSI area is the 59 zone, which if the fluctuation passes this level, Bank can move upwards and have a trend reversal after this corrective wave.
🕯 The heavy and good increase in Bank’s volume at this bottom shows the presence of the market maker, the size of the 4-hour candle with which we broke the channel top also seems whale-like.
📊 The OTHERS.D index and we can see, this index is inside a 4-hour box, with the breakout of the top of this box which is at the 7.9% area, good money enters Bank. The midline of this box is at the 7.74% area, which if lost, our analysis can fail.
🔔 The areas we considered as alarm zones are the midline area and the top area. As long as we are above the midline area, we can open our position with low risk and a big stop, which is almost high-risk. The alarm zone 0.00002357 can be a more reliable area for breakout and taking trades. Keep in mind that the market conditions seem risky and the market is in decision-making mode.
❤️ Disclaimer : This analysis is purely based on my personal opinion and I only trade if the stated triggers are activated .

TAO 4H Analysis - Key Triggers Ahead💀 Hey , how's it going ? Come over here — Satoshi got something for you!
⏰ We’re analyzing TAO on the 4-Hour timeframe.
👀 On the 4-hour timeframe for Bittensor (TAO), we can see that this coin belongs to the AI category on CoinMarketCap and currently holds rank #35. TAO had been moving inside a continuation descending channel, but it has now successfully broken out of this channel. With a completed pullback and a proper setup candle confirmation in multi-timeframe analysis, this could present a trade opportunity.
⚙️ Key RSI levels for this coin are at 70 (overbought threshold) and 35 (near oversold). At the start of the current leg, during the holiday session, volatility increased strongly, and TAO managed to break through its swing resistances. If RSI pushes above 70 and enters the overbought zone, the coin could experience a solid bullish move.
🕯 The number of green candles has been increasing, and TAO also reacted well to the channel top. At the same time, a major resistance at $322 was broken, with all sell orders at that level fully absorbed.
🪙 Looking at the TAO/BTC pair on the 4-hour timeframe, we can see that after breaking through its previous resistance, the pair is currently consolidating and completing a pullback at this zone. Once the pullback is confirmed with a setup candle, we could have a strong trade confirmation.
💡 The key alarm zones for this coin are:
Around $322, where a reaction followed by a bounce can push the price higher.
With a successful breakout above $327, TAO could gain momentum and continue its bullish trend.
❤️ Disclaimer : This analysis is purely based on my personal opinion and I only trade if the stated triggers are activated .

Gold can Resume its Uptrend After This CorrectionHello traders, I want share with you my opinion about Gold. The market context for Gold has been firmly bullish since the price action reversed from the deep 3335 - 3355 buyer zone, a move which established the current, well-defined upward channel. This bullish structure has since been guiding the price of XAU higher through a series of impulsive moves and corrective pullbacks, confirming that buyers are in control of the dominant trend. Currently, after testing the upper boundary of the channel, the asset is undergoing a healthy correction. This pullback is now guiding the price towards a critical confluence of support, where the ascending support line of the channel meets the horizontal support zone around the 3675 current support level. In my mind, this pullback is a classic trend-continuation opportunity. I expect that the price will find strong support in this area and bounce from the channel's support line. I think this rebound will signal the end of the correction and the resumption of the primary upward trend. Therefore, I have placed my TP at 3820, a target representing a new structural high and a logical objective for the next impulsive wave. Please share this idea with your friends and click Boost 🚀
Disclaimer: As part of ThinkMarkets’ Influencer Program, I am sponsored to share and publish their charts in my analysis.

BTCUSD: Awaiting Rejection from the Seller ZoneHello everyone, here is my breakdown of the current Bitcoin setup.
Market Analysis
From a broader perspective, the price action for Bitcoin has been highly volatile, transitioning from a Downward Channel into the current Broadening wedge. This pattern is defined by higher highs and lower lows, indicating an ongoing battle between buyers and sellers with expanding volatility and no clear winner yet.
After failing to break the major Resistance at the 115800 level, the price has rotated down across the entire pattern. Currently, it is trading at a critical location, testing the ascending support line of the wedge, just above the major horizontal Support zone which starts at the 110000 level.
My Scenario & Strategy
My scenario is built around the idea of a potential 'fake breakdown' or a liquidity hunt below the wedge's trendline. I believe the market may make one final push down to test the major horizontal Support at the 110000 level. The key signal I'm watching for is a swift reversal after this potential dip.
Therefore, the strategy is to watch for this reversal. A successful reclaim of the wedge would validate the long scenario. The primary target for the subsequent rally is the 115800 Resistance, which represents a full rotation back to the top of the pattern.
That's the setup I'm tracking. Thank you for your attention, and always manage your risk.

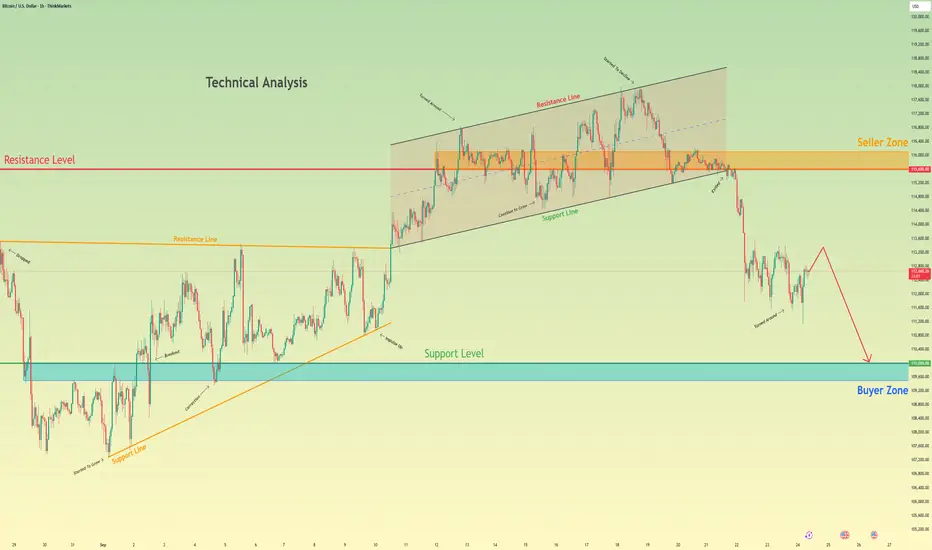
BTCUSD Short: Fading the Rally in a Bear ChannelHello, traders! The price auction for BTCUSD has been in a clear bearish phase since its rejection from the SUPPLY ZONE 2 near 115200. This has established a well-defined descending channel that has been guiding the price lower through a series of impulsive declines and corrective rallies, confirming that sellers have the initiative.
Currently, after testing the lower support line of the channel, the price is in the midst of a corrective bounce. This upward move is carrying the auction towards the upper boundary of the channel, which represents a major area of dynamic resistance.
My scenario for the development of events is that this corrective rally will fail upon testing the channel's resistance line, which aligns with the SUPPLY ZONE around the 111000 level. I expect this area to hold as strong resistance, causing a rejection and a continuation of the primary downtrend. The take-profit is therefore set at 107000, targeting a new lower low within the channel. Manage your risk!

GOLD → Consolidation ahead of the news. Rise or fall?FX:XAUUSD is consolidating in the range of 3738-3759 in anticipation of US PCE inflation data, a key indicator for forecasting further Fed policy. Pressure on the metal is intensifying amid a strengthening dollar.
The revision of GDP growth in Q2 to 3.8%, a decline in jobless claims, and an increase in durable goods orders have lowered expectations for aggressive Fed easing.
The new tariffs imposed by Trump have supported demand for defensive assets, but have not been able to offset the pressure from the rise of the USD.
The overall fundamental backdrop is stagnant amid Powell's uncertain stance and the start of a rate cut cycle. The market reaction is mixed...
Gold is in wait-and-see mode. Strong PCE data could send the price to support at $3700, while weak data could bring back interest in record highs.
Resistance levels: 3754, 3759, 3776
Support levels: 3738, 3728, 3703
Technically, the price is storming the resistance of the downward correction and the resistance of the “triangle” consolidation. A breakout and close above 3754-3759 will confirm the bullish sentiment, which could trigger growth towards the ATH. Otherwise, we can expect a retest of 3738-3728 before a possible rise.
Best regards, R. Linda!

XAUUSD: Rally will Continue after CorrectionHello everyone, here is my breakdown of the current Gold setup.
Market Analysis
The prior Upward Channel has been broken, and the price is now trading below a major Trend Line, indicating that the strong bullish momentum has paused and the market has entered a corrective phase.
Currently, this corrective phase has taken the form of a horizontal Range or consolidation above the Support 2 level. The price has been oscillating between local support and resistance, and is now making another move down towards the bottom of this Range for what I see as a critical test.
My Scenario & Strategy
I'm looking for the price to complete its correction down into Support zone. A confirmed bounce from this area would be the first signal that the pullback is over. The next key step would be a breakout from the top of the current Range.
Therefore, the strategy is to watch for this bounce. A successful breakout from the Range would validate the long scenario. The primary target for the subsequent rally is 3825, which aims for a retest of the major broken Trend Line from below.
That's the setup I'm tracking. Thank you for your attention, and always manage your risk.

EURUSD Long: Reversal from Wedge Support ExpectedHello, traders! The prior market structure for EURUSD was a bullish ascending channel, which concluded with a pivot point high at the SUPPLY 2 level of 1.1835. A subsequent breakdown from that channel shifted the market's momentum, initiating a corrective phase that has since taken the form of a downward wedge, guiding the price lower.
Currently, the price auction has completed another leg down within this wedge and is now at a critical inflection point. The price is directly testing the descending support line of the formation, a key area where a bullish reversal could originate. This represents a major test of the prevailing bearish momentum.
My scenario for the development of events is a bullish reversal from the support of this downward wedge. I expect the price to find strong support at the current demand line and initiate a new rally. In my opinion, this move will be strong enough to break through the immediate SUPPLY at 1.1690 and continue towards the upper resistance line of the wedge. The take-profit is therefore set at 1.1755, targeting that upper boundary. Manage your risk!

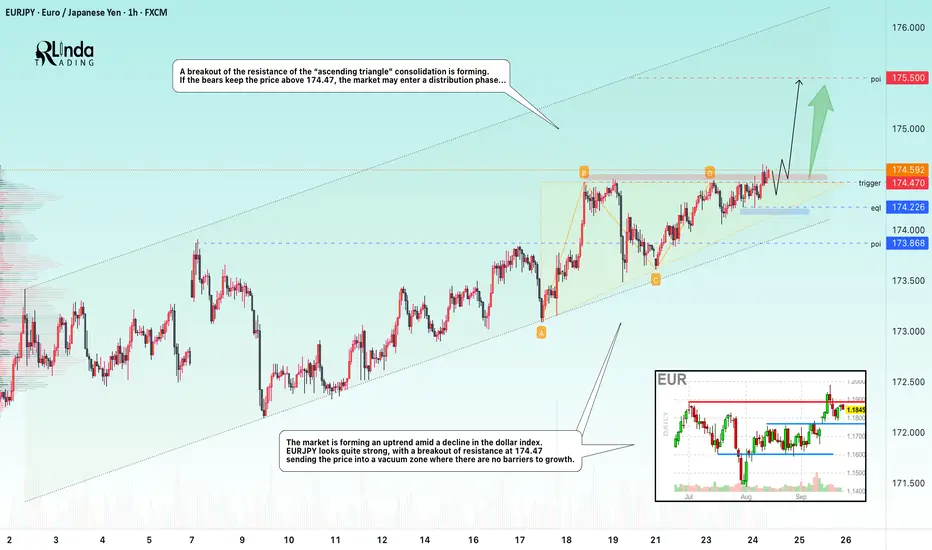
EURJPY → The classical model of technical analysis FX:EURJPY is attempting to break through resistance. The trend is bullish, and the probability of continued growth after consolidation above 174.50 is quite high...
The market is forming an uptrend amid a decline in the dollar index. EURJPY looks quite strong, breaking through resistance at 174.47 sends the price into a void zone where there are no barriers to growth.
A breakout of the “ascending triangle” consolidation resistance is forming. If the bears keep the price above 174.47, the market may enter a distribution phase...
Resistance levels: 174.47, 175.0
Support levels: 174.226, 173.86
The classic technical model for the continuation of the movement is a breakout of the resistance of the ascending triangle. Consolidation of the price above 174.47 - 174.5 may provoke a continuation of the movement within the bullish trend.
Best regards, R. Linda!
AUDUSD - Bullish Control Ahead!Hello TradingView Family / Fellow Traders. This is Richard, also known as theSignalyst.
📈AUDUSD has been overall bullish trading within the rising channel marked in blue.
This week, AUDUSD has been retesting the lower bound of the channel.
Moreover, the green zone is a strong support.
🏹 Thus, the highlighted blue circle is a strong area to look for buy setups as it is the intersection of the lower blue trendline and green support.
📚 As per my trading style:
As #AUDUSD approaches the blue circle zone, I will be looking for trend-following bullish reversal setups (like a double bottom pattern, trendline break , and so on...)
📚 Always follow your trading plan regarding entry, risk management, and trade management.
Good luck!
All Strategies Are Good; If Managed Properly!
~Richard Nasr

Pre-stage 2 breakoutHere's what will most likely happen if DXY breaks down. Forget about demand. Nothing is getting cheaper, starting with raw materials. Bottoming and breakout is almost looking bullish with price over weekly EMA30.

GBPUSD: Cable slides under 1.35 handle after triple blow!Cable faces a crucial test at 1.3500 following yesterday's triple blow from disappointing UK PMI data, hawkish comments from Powell, and concerning UK public sector borrowing figures ahead of November's Budget.
In this ThinkMarkets analysis, we break down the key technical levels as GBPUSD loses the round 1.3500 support but remains within its upward channel.
Key focus areas :
Immediate Risk : Break below channel support targeting 1.3372 double bottom
Critical Level : 1.3335 - invalidation of inverse head & shoulders pattern
Fibonacci Support : 61.8% retracement cluster around 1.3340
Trading Strategies : Three approaches for the potential breakdown
Key Levels to Watch :
Support : 1.3500 (breaking), 1.3450, 1.3372, 1.3340
Resistance : 1.3550 bounce target
Bias : Cautiously bearish while below channel support
The pound continues to face domestic headwinds with stalling economic data and fiscal concerns, making any recovery challenging despite potential Fed dovishness.
Cable traders, watch this critical technical juncture closely.
Trade responsibly with ThinkMarkets - your trusted forex partner.
This content is not directed to residents of the EU or UK. Any opinions, news, research, analyses, prices or other information contained on this website is provided as general market commentary and does not constitute investment advice. ThinkMarkets will not accept liability for any loss or damage including, without limitation, to any loss of profit which may arise directly or indirectly from use of or reliance on such information.

Weak closing but market on the verge of being oversold.We saw a closing today that has dragged Nifty below Father line support and mid channel support of hourly chart. RSI is indicating that the market is oversold and there are slim chances of recovery from support near 24872. If 24872 is broken than we can see Nifty further slipping towards 24772, 24644 or even channel bottom near 24473. If 24473 is broken then market can end up in total bear grip.
Resistances for market seem to be near 24959 Mid channel resistance, followed by father line and Mother line resistance near 24999 and 24125. Closing above 25125 can take the market upwards towards 25215, 25343 and 25431. As of now 25431 is the channel top.
As of now shadow of the candle is neutral but with a tinge of red. Meaning we can have a flat to positive start but later market can become laggard again. For market to sustain upward momentum we need a closing above both Mother and Father line resistances on daily chart.
Disclaimer: The above information is provided for educational purpose, analysis and paper trading only. Please don't treat this as a buy or sell recommendation for the stock or index. The Techno-Funda analysis is based on data that is more than 3 months old. Supports and Resistances are determined by historic past peaks and Valley in the chart. Many other indicators and patterns like EMA, RSI, MACD, Volumes, Fibonacci, parallel channel etc. use historic data which is 3 months or older cyclical points. There is no guarantee they will work in future as markets are highly volatile and swings in prices are also due to macro and micro factors based on actions taken by the company as well as region and global events. Equity investment is subject to risks. I or my clients or family members might have positions in the stocks that we mention in our educational posts. We will not be responsible for any Profit or loss that may occur due to any financial decision taken based on any data provided in this message. Do consult your investment advisor before taking any financial decisions. Stop losses should be an important part of any investment in equity.

Bitcoin can Continue to Decline to Support LevelHello traders, I want share with you my opinion about Bitcoin. The market structure for Bitcoin has recently shifted to a bearish bias following a significant breakdown from its prior upward channel. After a complex consolidation within a triangle, the price of BTC made a final push to the highs near the 115600 seller zone before being strongly rejected, which led to the failure of the channel's support. This structural break initiated a new bearish phase, causing a sharp decline to a recent low of 111600. Currently, the asset is in a small consolidation, attempting a minor corrective bounce after the significant fall. In my mind, this consolidation is simply a pause before the next wave of selling pressure resumes. I expect that this small upward movement will soon be exhausted and that the price will continue its bearish movement downwards. A failure to produce a strong rally from these levels confirms that sellers remain in control of the market. Therefore, I have placed my TP for this trend-continuation scenario at the major 110000 support level. This target is a logical objective, as it represents the next significant area of historical support and aligns with the 110000 - 109500 buyer zone. Please share this idea with your friends and click Boost 🚀
Disclaimer: As part of ThinkMarkets’ Influencer Program, I am sponsored to share and publish their charts in my analysis.
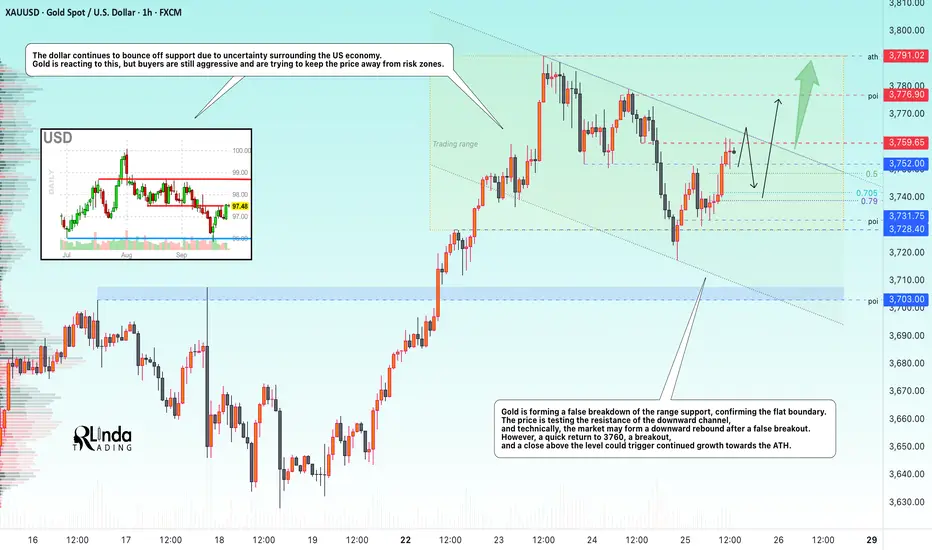
GOLD → Will the correction continue, or is it time for growth?FX:XAUUSD is inside a descending channel—corrections within a global bullish trend. The price is forming a retest of resistance, and the market's reaction to the 3760 zone will give further insight into price movement...
Gold is consolidating in the range of 3730-3790 in anticipation of US economic data and speeches by Fed officials. Pressure on the metal is intensifying due to revised expectations for rate cuts and a correction in the dollar...
Key factors: Markets have reduced expectations for easing to 43 bps by the end of the year after cautious comments from the Fed. The dollar index has reached a 9-day high, limiting gold's growth. Tensions between Russia and NATO are preventing gold from falling.
The market is in wait-and-see mode ahead of tomorrow's PCE data. Strong data today will strengthen the dollar and reinforce the correction in the metal, while escalating geopolitics will bring back demand for safe havens.
Resistance levels: 3760, 3776, 3791
Support levels: 3752, 3741, 3731
Technically, the market is testing downward resistance. Since the opening of the session, the price has already moved a lot and there may not be enough potential for an initial breakout. I expect a pullback to 3745-3740, and if the bulls return the price to 3760, the market will have a chance to break through resistance and continue growing towards the resistance level of the range.
Best regards, R. Linda!
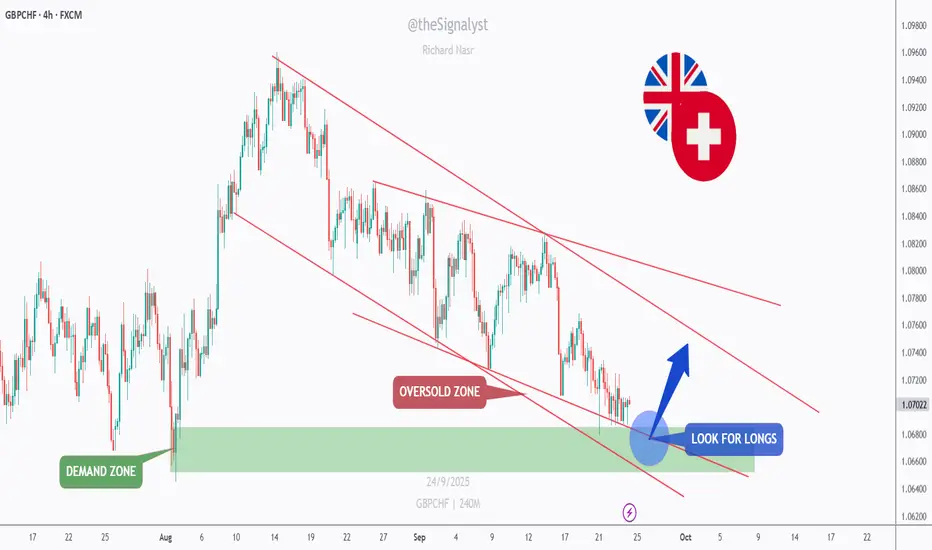
GBPCHF - Oversold at Demand: Longs on Confirmation?GBPCHF has been drifting lower on the 4H inside a falling channel. Price is now tapping a multi-touch demand zone around 1.066–1.070, right at the channel’s lower bound—classic confluence for a bounce.
As long as this base holds, I’ll look for reversal confirmation (wick rejections/HH-HL) to ride a rotation toward 1.075 first, then 1.082–1.085 near the channel midline 📈. A clean 4H close below 1.064 would invalidate the idea and expose 1.060–1.058 next.
What’s your move => buy the dip at demand, or wait for a break of the red channel before joining? 🤔
⚠️ Disclaimer: This is not financial advice. Always do your own research and manage risk properly.
📚 Stick to your trading plan regarding entries, risk, and management.
Good luck! 🍀
All Strategies Are Good; If Managed Properly!
~Richard Nasr

Can Pi Network(PI) Bounce +15% From PRZ?In recent days, Pi Network ( OKX:PIUSDT ) has dropped more than -40% , raising the big question: Is Pi still a project we can rely on, or is momentum fading away?
Main Reasons Behind the Drop:
1-Mass token unlocks in September → Huge increase in supply created heavy selling pressure.
2-Rising exchange reserves → More than 420M now sitting on CEX wallets, a sign of potential sell waves.
3-Fast-track KYC & protocol upgrades → Gave many users access to their tokens, fueling more selling activity.
4-Low liquidity + whale sell-offs → A few large orders accelerated the decline.
The Pi community remains strong, but current supply shocks are outweighing demand. Until the project reaches full exchange listings and sustainable utility, traders should stay cautious and manage risk carefully.
---------------------------------------------------------------
Now let’s take a look at the PI Token chart on the 15-minute time frame .
The PI Token has formed a descending channel over the past day.
From the perspective of Elliott Wave theory , it looks like PI Token is completing a Double Three Correction(WXY) in the descending channel .
I expect PI Token to start rising as it enters or touches the Potential Reversal Zone(PRZ) again and rise to $0.289(+15%) . In general, a break of the upper line of the descending channel is a good sign for the PI token to rise .
Please respect each other's ideas and express them politely if you agree or disagree.
Pi Network Analysis (PIUSDT), 15-minute time frame.
Be sure to follow the updated ideas.
Do not forget to put a Stop loss for your positions (For every position you want to open).
Please follow your strategy and updates; this is just my Idea, and I will gladly see your ideas in this post.
Please do not forget the ✅' like '✅ button 🙏😊 & Share it with your friends; thanks, and Trade safe.

US30 - Short Setup – Rising Channel (4H)I'm currently eyeing a short opportunity on US30 (Dow Jones Industrial Average) based on the 4H timeframe.

BTCUSD: Rally Back to 116000 ResistanceHello everyone, here is my breakdown of the current Bitcoin setup.
Market Analysis
The market for Bitcoin has seen a structural shift after breaking down from its prior Upward Channel. This event signaled a loss of bullish momentum and led to a sharp decline down to the major horizontal Support at the 112000 level.
Currently, the price has found significant support in the 111500 - 112000 Support zone and has initiated a bounce. The market is now in a potential reversal phase, but I believe the conviction of the buyers still needs to be confirmed with one final test.
My Scenario & Strategy
My scenario is built on the idea that the 112000 Support is a major area of demand that will ultimately hold. I'm looking for a strong and confirmed bounce from Support zone. This would be the key signal that the corrective low is in place and the market is ready to reverse its course and begin a new rally.
Therefore, the strategy is to watch for this successful retest. It would validate the long scenario, with the price then expected to rally back up to the point of the initial breakdown. The primary target for this move is the 116000 Resistance level, which also aligns with the Resistance Zone.
That's the setup I'm tracking. Thank you for your attention, and always manage your risk.

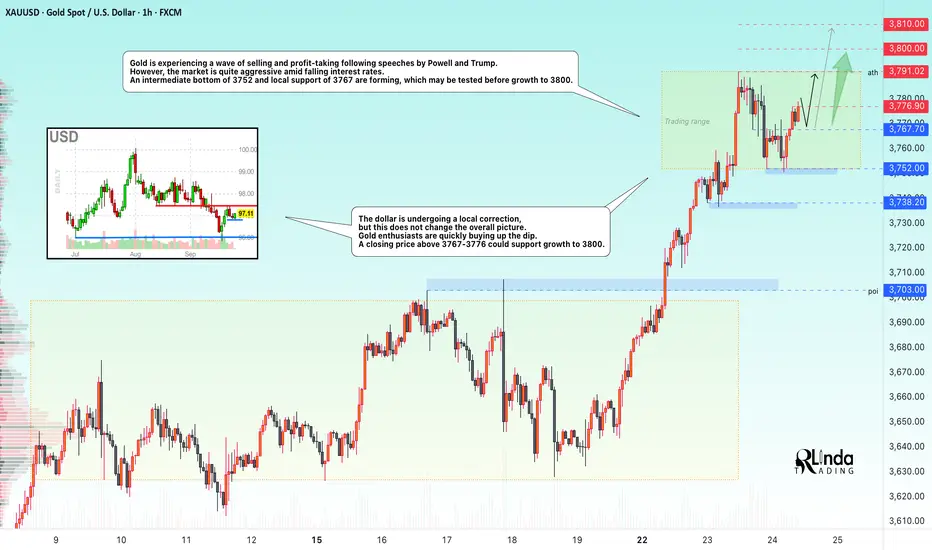
GOLD → Intermediate bottom. Consolidation before growth FX:XAUUSD is being sold off and declining amid profit-taking following speeches by Powell and Trump. However, the market is quite aggressive amid falling interest rates. After forming an interim bottom, the market quickly bought back the decline.
Gold is correcting after record growth, awaiting new signals from Fed representatives and PCE inflation data on Friday. The price remains close to historic highs, but the upward momentum has temporarily slowed, with consolidation forming at 3752-3791.
Key factors : Powell gave no clear hints about future rate cuts, noting the risks of rising inflation and a weakening labor market. The probability of a rate cut in October has risen to 92%, but the Fed's sentiment index is fluctuating somewhat...
The risk of a US government shutdown on October 1 and mixed PMI data are holding back the USD's strengthening.
Technically, gold remains in a bullish trend, but consolidation is possible in the short term. PCE data will be the deciding factor — weak figures will support the metal, while strong figures will trigger a correction.
Resistance levels: 3776.9, 3791, 3800
Support levels: 3767, 3752, 3738
The price is consolidating. Before reaching 3791-3800, there may be a retest of local support. Similarly, a retest of the ATH may also trigger a small pullback of 1/2 of the impulse before a breakout and growth to the specified targets.
Best regards, R. Linda!
EUR/AUD: Confirmed Bearish Reversal?!EURAUD appears to be providing significant bearish signals, Following a test of a strong daily horizontal resistance,
I have observed both a double top and a rising parallel channel pattern.
The price has broken below the horizontal neckline and a trend line, closing below both.
I anticipate a continued bearish movement towards 1.7730.
