Bitcoin Rejects Resistance, Eyes Support Test Around $65KHello traders! Here’s my technical outlook on BTCUSDT (1H) based on the current chart structure. Bitcoin previously traded within a well-defined descending channel, where price respected both the resistance and support boundaries, confirming controlled bearish pressure rather than impulsive selling. This channel structure guided the market lower with consistent lower highs and lower lows, reflecting steady seller dominance. The decline eventually culminated in a sharp sell-off that swept liquidity and formed a clear turning point, where price reacted strongly from the Buyer Zone. This reaction marked the first sign of demand stepping in and weakening the bearish momentum. Following this reversal, BTC staged a strong impulsive recovery and broke back above the Buyer Zone, signaling a temporary structural shift and attracting renewed bullish interest. After this move, price entered a consolidation phase, forming a clean range where buyers and sellers temporarily found equilibrium. This ranging structure acted as a redistribution zone before the market rotated lower again. The rejection from the upper boundary of the range aligned with the descending resistance line, confirming that sellers were still active within the broader channel context. Currently, BTC is trading below the Seller Zone and remains inside the descending structure, with price recently breaking down from resistance and rotating toward the channel support. This move suggests that the recent bounce was corrective rather than the start of a sustained bullish reversal. Price action shows controlled downside continuation, with the market now approaching the Buyer Zone around 65,000, which also aligns with the lower boundary of the descending channel and a key support area. My primary scenario favors a continuation toward the support region, as long as BTC remains below the Seller Zone and continues respecting the descending resistance line. A clean reaction from the 65,000 Buyer Zone (TP1) could trigger another bounce, as this level represents a confluence of structural support and potential liquidity. On the other hand, a decisive breakdown and acceptance below this Buyer Zone would confirm bearish continuation and open the path toward deeper downside expansion. Until buyers reclaim the Seller Zone and break the descending structure, the broader short-term bias remains cautiously bearish. Please share this idea with your friends and click Boost 🚀
Parallel Channel

GOLD - Consolidation ahead of the news? Will the trend continue?FX:XAUUSD is attempting to recover to $5,000 after a sharp 3.5% drop on Thursday. There are no clear reasons for this. All market attention is focused on today's US inflation report - CPI.
Yesterday's gold sell-off was caused not only by technical factors, but also by capital flight to the dollar amid renewed fears surrounding AI. There was no news driver, the market was overstretched, and the sharp momentum of the dollar triggered sell-offs (liquidations) in the markets.
Despite strong NFP, the market is still pricing in at least two rate cuts this year.
Ahead is CPI — the main trigger: Forecast — Core CPI slowdown to 2.5% y/y. If inflation turns out to be higher than expected, the market will reassess the Fed's plans, which will strengthen the dollar and hit gold.
High volatility is inevitable today.
Resistance levels: 4990, 5100
Support levels: 4944, 4902
Technically, local and global trends are bullish, and any correction could quickly end in growth, especially from strong levels. A breakout of 4990 and maintaining the price above this level could confirm the bullish nature of the market. On news amid high volatility, the market may test the support of the trend and the range of 4878 - 4812.
Negative scenario: a breakout and close below 4800 could trigger a fall to 4700 - 4600.
Best regards, R. Linda!

BITCOIN - Correction against the global bearish trend BINANCE:BTCUSDT.P is recovering from an interim low of 65K. The area of interest is 71,500, but it is too early to talk about a bull market, as the influence of buyers may be short-term within the global downtrend.
The main growth factor that emerged on Thursday/Friday was cooling inflation in the US, reducing pressure on the Fed to keep rates high. This brought investors back to risky assets. Will this influence be long-term?
Global and local trends are downward.
Bitcoin is within a neutral range of 71,500 - 65,700. A countertrend movement is forming after a retest of the local low of 65K. Until the structure is broken, a decline to 68,300 - 65,700 should be expected as a primary reaction to the resistance at 71,500. Liquidity capture and the subsequent formation of a false breakout could trigger a local reversal and decline.
Resistance levels: 71,450, 71,850, 73,100
Support levels: 68,370, 65,700
Within the current trading range, it is worth waiting for a retest of the key zone - the area of interest and liquidity 71450 - 71850. The lack of bullish momentum, a false breakout, and consolidation in the selling zone could lead to a sell-off and a decline in price.
Sincerely, R. Linda!

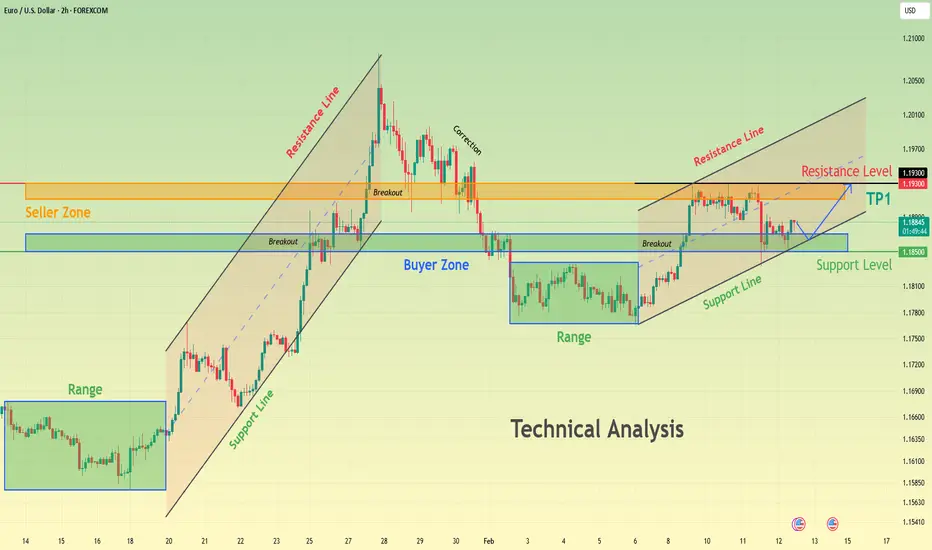
EURUSD Compressing Above Demand - Next Move IncomingHello traders! Here’s my technical outlook on EURUSD (2H) based on the current chart structure. The pair is trading within a broader bullish environment, supported by a clearly defined rising support line that has guided price higher over time. Earlier in the move, EURUSD entered a consolidation phase, forming a clean range where buyers and sellers were temporarily balanced. This range acted as an accumulation zone before a strong impulsive breakout to the upside, confirming buyer dominance and continuation of the bullish trend. Following the breakout, price accelerated aggressively and pushed into the Seller Zone / Resistance area around 1.1930, where selling pressure increased significantly. This led to a corrective pullback, as sellers defended the resistance and price retraced lower. However, the decline found support at the Buyer Zone near 1.1850, which also aligns with the broader support level and rising structure. This reaction signaled that buyers were still active and willing to defend demand, preventing a deeper breakdown and maintaining the overall bullish structure. Currently, EURUSD is consolidating above the Buyer Zone and holding above the key support level, while respecting the rising channel structure. Price action shows compression just above support, suggesting absorption of selling pressure rather than distribution. Multiple breakout attempts from this area indicate that buyers are gradually regaining control, while sellers are struggling to push price decisively below demand. This type of consolidation after a corrective move often precedes another impulsive leg higher. My primary scenario favors bullish continuation, as long as EURUSD holds above the 1.1850 Buyer Zone and continues to respect the ascending support line. A confirmed breakout and acceptance above the current consolidation would open the path toward the 1.1930 Resistance / Seller Zone (TP1), where sellers may attempt to react again. A clean breakout above this resistance would further strengthen the bullish case and signal continuation of the broader uptrend. On the other hand, a decisive breakdown below the Buyer Zone and loss of structural support would invalidate the bullish setup and shift focus toward a deeper corrective phase. For now, structure, trend, and price behavior continue to favor buyers. Please share this idea with your friends and click Boost 🚀
Why Amazon Is a Buy NowWhy Amazon Is a Buy Now
Amazon is currently going through a significant transition period in early 2026.
Although the stock has experienced recent volatility with a drop of nearly 20% so far this year the analyst consensus remains mostly bullish with price targets ranging between $260 and $300.
🪴 Growth Catalysts
AWS Cloud and AI is the primary engine.
AWS has returned to growth rates of 24% year over year surpassing previous quarters driven by the massive migration of Generative Artificial Intelligence workloads.
Digital Advertising is growing above 20% and has much higher margins than retail. Amazon is establishing itself as the third global player behind Google and Meta by monetizing Prime Video in addition to its website.
Proprietary Chips like Trainium and Graviton allow Amazon to reduce its reliance on Nvidia. Its chip business is expected to reach $10 billion soon while offering better costs to cloud customers.
Logistics Efficiency and Robotics through the implementation of AI in warehouses are successfully expanding operating margins in the retail business which is traditionally the tightest.
🐘 The Elephant in the Room 200 Billion Dollar Capex
The major current focus of tension is the announcement of 200 billion dollars in capital expenditure for 2026.
A negative interpretation is that the market fears this massive investment in AI infrastructure will reduce free cash flow in the short term.
A positive interpretation from CEO Andy Jassy is that this spending responds to massive real demand from customers. If Amazon manages to monetize this investment as it did with the original cloud infrastructure the long term profit potential is enormous.
📈 Technical Perspective and Valuation
Right now, in terms of price, Amazon is in a long-term bullish trend but is currently at a fairly low point. In fact, it is very close to the bearish channel.
In the short term, losing the $210 level has sent the price directly to $190. This area could be a very interesting buy for several reasons:
We will be at the bottom of the channel.
We will be right above a high-volume zone .
These were the 2021 highs.
The analyst consensus is at $300 , which means we are talking about a potential upside of more than 50% from this $190 support.
The Stop Loss can be very tight, we shouldn't see the price below $175. If that happens, we would be losing very important supports and even breaking a legendary channel.
Let's see how the price reacts to the $190 zone.
👇 WANT MORE?
🚀 Hit the rocket, read my profile and follow so we can find each other again.

USDJPY - Reversal setup relative to range support FX:USDJPY faces strong support within the correction. The price closed within the trading range of 152.8 - 157.78 and is forming a strong reversal setup relative to the lower boundary.
The dollar is strengthening, which supports the currency pair. The yen is undergoing a correction. Within the range, a rebound from support to 155.65 is possible, and if the bulls hold the specified resistance, the growth may continue to 157.78.
The currency pair is returning to support at 152.8 as part of the sell-off and is testing the level, forming a double bottom, which generally suggests that there is no possibility of continuing the decline against the backdrop of a strong dollar.
Resistance levels: 155.65, 157.78, 159.45
Support levels: 152.83
The false breakout of support indicates that the bulls are trying to maintain their positions and are not letting the price fall, which also confirms the formation of a double bottom. If the bulls keep the price above 153.0, this move could support the price growth.
Best regards, R. Linda!

The Great 2026 Shakeout: $60k Support or $50k Capitulation?1. Technical Analysis: The 4H Blueprint
As shown in the attached chart, Bitcoin is currently navigating a high-stakes "correction phase" within a textbook Descending Channel.
Resistance Confluence: BTC is currently testing the upper boundary of the channel. This level is reinforced by the Weekly Pivot Zone (orange box) and the heavy Monthly Resistance at $70,204. Until we see a decisive 4H candle close above $71,000 with surging volume, the local trend remains firmly bearish.
The Horizontal Pivot: We are currently hovering around the $65,000–$66,000 range. This is the "no-man's land" where bulls and bears are battling for control.
Support Floors: The ultimate "Line in the Sand" sits at the Monthly CPR Support ($61,767) and the psychological $60,000 floor. A breach here would likely trigger a liquidation cascade, as it marks the last major defense before the channel's lower extension.
2. Market Sentiment & Global Situation
The macro-environment has turned frosty, and the "Extreme Fear" on-chain is palpable.
The "Warsh" Factor: The recent nomination of Kevin Warsh as the next Fed Chair (set to replace Powell in May) has sent shockwaves through risk assets. The market anticipates a "Hawkish Pivot" focused on shrinking the Fed's balance sheet, which is currently draining liquidity from the crypto ecosystem.
Extreme Fear & Realized Losses: The Fear & Greed Index has plummeted to 9/100, the lowest since the 2022 collapse. Data shows nearly $2.3 billion in realized losses this week alone, suggesting we are in a major capitulation phase.
The ETF "Tourist" Exit: With the average entry price for Spot ETF holders sitting near $90,000, a significant portion of institutional "tourists" are now underwater. We are seeing sustained net outflows as these players de-risk in the face of global uncertainty.
Standard Chartered Warning: Leading analysts have slashed their 2026 targets, with some warning that Bitcoin could drop to $50,000 (a 50% retracement from the 2025 highs) before finding a structural bottom.
3. Conclusion: The Two Scenarios
Scenario A (The Bounce): If BTC can reclaim the $70,204 resistance and break the descending channel, it would invalidate the bearish thesis and likely lead to a short-squeeze back toward $80k.
Scenario B (The Flush): Failure to hold the $60,000–$61,700 support will likely result in a "capitulation wick" down to $50,000–$52,000. This would be the final "cleansing" of the market before a late-2026 recovery.
The verdict: Patience is key. Watch the $60k level like a hawk—it is the only thing standing between us and a deeper correction.
CAUTION: This analysis is for educational purposes only. Trading cryptocurrencies involves high risk. Please conduct your own assessment and trade only with capital you are prepared to lose. Market conditions in 2026 remain highly volatile.

BTCUSDT Compression Below Resistance Signals Expansion To 71,800Hello traders! Here’s my technical outlook on BTCUSDT (4H) based on the current chart structure. Bitcoin previously traded within a well-defined range, where price respected both the upper and lower boundaries for an extended period. This consolidation phase reflected balance between buyers and sellers, with multiple reactions from range highs and lows. Eventually, price broke down from the range, signaling a loss of bullish control and the start of a corrective bearish phase. Following the range breakdown, BTC entered a descending channel, characterized by lower highs and lower lows. Price respected the falling resistance line, confirming sustained selling pressure and controlled downside continuation rather than a volatile sell-off. During this move, several corrective bounces were capped by the descending resistance, reinforcing the bearish structure. Currently, BTCUSDT is consolidating above the Buyer Zone, while also attempting to break and hold above a newly formed ascending support line. This behavior suggests that selling pressure is weakening and buyers are gradually gaining control. The recent breakout attempts from minor resistance indicate early bullish intent, although price is still capped below the key Seller Zone / Resistance near 71,800. My primary scenario favors a move higher toward the 71,800 resistance level (TP1), which aligns with the Seller Zone and previous breakdown area. A clean breakout and acceptance above this resistance would confirm a deeper recovery and potentially signal a trend shift. However, a strong rejection from the Seller Zone could lead to another pullback toward the Buyer Zone. A decisive breakdown below the 68,000 support and loss of the ascending support line would invalidate the bullish recovery scenario and open the door for renewed downside continuation. For now, BTCUSDT shows signs of stabilization after a strong drop, with buyers defending demand and price compressing below resistance — a classic setup for a potential breakout move. Please share this idea with your friends and click Boost 🚀

EURUSD: Market Structure Flip Signals Upside Potential To 1.1970Hello everyone, here is my breakdown of the current EURUSD setup.
Market Analysis
EURUSD was previously trading within a clearly defined downward channel, marked by consistent lower highs and lower lows. This structure reflected controlled bearish pressure, where sellers maintained dominance but price action remained technical and orderly. Each corrective rally toward the upper boundary of the channel was met with selling interest, confirming the validity of the bearish trend and the strength of supply at higher levels. As price approached the lower boundary of the descending channel, downside momentum began to weaken. Sellers struggled to extend the move lower, and EURUSD started forming a base. This loss of bearish strength ultimately resulted in a decisive breakout above the downward channel, signaling a potential trend shift rather than a simple correction.
Currently, price broke out of the consolidation range to the upside and held above the reclaimed support, reinforcing bullish intent. The market is now trading above a rising trend line, with higher lows forming, indicating that buyers are gradually gaining control. Overall, EURUSD is transitioning from a bearish structure into a bullish continuation phase, supported by strong structural reclaim and healthy consolidation.
My Scenario & Strategy
My primary scenario favors bullish continuation, as long as EURUSD holds above the key Support Zone and continues to respect the rising trend line. The successful breakout from the downward channel, followed by consolidation and another upside breakout, suggests that the prior bearish move has been exhausted and that sellers are losing control. From a structural perspective, the inability of price to break back below support confirms that recent pullbacks are corrective rather than impulsive. As long as price remains above support, dips are viewed as potential continuation setups within a developing uptrend. The next key upside objective is the Resistance Zone around 1.1970, which aligns with previous resistance and a major supply area. This level represents a logical TP1, where partial profits can be considered and where sellers may attempt to defend the level. A clean breakout and acceptance above this resistance would confirm further bullish expansion and open the door for higher targets.
However, if EURUSD fails to hold above the support zone and breaks decisively below the rising trend line, the bullish scenario would be invalidated, and the market could rotate back into a deeper correction or range. Until such a breakdown occurs, the overall bias remains bullish, with structure favoring continuation to the upside.
That’s the setup I’m tracking. Thank you for your attention, and always manage your risk.

U.S. Dollar Index (DXY) – 1H Technical AnalysisU.S. Dollar Index (DXY) – 1H Technical Analysis
Timeframe: 1-Hour Chart
1. Market Structure Overview
The DXY is currently trading around 96.83, following a clear rejection from major higher-timeframe resistance near 97.80–98.00. Price has transitioned from a bullish structure into a short-term bearish phase after:
A double rejection at the main resistance zone
A confirmed breakout failure above prior resistance (~97.20)
A subsequent Change of Character (CHoCH) signaling momentum shift
The broader structure shows distribution at highs and a controlled decline toward key support.
2. Key Technical Zones
🔵 Main Resistance: 97.75 – 98.00
Strong supply zone
Multiple rejections (circled areas)
Likely institutional distribution
Remains valid until clean breakout and sustained acceptance above
🔵 Intermediate Resistance: ~97.20
Prior breakout level turned resistance
Clean rejection after retest
Now acting as short-term upside target
🟢 Main Support: 96.30 – 96.50
Higher-timeframe demand zone
Recent bullish reaction (long lower wick + impulse bounce)
Currently defending downside
3. Smart Money Concepts (SMC) Perspective
FVG (Fair Value Gap) formed during previous bullish leg — later mitigated.
Break of Structure (BOS) occurred to the downside after resistance rejection.
CHoCH confirms short-term bullish attempt after support reaction.
Liquidity likely rests:
Below 96.30 (sell-side liquidity)
Above 97.20 (buy-side liquidity)
Market appears to be in a range compression phase between 96.40 and 97.20 before expansion.
4. Current Price Behavior
Price is consolidating above main support after a sharp rebound. The structure suggests:
Short-term accumulation near support
Potential liquidity sweep toward 96.40 before expansion
Compression pattern often precedes impulsive move
Momentum is neutral-to-slightly bullish on lower timeframe after support defense.
5. Trading Scenarios
🟢 Bullish Scenario (Preferred While Above 96.30)
Potential dip into 96.40–96.50 (liquidity grab)
Bullish confirmation on lower timeframe
Target 1: 97.00
Target 2: 97.20 (range high / resistance)
Extended target: 97.75 (main resistance)
Invalidation: Sustained break and close below 96.30.
🔴 Bearish Scenario
If 96.30 breaks decisively:
Liquidity flush toward 96.00–95.80
Continuation of short-term bearish structure
Broader correction within higher timeframe distribution
6. Conclusion
The DXY is trading inside a defined range between 96.30 (support) and 97.20 (resistance) after rejecting major higher-timeframe supply at 98.00.
Current structure favors a short-term bullish retracement toward 97.20, provided support continues to hold. However, the broader context still reflects distribution near major resistance, meaning upside may remain corrective unless 97.75–98.00 is reclaimed.
Disclaimer
This analysis is provided for educational purposes only and does not constitute financial, investment, or trading advice. The information presented is based on technical analysis and market structure interpretation at the time of writing. Financial markets involve risk, and past performance is not indicative of future results. Always conduct your own research and consult with a licensed financial advisor before making any trading or investment decisions.

Larsen & Toubro: Two Hanging Men at ATH — Reversal Ahead?Price is currently facing resistance near 4195, which marks the recent high.
Two hanging man candles have formed at this level, indicating selling pressure at the top. However, a hanging man needs proper bearish confirmation to signal a reversal.
Equal highs are visible here. Is a potential double top forming? Possibly — but there is no confirmation yet.
As long as price holds above the short-term support zone around 4080–4100, the structure remains stable within the rising channel.
For now, this is a resistance reaction — not a confirmed breakdown.
Let the market confirm before taking a directional view.
Disclaimer: This analysis is for educational purposes only and does not constitute investment advice. Please do your own research (DYOR) before making any trading decisions.

GBPCAD - Small Bearish Move Impulsive break of an ascending channel leading to a potetntial double top.

IREN going to fallIREN started moving in a bearish triangle, with a stoploss of 48, I think IREN might be hitting 15 area. With some intermediate TPs at 37, and 33.

IONQ MOVING IN ASCENDING CHANNELAscending channel can be seen clearly. Currently price is at the channel bottom with very good support at 45.
it also made a high at , and pulled back to low of 45
Either buy at CMP 48 and average at 45. I expect it to stay above 45, and hit 55 again, next 65 and 75 would the targets.

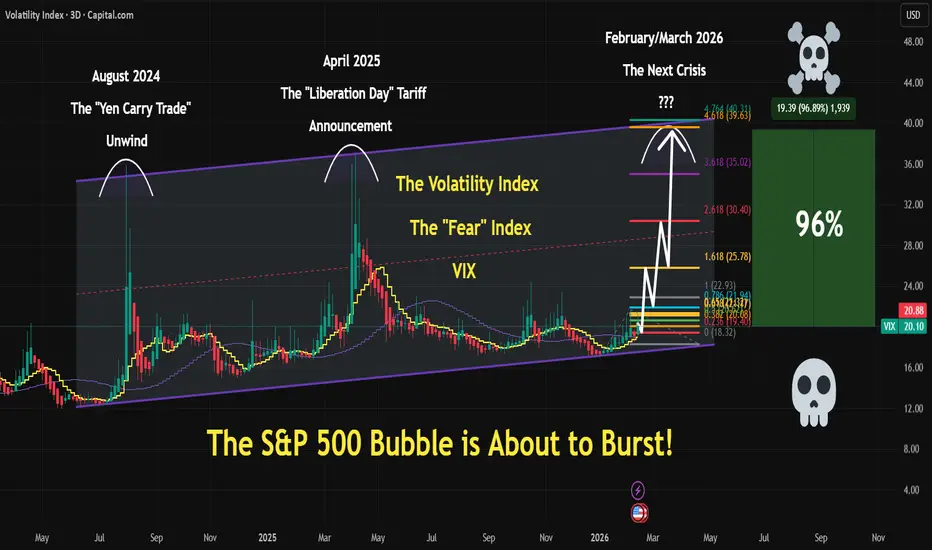
VIX | S&P500 Is About To TANK | LONG VIX | SHORT SPYSince we are currently in mid-February 2026, the specific "crisis" label is still being debated by historians and market analysts, but several distinct names have already emerged in the headlines. Depending on whether you're following the diplomatic friction, the domestic policy shifts, or the literal weather, it is being referred to in a few different ways:
1. The "Greenland Gaffe" (or the "Arctic Stand-off")
This is currently the most popular name in global news. It refers to the massive spike in market volatility following the U.S. administration's statements regarding the purchase of Greenland. This sparked an immediate diplomatic rift with NATO allies, leading to a series of retaliatory tariffs that caused the S&P 500’s sharpest one-day drop since October 2025.
2. The "Warsh Wobble"
In financial circles, especially among traders like yourself, this period is often called the "Warsh Wobble." The announcement on January 30 of Kevin Warsh as the nominee to succeed Jerome Powell as Fed Chair in May 2026 sent shockwaves through the gold and silver markets. The transition uncertainty, combined with his historical reputation as a "hawk," caused a massive reversal in precious metals—with Gold plunging 10% in a single day (January 30).
+1
3. The "Frozen Shutdown"
This name is being used to describe the convergence of two domestic issues:
The Partial Government Shutdown: Washington entered February with a funding lapse that has stalled several federal agencies.
The Energy Spike: Record-breaking severe winter weather across the Southern and Eastern U.S. has caused natural gas and electricity prices to skyrocket. The "crisis" here is the strain on households already dealing with a shutdown and persistent inflation.
4. The "AI Reality Check"
Some tech analysts are calling the current volatility the "AI Reality Check" or the "SaaS Earthquake." The rollout of new AI productivity tools has started disrupting "legacy" Software-as-a-Service firms en masse. This has created a massive rotation out of former tech darlings and into small-cap stocks (the Russell 2000), which outperformed the S&P 500 for 14 straight days in early February.
BTC - Ascending Channel at Critical Decision Zone | $72K Squeeze
What's up traders! 🔥
Bitcoin is at a crossroads right now. Let me walk you through what's happening on the 1-hour chart.
The Setup
BTCUSDT is trading at $68,847 inside a well-defined ascending channel, sitting right between two critical zones. We've got yellow support/resistance zones that have been respected multiple times, and price is currently consolidating in the middle - classic indecision.
The big question: continuation or reversal?
Why This Setup is Critical
Ascending channel intact - higher lows still forming
Price consolidating between support ($60K-61K) and resistance ($69K-$71K)
Retail is accumulating - small wallets buying the dip
Whales are distributing - large holders selling into strength
Short squeeze potential to $72K-$80K if we break resistance
But analysts warning of $50K-$55K bottom if support fails
The News is MIXED (This is Key)
Bearish signals:
CryptoQuant CEO: "Bottom likely $55K" - historical cycle analysis
Standard Chartered slashed target from $200K to $50K
Weak ETF demand - only $13.6M inflows (down 99% from peak)
Whale selling - large holders distributing to retail
Realized price at $55K = historical bottom zone
Funding rates negative = bearish sentiment
Bullish signals:
Retail accumulation at 3-month highs - small wallets loading
Short interest stacked at $64K-$72K = squeeze fuel
V-shaped recovery pattern forming on higher timeframes
Potential short squeeze to $72K-$80K if resistance breaks
Historical bottom zones ($50K-$55K) = strong support if we drop
Ascending channel still intact - trend is your friend
Key Levels I'm Watching
Resistance:
$64,000-$65,000 - Upper yellow zone / channel resistance
$68,000 - Psychological level
$72,000-$80,000 - Short squeeze target zone
$85,000 - Major resistance if bulls take control
Support:
$62,000 - Current consolidation
$60,000-$61,000 - Lower yellow zone / channel support (CRITICAL)
$58,000 - Psychological support
$55,000 - CryptoQuant bottom target / realized price
$50,000 - Standard Chartered target / major support
My Game Plan
Bullish scenario: If BTC holds the $60K-$61K support zone and breaks above $68-70K with volume, we could see a rapid squeeze to $72K-$80K. The ascending channel is still intact, retail is accumulating, and shorts are stacked above = perfect squeeze setup. A clean break above $68K confirms the move.
Bearish scenario: If we lose $62K-$65K support, next stop is $58K, then the big one - $55K (CryptoQuant target). Break below $55K opens the door to $50K (Standard Chartered target). Whale distribution + weak ETF flows + negative funding = recipe for downside.
Neutral/Range scenario: Most likely short-term - we chop between $60K-$65K until a catalyst forces a breakout. Watch for volume spikes and funding rate changes.
The Bottom Line
I'm cautiously neutral with a slight bullish lean IF we hold $66K-$68K. The ascending channel is still valid, retail is buying, and there's massive short interest above us. BUT the macro picture is concerning - whales selling, ETF flows weak, analysts calling for $50K-$55K.
This is a "wait and see" setup. Let the market show its hand. If $66K-$68K holds = look for longs. If it breaks = step aside or short to $55K.
The $65K-$69K zone is the line in the sand. Watch it closely.
What's your take? Are we squeezing to $72K or dumping to $55K? Drop your thoughts! 👇
If this breakdown helped, smash that 🚀 Boost button!
Not financial advice. Trade at your own risk.

Novo 1h AB=CD to gap closeNovo keeps making succesful ab=cd's at the moment. Smaller ones turning into partt of bigger etc. Right now an even bigger one would take it to a possible channel low, a "failed turning point" and gap close. I'm definitely watching this closely!

Disney at Range SupportDIS is trading inside a well-defined horizontal range on the daily timeframe.
Key levels:
• Range High: ~124–125
• Range Low: ~80–82
• Mid-range equilibrium: ~103–104
Price is currently sitting near the mid-range level (~102–104), which often acts as a decision zone.
The broader structure shows repeated rejections from the range high and strong bounces from the range low. Now the market is again at a critical pivot area.
🟢 Bullish Scenario
• Strong reclaim and daily close above 104
• Holding above mid-range level
• Upside targets:
• 110
• 118
• 124 (range high)
Would signal rotation back toward upper range.
✅ Long Stop Loss:
• Below 100
• Conservative SL: below 98
🔴 Bearish Scenario
• Daily close below 100
• Loss of mid-range support
• Downside targets:
• 95
• 90
• 82 (range low)
Breakdown would shift momentum toward lower range boundary.
✅ Short Stop Loss:
• Above 105
• Conservative SL: above 108
⚠ Trading Notes (English)
• Mid-range entries offer moderate R/R — extremes offer better setups
• False breaks common inside wide ranges
• Watch reaction near 100 closely

Breakout and Retest2230 broken out of consolidation channel, above 8.0 with strong moment on weekly TF, it is now testing the breakout near 8.
Good to buy near 8, SL 7.9 on daily closing. Target 8.7, 9.7

ADAUSDT - Short squeeze before falling to 0.22BINANCE:ADAUSDT , after breaking through the global support zone of 0.275 and updating its lows to 0.22, entered a phase of correction and consolidation below key levels. Another short squeeze could trigger a decline.
Bitcoin is falling after a correction, which generally indicates a weak market and increases bearish pressure on the market. I recently said that Bitcoin would fall even lower, as global targets have not yet been achieved, so against this backdrop, altcoins may react accordingly.
Any corrections and volume spikes can be seen as a hunt for liquidity and quickly sold off.
ADA has been strengthening since the session opened and is showing strength against a weak market (top gainers). There are no fundamental reasons for growth, and technically, the market is heading towards a zone of interest.
Resistance levels: 0.2688, 0.276, 0.284
Support levels: 0.243, 0.2200
From a medium-term perspective, the altcoin has not yet tested the global support level hidden behind 0.22 - 0.2167, formed in 2023. A retest and short squeeze of the resistance zone could trigger a decline towards the target
Best regards, R. Linda!

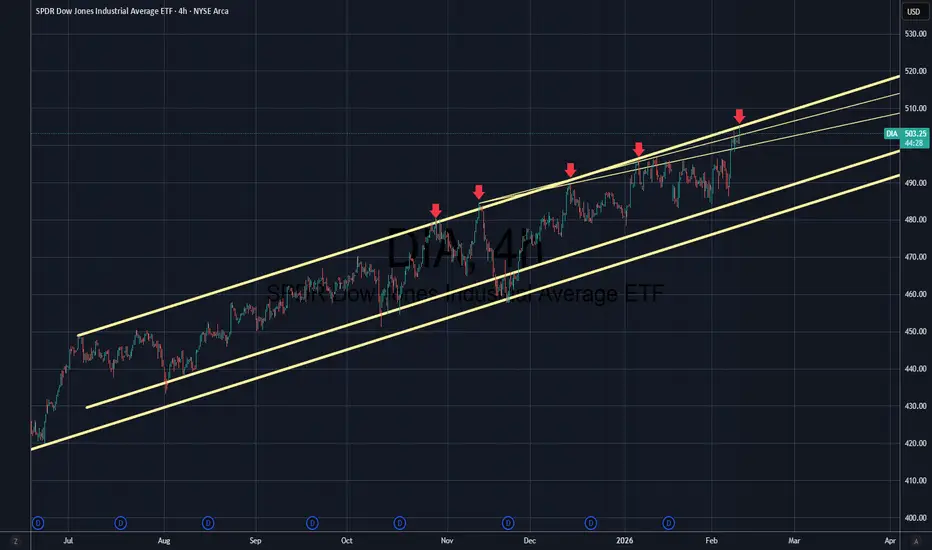
My Thesis is Caution is Warranted if Chasing DIA HereChannel resistance retest? Pullback coming (likely) AMEX:DIA
To 700 or Not To 700? OBV Might Be The ClueEdit: Sorry for the jank chart on the front of this idea, I didn't realize the view I had when I published this idea would be the main one for this idea. Anyway...
I ran upon an indicator new to me, and just thought I'd manifest my observations and thoughts on this interesting indicator. Here's what Google AI has to say about it:
The On-Balance Volume (OBV) indicator is a momentum tool that measures buying and selling pressure by adding volume on up days and subtracting it on down days. It is used to confirm trends when OBV moves with price, or to signal potential trend reversals (divergences) when OBV moves in the opposite direction.
+How to Use the OBV Indicator:
-Trend Confirmation: When both price and the OBV line are making higher peaks and higher troughs, a bullish trend is likely to continue. Conversely, lower peaks and lower troughs in both indicate a bearish trend is likely to continue.
-Identify Divergences (Reversals): A bullish reversal signal occurs when the price makes a lower low, but the OBV line makes a higher low, suggesting buying pressure is building despite price drops. A bearish reversal signal occurs when the price hits a higher high, but the OBV line hits a lower high, indicating selling pressure.
-Identify Accumulation/Distribution: During a flat, sideways trading range, a rising OBV indicates accumulation (smart money buying), while a falling OBV indicates distribution (selling).
So we all see the consolidation that has been going on with AMEX:SPY since October. Won't go up, but also won't go down...
So here's a throwback to the infamous bear market of 2022. As you can see, the OBV indicator fails to make new highs while the underlying AMEX:SPY not only retests ATHs but makes new ATHs.
And now, in what looks like our consolidation, we can see that the lack of new highs is shadowed by the AMEX:SPY also making new ATHs and retesting previous ATHs.
Additionally, we see that AMEX:SPY is bordering the upper trendline of a long-term bullish channel.
Counter theses to this idea is that NASDAQ:NVDA does NOT behave like its magnificent 7 brethren and instead edges higher or explodes after its earnings report comes out. Another counter would be a surprise jobs number or inflation data point that points to rate cuts, however as we have seen today (2/11/26) a really good job data point resulted in a slightly down AMEX:SPY as good news basically confirms a "higher for longer" fed rate. Unless we get a hot inflation print or horrible job numbers, an NASDAQ:NVDA sell the news reaction could result in a drastic decline in AMEX:SPY soon.
I would assume that a far down AMEX:SPY strike would outweigh the risk of a "day-one" scenario after NASDAQ:NVDA earnings. I'm no data center guru but I could see how RAM price surging in the last year could affect the bottom-line of data center / AI farm users who purchase NASDAQ:NVDA GPUs, and a hurting bottom-line for them could result in reduced sales in GPUs.
**This is not financial advice**
Also, this is the first idea I have written and published.

XAUUSD GOLD Analysis on (12 Feb 2026)#XAUUSD UPDATEDE
Current price - 5063 (Sell Limited -5070,5080)
If price stay below 5130, then next target 4975,4800 and above that 5200
Plan;If price break 5070-5080 area,and stay below 5060,we will place sell order in gold with target of 4975 and 4800 & stop loss should be placed at 5130
