Usdchf long?This count is based on my assumptions so anything can happen not a trading or financial advice just for educational purposes only kindly do your own ta thanks trade with care good luck.
Parallel Channel

DXY [US$ INDEX] EWP TC FIB ANALYSIS MONTHLY TFDXY – Monthly Macro Structure
The U.S. Dollar Index continues to trade within a long-term descending macro channel originating from the 1985 Plaza Accord high. The 2001 and 2022 peaks both align precisely with this falling resistance, confirming a multi-decade pattern of lower highs.
The advance since the 2008 low appears corrective, forming a large W–X–Y structure rather than a five-wave impulse. The current recovery phase represents the final wave Y, now approaching confluence between declining channel resistance, horizontal supply, and Fibonacci retracement levels.
Momentum supports this interpretation. Monthly RSI shows clear bearish divergence relative to the 2022 high, indicating structural exhaustion rather than trend continuation.
If wave Y completes within this resistance zone, a decisive breakdown below the corrective structure would signal the end of the entire post-GFC dollar rally. Long-term technical projections point toward the 58 region, aligning with historical support and lower-channel targets.
From a macro perspective, current strength remains corrective until proven otherwise.
Like and follow for more charts like this.

GOLD - Waiting for a pullback to enter a long position...FX:XAUUSD continued its record growth for the sixth consecutive day, reaching $5,110. The driving forces behind this are geopolitical uncertainty, expectations of a softening of Fed policy, active purchases by central banks, and an outflow from the dollar...
Fundamental drivers
Geopolitics: Russia-Ukraine, Trump's threats of 100% tariffs on Canada, and the risks of further escalation with the EU...
The dollar fell to its lowest level since September 2025 due to interventions by the Bank of Japan and expectations of interest rate cuts. At the same time, central banks in many countries continue to show high interest in the metal.
The Fed's interest rate meeting is coming up (January 31 - February 1). The tone of the regulator is important; there are doubts about further rate cuts, and if this is confirmed, the market may enter a correction...
Resistance levels: 5110, 5150
Support levels: 5080, 5055, 5031
Technically, it is quite risky to open long trades from the current price position (in the 5090 zone). I recommend waiting for a correction to the specified support zones to find more profitable and safer entry points!
Best regards,

BAJAJ CONSUMER Buy This price broke out after 6 years..from a parallel pattern...tgt calculated as per pattern is 60% in 3 years...approximately...Note volumes also support this move..So buy

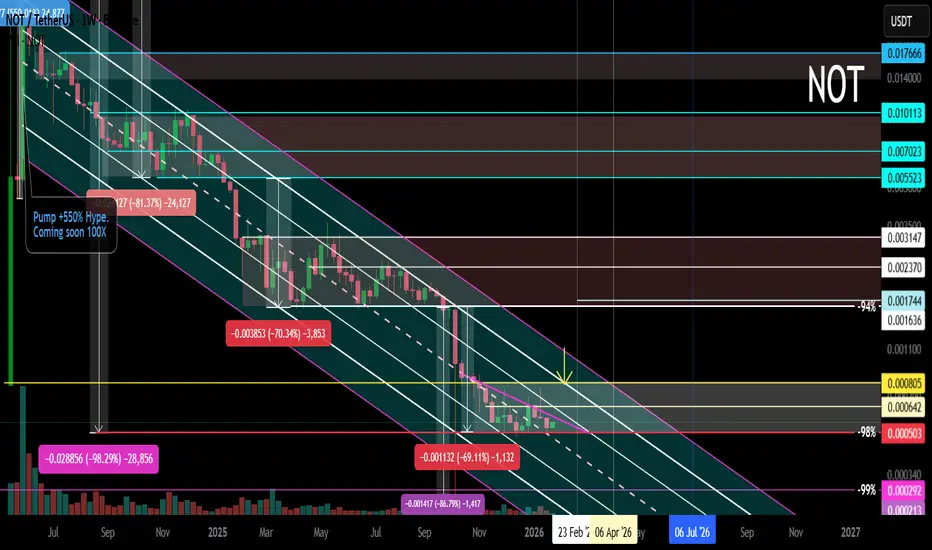
NOT Main Trend. Descending Channel -98% 01/27/2026Logarithm. Time frame: 1 week.
The price is in the main trend and remains in a downward channel with a given volatility range.
It's important to understand that the creators of this cryptocurrency always sell at any price (they're created for profit, fueled by hype). However, at low prices (-94-99%), a dilemma arises:
1️⃣ invent a reason for a scam and abandon the project;
2️⃣ or reverse the trend and temporarily restore faith in this scam cryptocurrency. In order to continue sales.
You can use this and profit from it. But, in the long term, you should be cautious with such assets. This applies to absolutely all cryptocurrencies created for hype and without any real future use. When trading such a dying former super-hype, manage your risks. This is the basic principle. If you can't do this, avoid it.
NOT Local trend. Sideways. -98%. Reversal zones 27 01 26
JPM – JPMorgan Chase (Daily)JPM is trading inside a well-defined ascending channel after a strong bullish rally.
Price has now pulled back sharply and is currently testing the lower boundary of the channel, making this a critical decision zone.
Technical Structure
• Primary trend: Bullish (as long as channel support holds)
• Pattern: Ascending Channel
• Moving Average: Price slightly below MA → short-term bearish pressure
Key Levels
• Major Support:
295 – 298 (Channel bottom)
• Next Supports if broken:
285 → 275
• Resistances:
315 → 325 → 335
Bullish Scenario (Primary)
If:
• Price holds above 295–298
• Reclaims the channel structure
➡️ This move would be considered a healthy pullback within an uptrend.
Upside Targets:
315 → 325 → Upper channel (~335)
Bearish Scenario (Alternative)
If:
• Daily close below the channel support
➡️ Bullish structure weakens and deeper correction becomes likely.
Downside Targets:
285 → 275
Final Takeaway
JPM is at make-or-break support.
Holding the channel keeps the bullish trend alive; losing it opens the door to a deeper correction.

XAUUSD Long: Bullish Trend Intact Below the $5,000 Supply ZoneHello traders! Here’s a clear technical breakdown of XAUUSD (1H) based on the current chart structure. Gold is trading within a well-defined bullish trend, supported by a clean ascending channel that has guided price higher from the lower levels. Earlier in the move, XAUUSD respected the lower boundary of the channel and formed a sequence of higher highs and higher lows, confirming sustained buyer control. During this advance, price entered a consolidation range, signaling temporary balance and accumulation before continuation. This range eventually resolved to the upside, triggering a strong impulsive breakout and accelerating bullish momentum. After the breakout, Gold pushed higher within the ascending channel and approached a major Supply Zone near the psychological 5,000 level. At this area, price showed hesitation and formed a fake breakout above resistance, indicating that sellers were active near the highs. Following this rejection, XAUUSD pulled back toward the mid-lower area of the channel, where previous resistance has now turned into a Demand Zone around 4,870. This zone aligns with channel support and a key structural level, making it an important area for buyer reaction. The recent dip into demand appears corrective rather than impulsive, suggesting a pause within the broader uptrend.
Currently, XAUUSD is trading above the demand zone and remains inside the ascending channel, with buyers defending structure. The market is compressing after the pullback, which often precedes continuation in trending conditions.
My scenario: as long as Gold holds above the 4,870 demand zone and continues to respect the ascending channel, the bullish bias remains intact. A renewed push higher could lead to another test of the 5,000 Supply Zone (TP1). A clean breakout and acceptance above this level would confirm trend continuation and open the door for further upside expansion. However, failure to hold demand and a breakdown below channel support would weaken the bullish setup and signal a deeper corrective phase. For now, structure and momentum continue to favor buyers. Manage your risk!

BTCUSDT: Buyers Defend 88,500 Support, Targeting 90,600 RetestHello everyone, here is my breakdown of the current BTCUSDT setup.
Market Analysis
BTCUSDT is trading within a broader corrective-to-recovery phase after a strong impulsive move earlier. On the left side of the chart, price was capped by a descending triangle resistance line, where multiple breakout attempts occurred, including fake breakouts, before buyers finally gained momentum. This breakout led to a sharp bullish impulse, pushing price into a clearly defined range zone between approximately 94,000 and 98,000, where the market transitioned into consolidation. After spending time ranging, BTC failed to hold the lower boundary of the range, resulting in a strong bearish breakdown and acceleration to the downside. This impulsive sell-off brought price into a key Support Zone around 88,500–88,800, where selling pressure weakened significantly. Buyers stepped in aggressively from this demand area, leading to a sharp rebound and the formation of a new ascending channel, signaling the start of a short-term bullish recovery structure.
Currently, price is respecting the upward channel, forming higher lows and showing gradual bullish pressure. BTC is consolidating just below the Resistance Zone around 90,600, which previously acted as a key level and is now being tested again. Price action near this level suggests compression and potential buildup rather than strong rejection, indicating that buyers are attempting to regain control.
My Scenario & Strategy
My primary scenario remains bullish as long as BTCUSDT holds above the 88,500–88,800 support zone and continues to respect the lower boundary of the ascending channel. A confirmed breakout and acceptance above the 90,600 resistance would validate continuation and open the path toward higher targets within the recovery structure.
However, if price breaks above resistance with momentum, continuation toward the next resistance levels becomes likely. However, if BTC fails to break higher and loses the ascending channel support, a pullback toward the support zone could occur for another potential reaction. A decisive breakdown below the support zone would invalidate the bullish recovery scenario and suggest a deeper continuation of the corrective move. For now, structure favors buyers while support and the ascending channel remain intact.
That's the setup I'm tracking. Thank you for your attention, and always manage your risk.

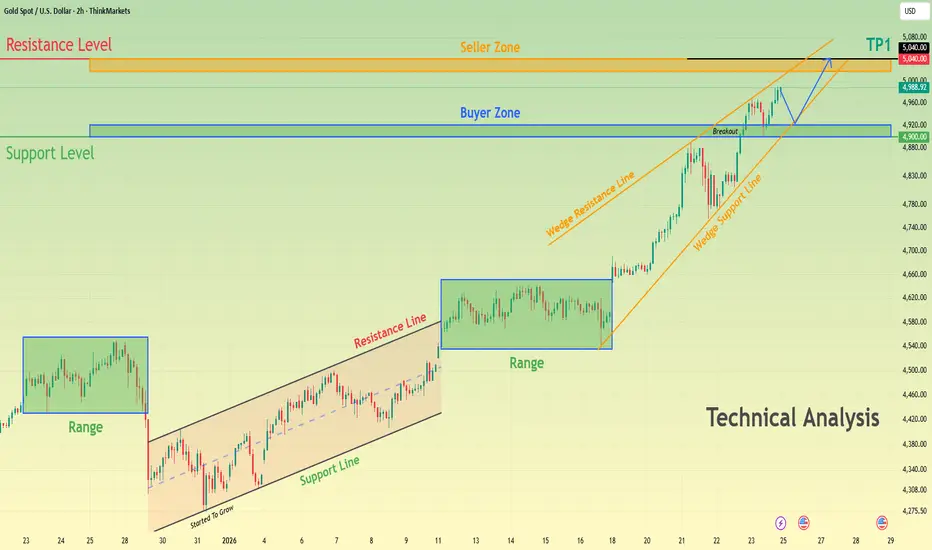
XAUUSD Bullish Structure Intact - $5,040 AheadHello traders! Here’s my technical outlook on XAUUSD (2H) based on the current chart structure. Gold continues to trade within a broader bullish context, maintaining a sequence of higher highs and higher lows. Earlier in the move, price spent a significant amount of time consolidating inside multiple range structures, indicating accumulation before continuation. After breaking out of the most recent range, XAUUSD accelerated higher and respected a rising trend structure, confirming sustained buyer control. This bullish impulse transitioned into a rising wedge formation, where price continued to climb while compressing between the wedge support and resistance lines. During this phase, pullbacks remained corrective, and buyers consistently defended higher support levels. Recently, Gold broke above the key Buyer Zone around the 4,900 level, confirming a successful breakout and acceptance above previous structure. This level has now flipped into support and aligns with the broader Support Level marked on the chart. Price is currently consolidating above this zone while respecting the wedge support line, suggesting continuation rather than exhaustion. Above the market, a well-defined Seller Zone and Resistance Level near 5,040–5,050 stands as the next major obstacle, where profit-taking or selling pressure may emerge. My scenario: as long as XAUUSD holds above the 4,900 Buyer Zone and continues to respect the rising wedge support, the bullish bias remains intact. I expect buyers to maintain control and attempt a continuation toward the 5,040 resistance area (TP1). A clean breakout and acceptance above this Seller Zone would confirm further upside continuation and open the door to new highs. However, a clear rejection from resistance could lead to a short-term pullback toward the Buyer Zone before the next directional move. A decisive breakdown below support would weaken the bullish structure and signal a deeper corrective phase. For now, market structure and momentum continue to favor buyers. Please share this idea with your friends and click Boost 🚀
GOLD - Test $5000... Will the rally continue?FX:XAUUSD closes Friday's session with a new record and consolidation after the rally. Focus on 4988 - 4968. The session closed quite favorably for continued growth, everything depends on Asian traders...
Fundamentals:
The tense situation between Trump and the EU over Greenland and tariffs is still present. The Bank of Japan intervened (which strengthened the yen), triggering a fall in the dollar, which in turn is affecting the price of gold. Overall, the market remains aggressively bullish.
New session:
- Fed meeting (January 31) – focus on Powell's tone. Softening rhetoric on inflation could weaken the dollar and support gold.
- Selection of a new Fed chair (announcement possible by the end of January) – candidates Waller or Warsh are perceived as more “dovish,” which could put pressure on the dollar.
- Geopolitics – any escalation with Iran will trigger a new influx into gold
Resistance levels: 4988, 5000, 5024
Support levels: 4967, 4958, 4945
Gold maintains its upward momentum, driven by a weak dollar and geopolitical risks. Any correction is likely to be limited.
Asian traders may buy up all the supply. A breakout and close above 4988 could trigger a continuation of the rally to 5025-5050. However, it is possible that the market may test support at 4958-4945 before rallying...
Best regards, R. Linda!

LTCUSDT - Hunting for liquidity before the fallBINANCE:LTCUSDT is consolidating below 70.0 before a possible continuation of the decline. The global trend is downward, liquidity is low...
After a sharp decline, the coin entered a consolidation phase, during which a cascade of support is observed, which may falsely indicate the presence of a buyer. The goal of such a maneuver may be to capture liquidity at 69.70 before falling to 65.0
Within the context of a downtrend and low liquidity, MM may form a retest of the 69.3-69.7 zone (liquidity area) to continue consolidation and further decline to 67-65.
Resistance levels: 69.30, 69.70
Support levels: 67.0, 65.3
A retest of the resistance and liquidity zone and the absence of bullish momentum may form a false breakout of the upper boundary of consolidation, which in turn may provoke a continuation of the decline towards both local targets and the global bottom...
Best regards, R. Linda!

BTCUSDT - The battle for 90K may end in a decline BINANCE:BTCUSDT , against the backdrop of Trump's speech and various comments, caused a shake-up within the range of 87,800-90,300, but the price is consolidating below key resistance within the current downtrend...
The downtrend may continue if Bitcoin consolidates below 90K. There is a chance of this happening as there is still no fundamental support for the market. Everyone is talking about the "CLARITY Act" on cryptocurrencies, but there is no date for its signing, and there are rumors that the process may be postponed until late winter or mid-spring, leaving the market without a bullish driver.
The market is experiencing a phase of struggle for the 90K resistance zone. Bears are stubbornly resisting, forming a false breakout and consolidation below resistance. The structure could be broken if there is an impulsive breakout of the 90,500 zone and the bulls are able to keep the price above this zone, but the bears have formed a fairly strong resistance zone.
Resistance levels: 90,400, 91,400
Support levels: 87800, 85000
I do not rule out another attempt to retest the 90350 zone, but if the bears keep the price below 90K, the market will have no chance for growth. In this case, a pullback to 89K - 88K can be considered.
Best regards, R. Linda!

Silver Miners Still Cheap!Silver Miners vs Silver chart (parallel channel)
The more the price of silver goes up, the more profit silver miners stand to make.

$POL breaks long downtrend, rallies 83%, pullback now in focus.2026 has started strong for BINANCE:POLUSDT , with price finally breaking its long-term bearish channel that had been in place since early November 2025. The confirmed breakout occurred on January 1, marking a clear shift in market structure.
Following the breakout, BINANCE:POLUSDT printed 9 consecutive daily bullish candles, delivering an ~83% rally backed by ~$950M in volume during the first week of 2026. This was not a random pump—the move was supported by strong fundamentals, including the Open Money Stack launch (focused on stablecoins and institutional payments) and increased token burn activity, reinforcing sustained buyer interest.
Price is now approaching a key selling/supply zone at $0.1798 – $0.1876. From this area, a healthy pullback is expected before any further upside, making this a retracement-based trade, not a trend continuation entry.
Retracement Trade Setup:
Entry: $0.1804
Stop Loss: $0.2004
Target 1: $0.1500
Target 2: $0.1204
Manage risk accordingly. This setup is designed to capture a short-term pullback within a broader bullish structure, not to chase the breakout.

EURUSD wil fall!EURUSD is at a major RESISTANCE upon market open. It is showing signs of weakness and taking some SELLS for scalping and gonna go in bigger lots once a MTR is confirmed.

Btc Price Prediction Elliott Wave wxy possiblyThis count is based on my assumptions so anything can happen not a trading or financial advice just for educational purposes only kindly do your own ta thanks trade with care good luck.

Silver Breaks Higher After a Decade of CompressionSilver has entered a structurally different phase following a decisive breakout from a multi-year consolidation range. After spending more than a decade oscillating within a complex corrective structure, price has resolved higher in what increasingly resembles the early stages of a larger impulsive advance.
From a long-term Elliott Wave perspective, the extended corrective sequence appears complete, with the advance from the 2020 lows unfolding as a developing five-wave structure. The initial impulse and subsequent correction respected rising channel support, and the latest acceleration suggests the market is transitioning into a higher-momentum phase.
Near term, silver may experience a corrective pause following the recent vertical advance, with a pullback toward former resistance and channel support remaining a healthy outcome rather than a structural threat. Such a retracement would be consistent with a developing wave (iv) before trend continuation.
On a broader horizon, the resolution of a decade-long base opens the door to significantly higher price discovery over the coming years. While volatility is expected, the larger technical framework now favors expansion rather than consolidation.
Bottom line:
Silver is no longer behaving like a range-bound metal. The structure argues that a long-suppressed trend may finally be asserting itself.

SOL / USD [Solana] EWP TC FIB ANALYSIS DAILY TFSOLUSD – Macro Elliott Wave Perspective (3D)
From the April 2020 low, SOL entered a strong five-wave impulsive advance, completing an intermediate-degree uptrend into the November 2021 peak. This move showed classic impulse characteristics: expanding momentum, clean wave separation, and accelerating trend structure.
From November 2021 to December 2022, price unfolded a five-wave impulsive decline, ending with capitulation during the FTX collapse. This completed a full intermediate-degree downtrend, not a simple pullback.
Following the December 2022 low, SOL began a new advance into a January 2025 double top, characterised by a flatter slope and weaker momentum expansion.
Since the January 2025 high, price action has turned corrective and overlapping; hence, a minor-degree A–B–C correction appears to be unfolding. The current decline is interpreted as Minor Wave C of Intermediate (B), with a potential termination zone in the $55–75 region.
Once Intermediate (B) completes, the model anticipates the start of Intermediate Wave (C) — a five-wave impulsive advance that would complete the larger ABC structure originating from the December 2022 low.
Based on Fibonacci extensions and channel geometry, the projected region for Intermediate (C) currently aligns near $1,450–1,500, assuming price confirms with impulsive structure and expanding momentum. Confirmation of Intermediate (C) will require a clear impulsive breakout from the corrective channel.
Like and follow for more charts like this.

EURUSD: Trend Shift in Play as Buyers Defend Rising SupportHello everyone, here is my breakdown of the current EURUSD setup.
Market Analysis
EURUSD is trading within a broader bullish context after completing a corrective phase. Earlier, price moved higher inside a well-defined ascending channel, confirming strong buyer control with a clear sequence of higher highs and higher lows. After reaching the upper boundary of the channel, the market transitioned into a corrective bearish move, forming a descending channel that reflected temporary seller dominance rather than a full trend reversal. During this correction, price interacted multiple times with key structure levels, producing several breakouts and fake breakouts, which highlighted increased volatility and stop-hunting behavior. Eventually, EURUSD broke below the descending channel but failed to sustain downside momentum. Sellers lost control near the Support Zone around 1.1700, where price found strong demand aligned with previous structure and a rising support line. Buyers stepped in aggressively from this area, leading to a sharp bullish impulse and a confirmed breakout above the descending channel resistance. This breakout suggests a structural shift back in favor of buyers.
Currently, price is consolidating above the support zone and holding above the rising support line, indicating acceptance and strengthening bullish intent. Overhead, the market is approaching the Resistance Zone around 1.1780, which previously acted as a rejection area and remains a key level to watch.
My Scenario & Strategy
My primary scenario remains bullish as long as EURUSD holds above the 1.1700 support zone and continues to respect the rising support structure. A sustained move toward the 1.1780 resistance area is likely, with this level acting as the first target (TP1). A clean breakout and acceptance above resistance would confirm continuation and open the door for further upside.
However, if price gets rejected from resistance, a period of consolidation or a shallow pullback toward the support zone could occur before the next attempt higher. A decisive breakdown below the 1.1700 support would weaken the bullish bias and signal a deeper corrective move. For now, structure and price action favor buyers while support continues to hold.
That’s the setup I’m tracking. Thank you for your attention, and always manage your risk.

EURUSD Rejection From Resistance, 1.1630 Support in FocusHello traders! Here’s my technical outlook on EURUSD (4H) based on the current chart structure. EURUSD previously traded within a well-defined bullish channel, supported by a rising trend line and a sequence of higher highs and higher lows. This structure confirmed strong buyer control after price reversed from the broader base and pushed higher with momentum. During this bullish phase, price broke above a key Seller Zone around 1.1680–1.1700, confirming bullish continuation and acceptance above former resistance. The market then extended higher before momentum started to fade near the upper boundary of the channel, where price clearly turned around, signaling exhaustion from buyers. Following the top, EURUSD transitioned into a corrective phase, breaking below the ascending structure and forming a descending channel. This shift marked a short-term change in market control, with sellers gaining strength. Price respected the descending resistance line, producing lower highs and confirming bearish pressure. Several corrective pullbacks occurred, but each rally failed below the Resistance Level near 1.1700, reinforcing this area as a strong supply zone. Fake breakouts and quick rejections from this zone further highlight active selling interest. Currently, EURUSD has broken below the descending resistance line and is trading beneath the Seller Zone, suggesting that recent upside moves are corrective rather than impulsive. Price is now moving toward the Buyer Zone / Support Level around 1.1630–1.1600, which previously acted as a key demand area and structural reaction zone. This level is marked as TP1, where buyers may attempt to slow or pause the decline. My scenario: as long as EURUSD remains below the 1.1680–1.1700 Resistance Level and continues to respect the broader bearish structure, the downside bias remains valid. I expect price to continue lower toward the 1.1630–1.1600 Support Level (TP1). A clean breakdown and acceptance below this zone would open the door for a deeper bearish continuation. However, a strong bullish reaction and acceptance back above resistance would invalidate the bearish scenario and suggest a possible return to consolidation or trend recovery. For now, market structure favors sellers while price trades below resistance. Please share this idea with your friends and click Boost 🚀

BTC Outlook: Correction Exhaustion Signals Lower ContinuationBitcoin continues to trade within a well defined descending channel with recent price action reinforcing a broader bearish structure. The advance into channel resistance appears corrective in nature, completing a larger W - X - Y formation rather than signalling trend reversal. Overlapping candles and lack of impulsive momentum suggest this move represents the final phase of a corrective rally.
With price rejected from the upper boundary of the channel, the market is likely transitioning into the next impulsive leg lower. This sets the stage for the development of Wave 5, which may typically unfold with strong downside momentum as sellers regain control. The initial area of interest lies near the 80,700 level, where price may attempt a brief pause or corrective reaction. A deeper decline toward the 66,600 region remains the primary objective, aligning with the lower channel boundary and prior structural support.
Unless Bitcoin can reclaim and hold above channel resistance with impulsive strength, rallies are expected to remain corrective. The broader structure continues to favor downside continuation, with risk skewed toward lower prices in the weeks ahead.
Disclaimer: This analysis is for informational and educational purposes only and does not constitute financial advice.

LINK / USD [Chainlink] EWP TC FIB ANALYSIS WEEKLY TFChainlink macro structure shows a complete intermediate wave 3/C five-wave impulse into the 2021 high. Since then, price has been correcting that entire advance in a higher-degree Wave 4 sideways, unfolding as an A–B–C structure inside a descending corrective channel. Wave (A) completed in 2022, Wave (B) formed a multi-year complex correction, and intermediate wave (C) of primary Wave 4 is projected to continue toward channel support, with termination expected in the $2.50 region. Based on channel geometry and Fibonacci confluence, Wave 4 is expected to complete around December 2026. Until then, all upside remains corrective. Once Wave 4 finishes, Fibonacci extensions and long-term channel projections point toward the $230 region as the terminal target for the final macro Wave 5.
Like and follow for more charts like this.

Index at the top of the channel
Hello fellow traders and investors,
It seems to me we are at a critical juncture with both markets (ADX and DFM). I am out until I see what the market does in the coming days. I prefer to see some consolidation before I have confidence with any breakout from these major channels. Entries currently should be with a lot of caution.
All the best!
