TATA CHEMICALS on Full Momentum – Don’t Miss the RideTATA CHEMICALS – 4 Hour Timeframe Update
Tata Chemicals is currently forming a broadening pattern and is in the process of completing its 4th leg.
The stock is showing strong momentum, supported by the Supertrend indicator, and continues to make new highs.
Support Zone: 980 – 990
Potential Upside Target: 1050 – 1070 (valid only if the support holds)
Thank you!
Patternanalysis

$BNB FINALLY $1K DONE. Q4, 2024 I was Predict (Now$999 - $1,111)Always Control your Money management and try to long term investment for big rewards.
#Write2Earn #BinanceSquareFamily #Binance #BTC☀ #SUBROOFFICIAL
Disclaimer: This article is for informational purposes only and does not constitute financial advice. Always conduct your own research before making any investment decisions. Digital asset prices are subject to high market risk and price volatility. The value of your investment may go down or up, and you may not get back the amount invested. You are solely responsible for your investment decisions and Binance is not available for any losses you may incur. Past performance is not a reliable predictor of future performance. You should only invest in products you are familiar with and where you understand the risks. You should carefully consider your investment experience, financial situation, investment objectives and risk tolerance and consult an independent financial adviser prior to making any investment.

"Aha!" Moments Are Dangerous — Here’s Why You Shouldn’t Panic Just because a big options trade appears — doesn’t mean it’s a signal.
Options move every day.
Some trades are:
-Speculative
-Hedging plays
-Pure lottery tickets
Only a few carry real directional sentiment.
And learning to separate noise from signal?
That’s one of the most powerful skills a trader can develop — even if you never trade options yourself.
Let’s Look at JPY (See Chart)
On September 5, two large put portfolios appeared:
1. 0.0064 Put
2. 0.00635 Put
Both new, both with no prior open interest — so not a roll.
And yes — they’re larger than average.
To a beginner, this screams:
“JPY is going to crash — time to short everything!”
But let’s pause.
An experienced flow analyst would ask:
Is this really a bearish signal?
🔍 Here’s What the Data Says:
❗️Size ≠ Significance
Yes, the portfolios are big — but each costs ~$90K.
In institutional terms? Not massive.
❗️Delta is ~2%
That means less than 2% chance of expiring in the money.
❗️This Happens Often in JPY
Same strike (0.0064), same structure — appeared in the previous series.
Price never went near it.
No crash. No panic.
Just… nothing.
🧠 So Why Buy It?
I don’t know.
And I don’t need to.
Could be:
1️⃣A hedge for a larger book
2️⃣A counterparty agreement
3️⃣A some extra aggressive logic
But here’s what I do know:
Based on years of CME data and personal tracking —
Trades like this don’t cause market crashes.
They don’t move the needle.
They don’t change the trend.
✅ Final Takeaway:
Don’t react to the data headline.
Ask:
How likely is this to matter?
Is it priced in?
Has this happened before? Price reaction after big OTM options?
Because real edge isn’t in the "Aha!" moment —
It’s in the "Wait, let me check…" moment.

$BTC Milestone Alert & Price will hit $128K or $88K in Sep, 2025✨Bitcoin Milestone Alert & Price will hit $128K or $88K in September or October 2025 🚀
CRYPTOCAP:BTC has now stayed above the $100K level for 122 consecutive days. Price will Bounce Back to $105K to $128K Range and if drop retest it will be the $88K-$92K Zone otherwise PUMP ongoing.
That’s over 4 months of holding six-figure territory, proving that $100K isn’t just a breakout, it’s becoming a new market baseline.
The question isn’t if Bitcoin can hold, but what’s next from here?
REMINDER: Hidden bullish divergence could confirm on today’s weekly close. Mega-bullish for Bitcoin. Q4 Will be explosive. Millionaires will be created. You just have to stay in the game. Do you understand?
Q4 Will be explosive. Millionaires will be created. You just have to stay in the game. Do you understand?
📊 This September Big Economic Week Incoming
• Tuesday (Sept 9): U.S. Non-Farm Payrolls Annual Revisions
• Wednesday (Sept 10): U.S. PPI (Producer Price Index)
• Thursday (Sept 11): U.S. CPI (Consumer Price Index) & ECB Rate Decision
🌍 EXPECT VOLATILITY!
#Write2Earn #BinanceSquareFamily #Binance #BTC☀ #SUBROOFFICIAL
Disclaimer: This article is for informational purposes only and does not constitute financial advice. Always conduct your own research before making any investment decisions. Digital asset prices are subject to high market risk and price volatility. The value of your investment may go down or up, and you may not get back the amount invested. You are solely responsible for your investment decisions and Binance is not available for any losses you may incur. Past performance is not a reliable predictor of future performance. You should only invest in products you are familiar with and where you understand the risks. You should carefully consider your investment experience, financial situation, investment objectives and risk tolerance and consult an independent financial adviser prior to making any investment.

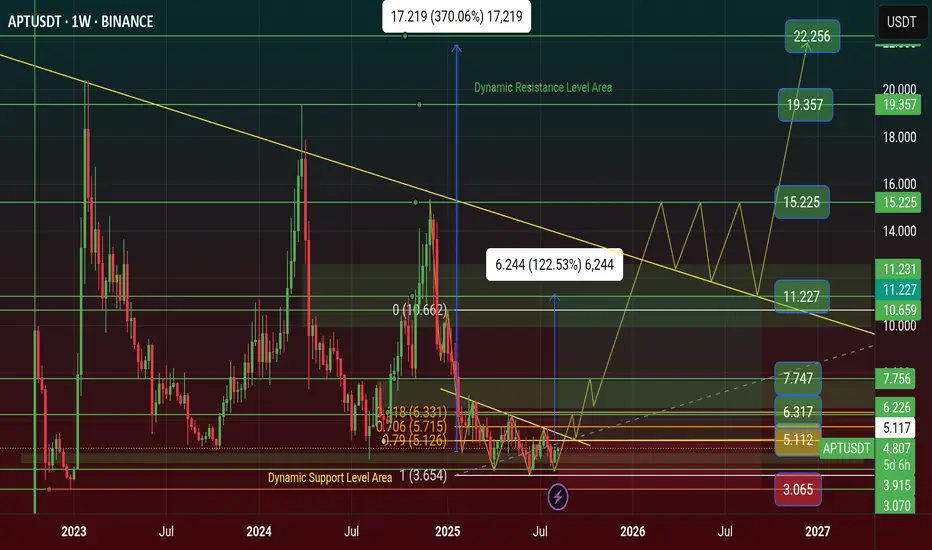
$APT Price Prediction will be reach $22 this Year 2025APT price is Showing Triple Bottom Pattern on Chart. it's a Reversal Pattern for APT price Manipulation. Time for Bull Run on APT and 12 aug unlocked 11.31M APT token and 2.20% of released supply $51.35M Dollar.
APT Price now Bottom area of Major Support Level area. At first the price will Hit $7 and if it's touch $11 price and if it's Breakout this Resistance it will be happened APT $22 Price.
🚦Aptos (APT) - 11.31M Token Unlocked worth of $51.35M - 12 Aug 2025
On 12 August 2025, Aptos will unlock 11.31 million new tokens. This event adds more APT tokens into the market supply at one time. Many traders watch token unlocks because more supply can bring price down if holders decide to sell quickly. Also, if most tokens go to teams or early backers, there might be more selling.
However, if unlocks are well planned and market demand is high, the price may not fall much. This event could be a catalyst for price change based on how the market reacts.
🚦 Aptos’ DEX trading volume reached $9 billion in the first half of the year, and the market value of stablecoins increased to $1.2 billion
PANews reported on August 12th that a Messari report showed that Aptos made significant progress in on-chain performance, DeFi ecosystem, and technological innovation in the first half of 2025. Transaction fees dropped to $0.00052, DEX trading volume reached $9 billion, and the stablecoin market capitalization increased to $1.2 billion.
On the technical side, projects such as Shelby and Decibel were launched to improve network performance. The Aptos Foundation invested $200 million to promote ecosystem development and consolidate its position as a global transaction engine.
🚦 UPCOMING EVENTS APT 11 SEPTEMBER
Total 11.31M APT Token Unlock worth of $54.51M and 2.15% of released supply
#Write2Earn #BinanceSquareFamily #BinanceAlphaAlert #APT #SUBROOFFICIAL
Disclaimer: This article is for informational purposes only and does not constitute financial advice. Always conduct your own research before making any investment decisions. Digital asset prices are subject to high market risk and price volatility. The value of your investment may go down or up, and you may not get back the amount invested. You are solely responsible for your investment decisions and Binance is not available for any losses you may incur. Past performance is not a reliable predictor of future performance. You should only invest in products you are familiar with and where you understand the risks.
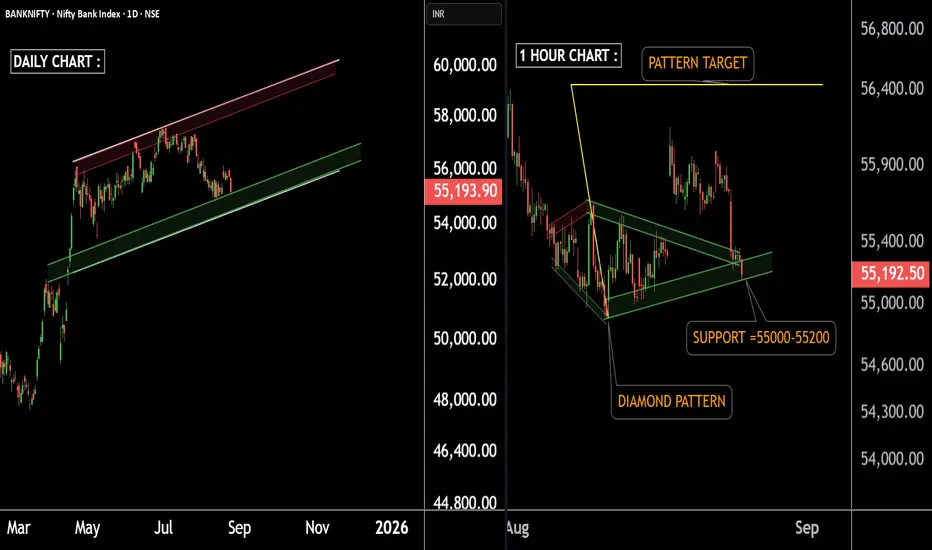
Bullish setup spotted in Bank Nifty – Time to go long.There are two charts of Bank Nifty – one on the Daily timeframe and the other on the 1-Hour timeframe.
On the Daily timeframe, Bank Nifty is taking support on a parallel channel with a support zone around 55,000–55,200 and if makret then support is near 54500 in extreme case.
On the 1-Hour timeframe, Bank Nifty has formed a Diamond Pattern and, after the breakout, is also taking support near 55,000–55,200.
If Bank Nifty sustains this level, we may see higher prices with the pattern target projected around 56,200–56,500.
Thank You !!
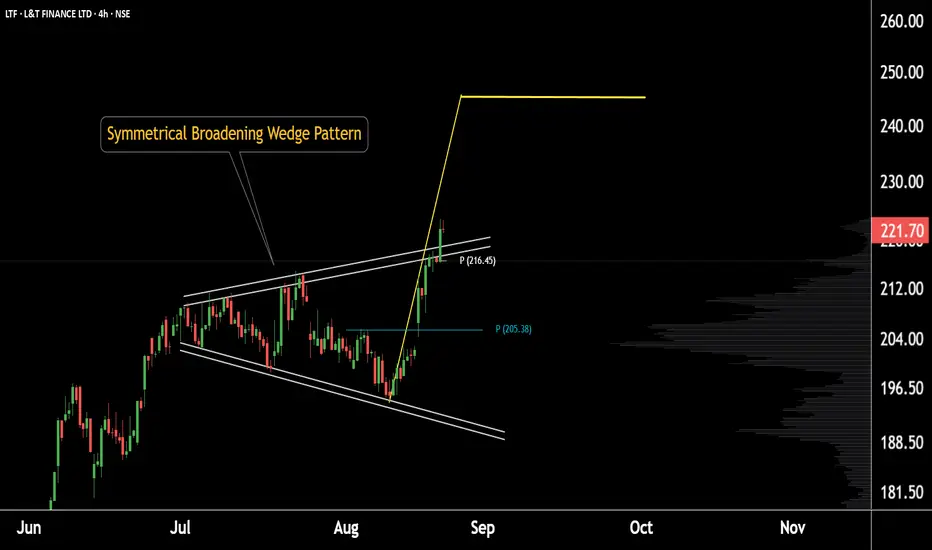
L&T Finance breakout in action – bulls taking chargeThis is the daily chart of L&T Finance.
The stock has been forming a broadening wedge pattern and has recently given a pattern breakout around 220.
Currently, L&T Finance is sustaining above its daily pivot level of 216, with strong support in the 215–220 zone.
If this support holds, we may witness higher prices in the stock.
Thank you.
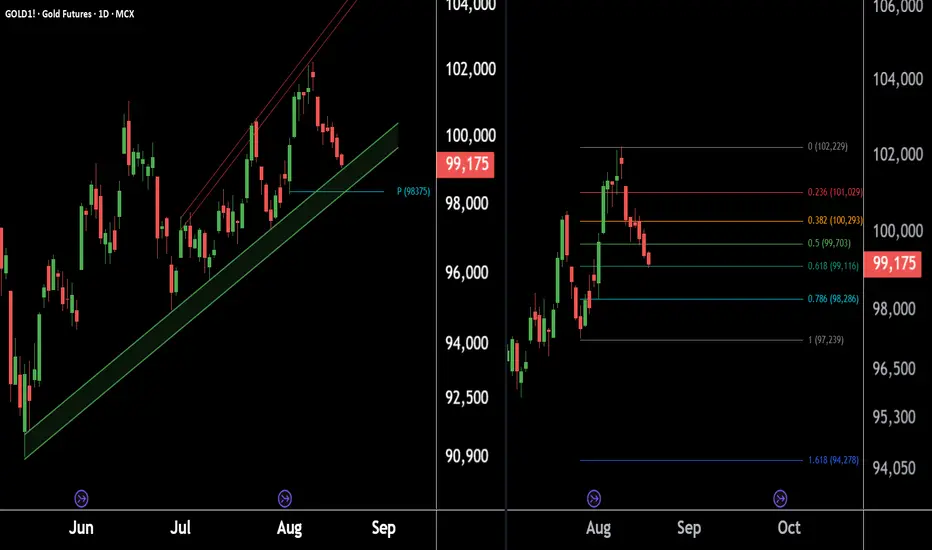
Gold is testing key levels – setup indicates a favorable buying.Here are 2 charts of Gold on the Daily Timeframe.
GOLD1! is approaching its support zone, with key levels at ₹98,200 and ₹98,800.
The Monthly Pivot at ₹98,375 also aligns with this zone, indicating a strong support area.
Fibonacci Golden Ratio is also indicating key support levels around ₹99,200 and ₹98,200, which may act as strong demand zones.
If respected, these levels could trigger a fresh upside move.
Thank You !!
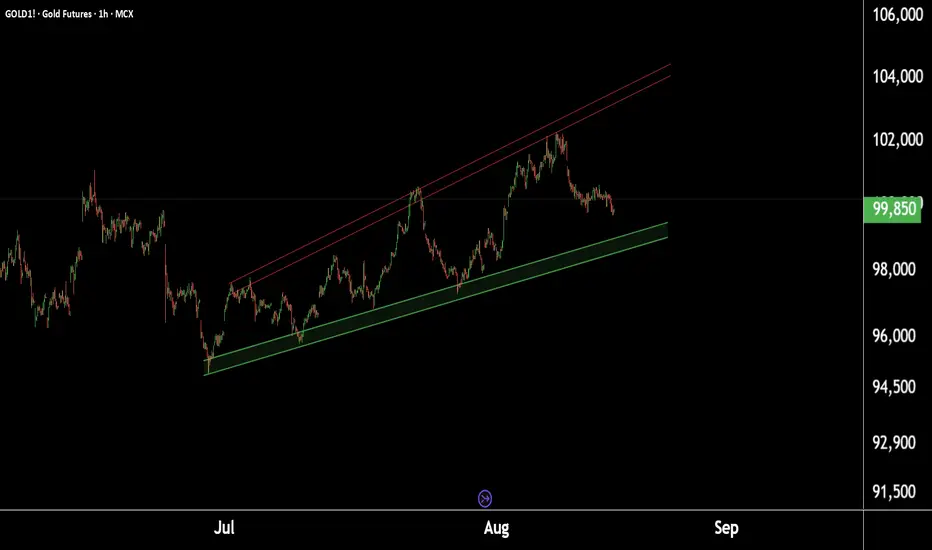
Gold at Crucial Levels – Buy or Sell? Watch These Key Price ZoneDaily Gold Update:
This is the daily timeframe chart of Gold1!.
Gold1! is forming an ascending broadening wedge pattern with support in the ₹98,500–₹98,800 range.
If this support holds, we may see higher prices.
However, if it breaks, Gold1! could decline towards its pattern target near ₹95,000.
Thank You !!
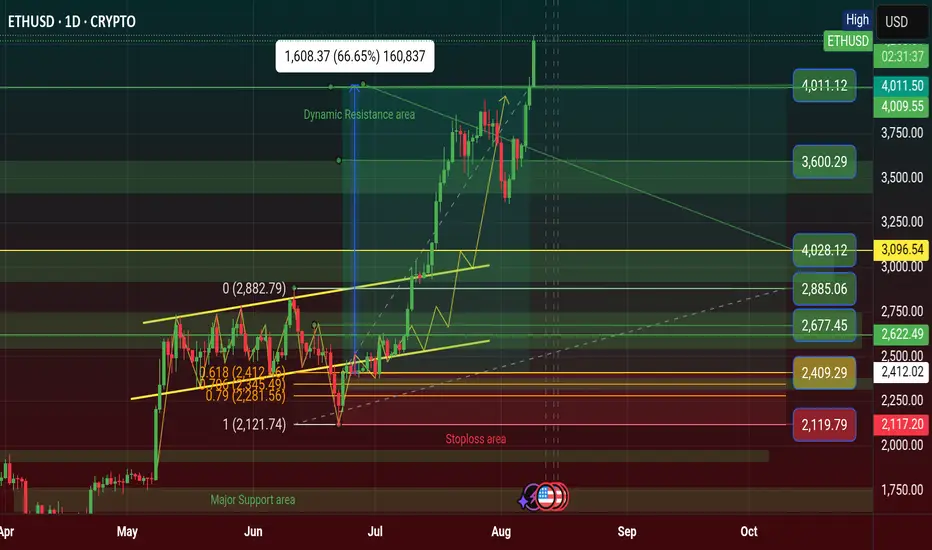
$ETH Finally $4,011 Profit Done Again, Breakout $4K price areaIf CRYPTOCAP:ETH price will be touch $4.5K and it's Breakout it will be happened $5K of new historical ATH.
Ethereum Price Target $4K as Trader Plans Partial Exit
Ethereum Maintains Market Leadership
The Ethereum Price Target $4K narrative is gaining traction as ETH continues to outperform the broader crypto market. Despite volatility, Ethereum’s resilience and strong fundamentals have kept it at the forefront of investor attention.
One experienced trader noted that ETH is “still the strongest asset in the crypto market,” following their lower time frame (LTF) plan closely. They believe the market could be nearing a local top, potentially with a brief spike — or deviation — above the $4,000 level.
Planned Exit Strategy Between $4K and $4.3K
The trader shared a specific strategy: selling 50% of their spot Ethereum holdings between $4,000 and $4,300. This position has been held for nearly two years, with an average entry price of around $2,400, meaning the planned sale would lock in substantial profits.
Such an approach reflects disciplined risk management — capturing gains after a strong rally while maintaining exposure in case the trend continues higher.
What This Means for the Market
If Ethereum does approach the $4K–$4.3K range, several scenarios are possible:
A deviation above $4K followed by a retracement could confirm a local top.
Sustained momentum beyond $4.3K could signal a stronger-than-expected breakout.
Broader crypto market sentiment will likely play a major role in price direction.
With ETH’s fundamentals stronger than ever and network upgrades continuing, the medium- to long-term outlook remains bullish — even if short-term corrections occur.
#highlights #BinanceSquareFamily #Binance #ETH #SUBROOFFICIAL
Disclaimer: This article is for informational purposes only and does not constitute financial advice. Always conduct your own research before making any investment decisions. Digital asset prices are subject to high market risk and price volatility. The value of your investment may go down or up, and you may not get back the amount invested. You are solely responsible for your investment decisions and Binance is not available for any losses you may incur. Past performance is not a reliable predictor of future performance. You should only invest in products you are familiar with and where you understand the risks. You should carefully consider your investment experience, financial situation, investment objectives and risk tolerance and consult an independent financial adviser prior to making any investment.
$BTC Finally Historical Profit Done at $122K & Now $123K of ATH CRYPTOCAP:BTC tying to push price upward movement and if it's Breakout the $120K-$122K Price Level area than it could be reached $128K - $136K price level area.
I'm guess it will be happened. Always Pattern indicate and say price movement of Bitcoin. I was many Prediction of popular coin and i will succeed in 2025. I'm long term analyst of long term investment of Traders.
🚦From News: Bitcoin Holds Firm Above $115K Support as Charts Point Toward $150K Target
Bitcoin holds above $115K support with charts pointing to a potential $150K Elliott Wave target.
Hashrate hits all-time high as energy value model places BTC valuation 45% above current price.
U.S. policy shift enables 401(k) crypto access, opening a $9 trillion market for Bitcoin adoption.
Bitcoin has held firm above the $115,000 support and is now showing signs of a large move on the charts. Price patterns and rising adoption trends are aligning as BTC prepares for a possible rally. At the time of writing, BTC was trading at $116,620, showing steady upward momentum.
Technical Structure Points Toward Upside Continuation
According to an analysis prepared by Lau, Bitcoin has taken the $115,000 support and may be preparing to break its all-time high. On Binance, the BTC/USDT daily chart displays a breakout from resistance near $116,438.79. The price reached a new high before retracing to $111,917.37, where it found support.
BTC’s price structure continues to show higher lows, aligning with the Elliott Wave pattern that targets $150,000. Key support levels remain at $98,385.45 and $89,326.51, confirming a strong technical base. According to Daan Crypto Trades, Bitcoin is steadily rising toward the $120,000 zone, where a cluster of stop losses and liquidation points may fuel further upside.
The current bullish flag formation is still intact, supported by the 50-day SMA at $113,154. The RSI has moved to 54, indicating recovering momentum without being overbought. Analysts view a break above $117,350 as a key signal for another upward push.
On-Chain Metrics and Market Drivers Support Growth
Bitcoin’s energy value stands at $167,800, which is around 45% above the current market price. According to Charles Edwards, founder of Capriole Investments, “Hash rates are flying and Bitcoin Energy Value just hit $145K.”
This model links BTC’s value to miner energy inputs and network security. Bitcoin’s hashrate reached an all-time high of 1.031 ZH/s on August 4, based on data from Glassnode. Alongside this, adoption is growing in the U.S. market.
President Trump’s policy allowing 401(k) crypto inclusion has opened a $9 trillion market. Crypto-linked equities and ETFs have also seen strong inflows, supporting long-term price action.
#highlights #everyone #premium #BinanceSquareFamily #Binance #BTC☀ #SUBROOFFICIAL
Disclaimer: This article is for informational purposes only and does not constitute financial advice. Always conduct your own research before making any investment decisions. Digital asset prices are subject to high market risk and price volatility. The value of your investment may go down or up, and you may not get back the amount invested. You are solely responsible for your investment decisions and Binance is not available for any losses you may incur. Past performance is not a reliable predictor of future performance. You should only invest in products you are familiar with and where you understand the risks. You should carefully consider your investment experience, financial situation, investment objectives and risk tolerance and consult an independent financial adviser prior to making any investment.

HEROMOTOCO accelerating into a bullish breakout– momentum trade!This is the Daily chart of HERO MOTOCORP LTD.
Hero MotoCorp has formed a Head & Shoulders pattern, and the stock has recently given a breakout above the neckline. It has also retested the shoulder zone, confirming the breakout and it's shoulder pattern target is 4800 and head pattern target is 5750.
HEROMOTOCO having a good support zone near at 4100-4200.
If this level is sustain then we may see higher prices in HEROMOTOCO.
Thank You !!

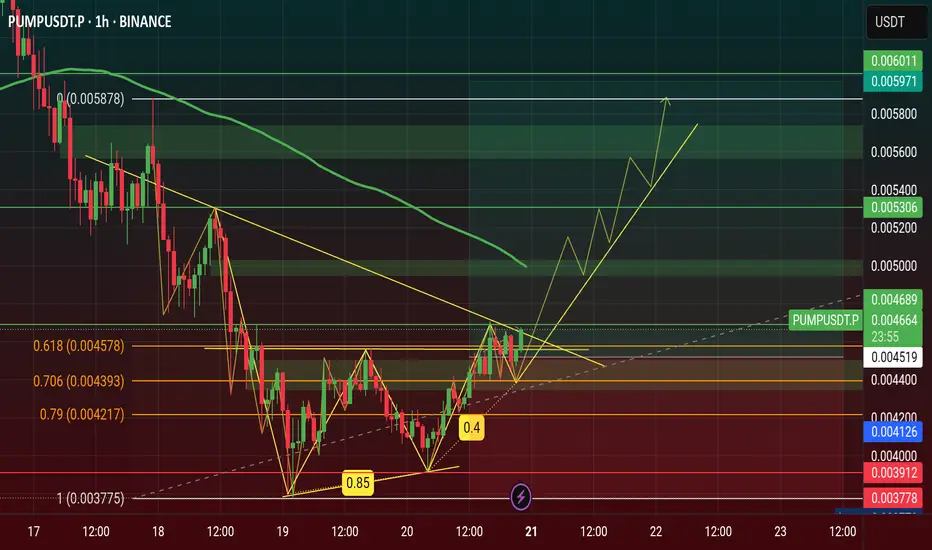
$PUMP Price Will Hit $0.006 this July 2025 see on Chart...🚀 NYSE:PUMP Price Will Hit $0.006 this July 2025, NYSE:PUMP is Showing a Double Bottom Pattern Looking on Chart now.
Double Bottom Pattern is a Reversal Pattern and It's will Manipulation Price of Pump. I'm Find a Three White Shoulders Candle in bottom price area on 4h Chart & It is a Bullish Candle. Now Price Retest and If it's Breakout it will be happened this month.
#Write2Earn #TrendingPredictions #AltcoinSeasonLoading #pump #SUBROOFFICIAL
Disclaimer: This article is for informational purposes only and does not constitute financial advice. Always conduct your own research before making any investment decisions. Digital asset prices are subject to high market risk and price volatility. The value of your investment may go down or up, and you may not get back the amount invested. You are solely responsible for your investment decisions and Binance is not available for any losses you may incur. Past performance is not a reliable predictor of future performance.
$BNB Chart Showing Bullish Flag Pattern and Price Will Hit +$750CRYPTOCAP:BNB Previously Chart showing Bullish Inverse Head and Shoulder Pattern and Gain Profit of Range. It's a Reversal Pattern .
Now Chart Showing a Bullish Flag Pattern and it's Continuation Pattern. Time to Bullish for BNB Coin for FOMC 10th July Thursday 2025.
The upsloping 20-day EMA and the RSI just above the midpoint indicate a slight edge to the bulls. If the $665 resistance falls, the BNBUSD pair could rise to $675 and then to $698.
Sellers are likely to pose a solid challenge at $698 because a break above it could propel the pair to $732. I'm guess BNB Price Breakout of ATH and $888 Mystery will Happen.
This optimistic view will be negated in the near term if the price turns down and breaks below the moving averages. The pair may then drop to $636.
NEWSBTC: BNB Price Gears Up for Upside Break — Will Bulls Deliver?
BNB price is gaining pace above the $650 support zone. The price is now showing positive signs and might aim for more gains in the near term.
BNB price is attempting to recover from the $620 support zone.
The price is now trading above $655 and the 100-hourly simple moving average.
There is a key contracting triangle forming with resistance at $662 on the hourly chart of the BNB/USD pair (data source from Binance).
The pair must stay above the $655 level to start another increase in the near term.
BNB Price Eyes More Gains
After forming a base above the $620 level, BNB price started a fresh increase. There was a move above the $645 and $650 resistance levels, like Ethereum and Bitcoin.
The price even surged above the $660 level. A high was formed at $666 before there was a downside correction. The price dipped below the 50% Fib retracement level of the upward move from the $650 swing low to the $666 swing high.
The price is now trading above $655 and the 100-hourly simple moving average. On the upside, the price could face resistance near the $662 level. There is also a key contracting triangle forming with resistance at $662 on the hourly chart of the BNB/USD pair.
The next resistance sits near the $665 level. A clear move above the $665 zone could send the price higher. In the stated case, BNB price could test $672. A close above the $672 resistance might set the pace for a larger move toward the $680 resistance. Any more gains might call for a test of the $700 level in the near term.
Another Decline? If BNB fails to clear the $662 resistance, it could start another decline.
Initial support on the downside is near the $655 level and the 61.8% Fib retracement level of the upward move from the $650 swing low to the $666 swing high. The next major support is near the $650 level.
The main support sits at $644. If there is a downside break below the $644 support, the price could drop toward the $632 support. Any more losses could initiate a larger decline toward the $620 level.
Technical Indicators
Hourly MACD – The MACD for BNB/USD is gaining pace in the bullish zone.
Hourly RSI (Relative Strength Index) – The RSI for BNB/USD is currently above the 50 level.
Major Support Levels – $655 and $650.
Major Resistance Levels – $662 and $665.
#Write2Earn #BinanceSquareFamily #BinanceTurns8 #BNB #SUBROOFFICIAL
Disclaimer: This article is for informational purposes only and does not constitute financial advice. Always conduct your own research before making any investment decisions. Digital asset prices are subject to high market risk and price volatility. The value of your investment may go down or up, and you may not get back the amount invested. You are solely responsible for your investment decisions and Binance is not available for any losses you may incur. Past performance is not a reliable predictor of future performance. You should only invest in products you are familiar with and where you understand the risks. You should carefully consider your investment experience, financial situation, investment objectives and risk tolerance and consult an independent financial adviser prior to making any investment.

$LOT Price Showing Symmetrical Triangle Pattern & Breakout aboveASX:LOT is a League of Traders Trading Competition Platform. LOT is an Native token of this platform.
Every Trading Player Have LOT point and they convert to LOT token and get on there wallet. Who Join LOT Trading League for LOT point? The main competition is top level and get free price.
💡 TOKEN OVERVIEW ( ASX:LOT )
Market capitalization: 3.89 M USD
Fully diluted market cap : 25.90 M USD
Trading volume 24h: 2.89 M USD
All time high: 0.044869 USD
Circulating supply: 150.00 M
Max supply: 1.00 B
Total supply: 1.00 B
A new Native token Release on Binance Alpha and when it's release on Binance Coin than we will see more pumping this Native Token Price.
ASX:LOT price now at $0.026186 and this year 2025 I'm Prediction the price will be happened $0.45-$0.75 hit. If Biggest Tournament will start this year on this Platform. Than Possible to worldwide Tournament make more Pumping price. Because of the Big investor will become investment on this LOT native Token.
We have to decisions long-term investment this coin. The main thing is that some Coin will be scammed. But League of Traders Platform is the Legit of Cross Chain Trading Competition.
The Crypto Scammer will not Permission listed there token on the Top Exchange of Binance Market. #SUBROOFFICIAL
Disclaimer: This article is for informational purposes only and does not constitute financial advice. Always conduct your own research before making any investment decisions. Digital asset prices are subject to high market risk and price volatility. The value of your investment may go down or up, and you may not get back the amount invested. You are solely responsible for your investment decisions and Binance is not available for any losses you may incur. Past performance is not a reliable predictor of future performance. You should only invest in products you are familiar with and where you understand the risks. You should carefully consider your investment experience, financial situation, investment objectives and risk tolerance and consult an independent financial adviser prior to making any investment.

$BTC Price Showing a Bullish Flag Pattern & Breakout see chart..CRYPTOCAP:BTC Price Breakout of Bullish Flag Pattern. I'm guess it's going to the next Price Zone $115K and if Breakout thank going $122K price zone.
I was telling some coins that was saying Multiple Profit and now coins are driving on the way. There are coin is ETH, BNB, XRP, SOL, TRX, TON, SUI, ADA, ICP, ARB, XLM.
Ric Edelman Urges Up to 40% Crypto Allocation, Predicts Bitcoin Surge to $500K
Top advisor Ric Edelman recommends investors allocate up to 40% to crypto, forecasting Bitcoin could reach $500K with rising institutional demand.
Ric Edelman advises investors to allocate 10% to 40% of their portfolios to crypto, based on their risk tolerance.
Edelman predicts Bitcoin could reach $500,000 if just 1% of global assets shift into the cryptocurrency sector. His endorsement is viewed as a major TradFi signal, given his $300 billion asset management influence in the advisory industry.
Ric Edelman, the founder of Edelman Financial Engines and DACFP, has recommended investors shift a significant portion of their portfolio to cryptocurrency. In a recent whitepaper, Edelman advised allocating between 10% and 40% to crypto, depending on individual risk tolerance.
This guidance marks a break from the conventional 60/40 stock-to-bond portfolio model, which he believes is no longer practical in a rapidly advancing economic environment.
According to Edelman, conservative investors should hold 10% in crypto, moderate investors 25%, and aggressive investors 40%. He cited technological advancements and increased life expectancy as reasons to move away from traditional investment formulas. He emphasized that ignoring crypto means betting against an asset class that has outperformed all others over the past 15 years.
Bitcoin Price Could Hit $500,000 with Minimal Asset Shift
Edelman also presented a bullish projection for Bitcoin, suggesting it could reach $500,000. He explained that a 1% allocation of the $750 trillion in global assets toward Bitcoin would inject $7.5 trillion into the market. Based on current valuations, this inflow could significantly drive the asset’s price. He underlined this estimate as simple arithmetic based on supply and demand trends.
Edelman pointed to growing institutional interest and policy changes as key drivers for crypto’s rise. He highlighted that Tether, a major stablecoin, reported $13 billion in profits last year, surpassing companies like McDonald’s and Ford. He also noted that a pro-crypto political climate, especially following Donald Trump’s reelection, is setting favorable conditions for digital assets.
Disclaimer: This article is for informational purposes only and does not constitute financial advice. Always conduct your own research before making any investment decisions. Digital asset prices are subject to high market risk and price volatility. The value of your investment may go down or up, and you may not get back the amount invested. You are solely responsible for your investment decisions and Binance is not available for any losses you may incur. Past performance is not a reliable predictor of future performance. You should only invest in products you are familiar with and where you understand the risks. You should carefully consider your investment experience, financial situation, investment objectives and risk tolerance and consult an independent financial adviser prior to making any investment.

$XAU Showing Bearish Flag Pattearn & Dropped $3K Support area...TVC:XAU Showing Bearish Flag Pattearn & Dropped $3K Support area. Price dropping now and back to $3K price level area. price FVG touch and Strong support $3K Price Level area. Here is many support Holder.
Stoploss: $3,536
Entry: $3,377
1st Target point $3,377
2nd Target point $3,249
3rd Target point $3,028
Disclaimer: This article is for informational purposes only and does not constitute financial advice. Always conduct your own research before making any investment decisions. Digital asset prices are subject to high market risk and price volatility. The value of your investment may go down or up, and you may not get back the amount invested. You are solely responsible for your investment decisions and Binance is not available for any losses you may incur. Past performance is not a reliable predictor of future performance. You should only invest in products you are familiar with and where you understand the risks. You should carefully consider your investment experience, financial situation, investment objectives and risk tolerance and consult an independent financial adviser prior to making any investment.

BIOCON LIMITED KEY ZONE !!This is the Daily chart of BIOCON LIMITED.
Biocon is currently trading near its pattern resistance zone around the 340 range.
BIOCON has a strong support zone near the 300 range.
Thank You !!

$ARB time to fly $1 this bull run 2025 and it's Last Wave...AMEX:ARB Time to Fly and Touching $1 this Quarter. I guess it will be happened and gain bonuses $1+ and $2+ if big investor entry on this token.
My Magic Indicator Say ARB Price have touch Yellow line. Previous Day, Bounce back to above Yellow Line and It's Bull Run 2025 for ARB .
From News: ARB Eyes Trend Reversal With Breakout Signal Above $0.45 This Week
Arbitrum is trading at $0.41 inside a falling wedge and a breakout above $0.45 might confirm a wide shift from its yearlong downward trend.
Arbitrum has formed a falling wedge with lower highs and higher lows now compressing price at $0.41.
If the price moves above $0.45 with strong volume this could confirm a new bullish pattern for $ARB.
The wedge has been forming since 2024 and a breakout may signal the start of a strong trend reversal.
The descending wedge pattern forming on the Arbitrum chart spans nearly one year, beginning from its 2024 highs near $2.50. Several failed rallies marked by red arrows define the top boundary, while green arrows at the base represent support retests. This structure has now tightened into a narrow apex where breakout probability increases significantly.
#Write2Earn #BinanceSquareFamily #Binance #BTC☀ #SUBROOFFICIAL
Disclaimer: This article is for informational purposes only and does not constitute financial advice. Always conduct your own research before making any investment decisions. Digital asset prices are subject to high market risk and price volatility. The value of your investment may go down or up, and you may not get back the amount invested. You are solely responsible for your investment decisions and Binance is not available for any losses you may incur. Past performance is not a reliable predictor of future performance. You should only invest in products you are familiar with and where you understand the risks. You should carefully consider your investment experience, financial situation, investment objectives and risk tolerance and consult an independent financial adviser prior to making any investment.

$BNB Surprised $678 Price Mega Big pumping & Touch to $700+ ✨ CRYPTOCAP:BNB Surprised $678 Price Mega Big pumping & Trying to $700+ Milestone again.
💫 From Breaking News:
• BNB Eyes $700 as CZ Pushes 90% Binance Chain Fee Cut
•Bhutan Partners with Binance Pay and DK Bank to Launch the World’s First National Crypto-Based Tourism Payment System
BNB price surged over 10%, hitting $642.92 after CZ’s 90% BSC gas fee cut proposal.
RSI reached 78.42, confirming strong bullish momentum and overbought conditions.
BNB may test $700 if Binance validators approve the proposed BEP-336 transaction model.
On May 9, Binance Coin (BNB) climbed to $642.92, rising over 10% in 24 hours. The price rally followed a proposal from Binance founder Changpeng Zhao (CZ) to cut gas fees on Binance Smart Chain (BSC) by 90%.
#Write2Earn #bnb #BinanceSquareFamily #MarketRebound #SUBROOFFICIAL
Disclaimer: This article is for informational purposes only and does not constitute financial advice. Always conduct your own research before making any investment decisions. Digital asset prices are subject to high market risk and price volatility. The value of your investment may go down or up, and you may not get back the amount invested.

$ETH Surprised $2.4K Price Mega Big pumping & touch to $3K ✨ CRYPTOCAP:ETH Surprised $2.4K Price Mega Big pumping & Trying to $3K Milestone again.
💫 From Breaking News:
• Ethereum Foundation Invests $32.65M in Ecosystem Growth
• Ethereum To Expand Network Capacity with Gas Limit Increase
Ethereum blockchain is preparing for a major upgrade that could make its network faster, cheaper, and more efficient. Developers have proposed raising the gas limit by 66% in a new development, from 36 million to 60 million units.
This change aims to improve the number of transactions the network can handle per block. This is to help users and developers enjoy smoother and more affordable activity on the blockchain.
Developer Says Testing Success Leads to Mainnet Rollout
Ethereum core developer Parithosh Jayanthi recently confirmed that the upgrade had passed early tests and is now ready for broader use. The new gas limit was successfully tested on the Sepolia and Holesky testnets. According to Jayanthi, the final rollout to Ethereum’s mainnet will begin shortly.
This is the second time Ethereum has raised its gas limit in 2025. The first increase happened in February, when the limit increased from 30 million to 36 million. These changes came after there hadn’t been any gas increase on the network since 2021.
#Write2Earn #ETH #BinanceSquareFamily #MarketRebound #SUBROOFFICIAL
Disclaimer: This article is for informational purposes only and does not constitute financial advice. Always conduct your own research before making any investment decisions. Digital asset prices are subject to high market risk and price volatility. The value of your investment may go down or up, and you may not get back the amount invested.

$BTC Finally $100K Surprised and Take Profit Done✨ CRYPTOCAP:BTC Surprise Finally Touch $100K Milestone again, All Take Profit and bonus Done.
💫 From Breaking News:
• Arizona Bitcoin Bill: Crucial SB 1373 Advances for State Bitcoin Reserve
• New Hampshire Becomes First to Approve Bitcoin Reserve—Will Other States Follow?
First introduced in January, HB 302, gives officials the ability to allocate state funds to both precious metals, and specific digital assets with a market capitalization of over $500 billion. That means Bitcoin, which, as of this writing, has a market cap of roughly $1.9 trillion per TradingView, is a prime candidate.
The newly enacted law states that any digital assets obtained must be kept using high security custody protocols. This can be done directly in a state managed multisignature wallet, via a qualified financial institution custody, or by investment in U.S. regulated exchange traded products (ETPs). Dennis Porter, CEO and Co-Founder of Satoshi Action, said:
“Satoshi Action drafted the model, New Hampshire engraved it into law, and now every treasurer nationwide can follow that roadmap. HB 302 proves you can protect taxpayer money, diversify reserves, and future-proof state treasuries all while embracing the most secure monetary network on Earth. New Hampshire didn’t just pass a bill; it sparked a movement.”
#Write2Earn #BTC #BinanceSquareFamily #MarketRebound #SUBROOFFICIAL
Disclaimer: This article is for informational purposes only and does not constitute financial advice. Always conduct your own research before making any investment decisions. Digital asset prices are subject to high market risk and price volatility. The value of your investment may go down or up, and you may not get back the amount invested.

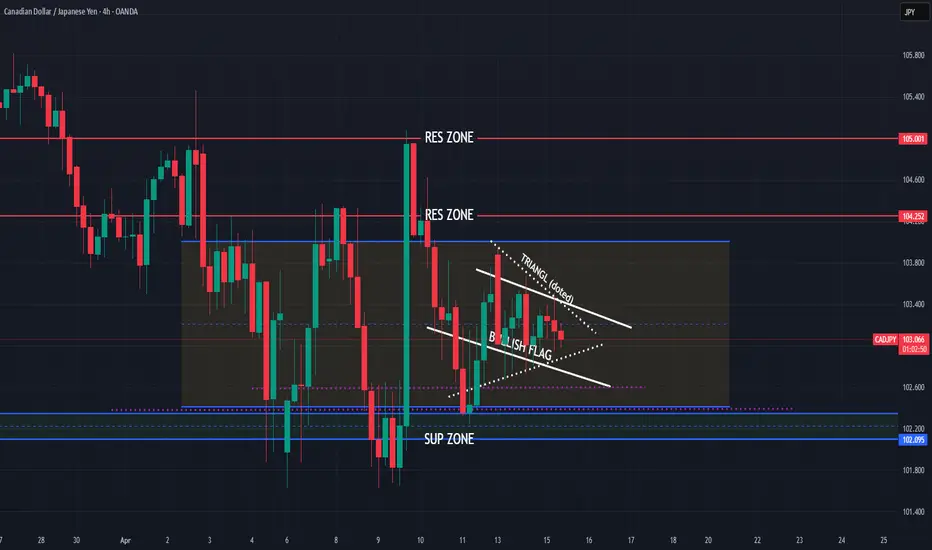
CADJPY structures created, having bullish view
Coming again on OANDA:CADJPY , analysis before this one closed manually, now having batter situation and sharing new view based on price action and patterns.
Few times price is bounce on zone 102.450. Now we have BULLISH FLAG (better visible on 2,1H TF) and we have TRIANGL formation, tomorrow BAC rate cut and some pairs like EUR and GBP versus CAD looks like will go bearish.
View is here bullish for this week.
SUP zone: 102.400
RES zone: 104.250, 105.000