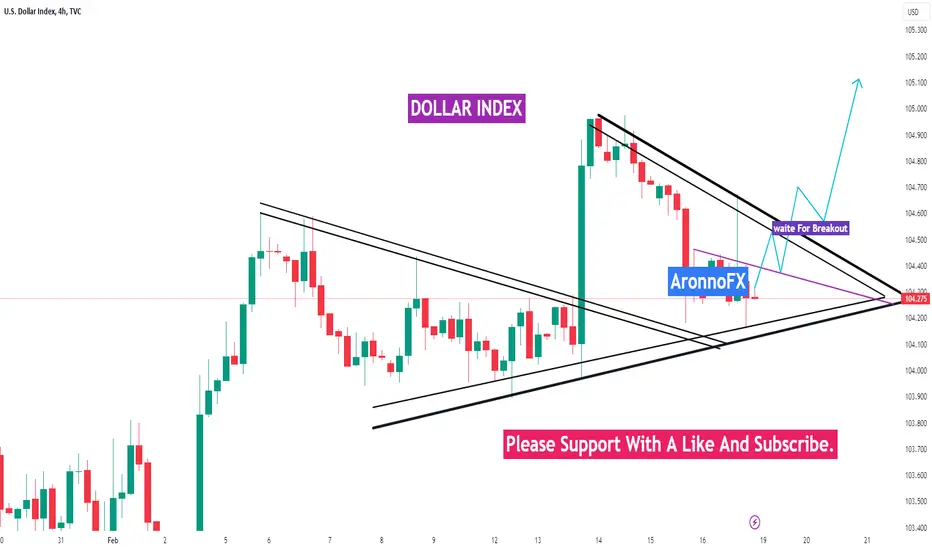
Dollar Index Analysis.......
Hello Traders, here is the full analysis for this pair,
let me know in the comment section below if you have any questions,
the entry will be taken only if all rules of the strategies will be
satisfied. I suggest you keep this pair on your watch list and see if
the rules of your strategy are satisfied.
Dear Traders,
If you like this idea, do not forget to support with a like and follow.
PLZ! LIKE COMMAND AND SUBSCRIBE.
Pennant
KASPA price prediction short-termIs kaspa will make .183 before retracing or it will go down to .145 before pumping again :)

Ripple can decline to 0.5315 points, breaking support levelHello traders, I want share with you my opinion about Ripple. By observing the chart, we can see that the price some time ago broke the 0.5180 support level, which coincided with the buyer zone and declined below. Then the price turned around and started to rise in an upward channel, where XRP soon broke the 0.5180 level broke it again and rose to the resistance line of the channel. After this, the price bounced down from this line and declined to the buyer zone, where it exited from the channel and entered to upward pennant, in which Ripple turned around and then it rebounded from the support line and made a strong upward impulse to resistance line, thereby breaking 0.5500 level, which coincided with resistance area. But a not long time ago price rebounded from this line and declined to 0.5500 current support level, and at the moment price trades very close to this level in the resistance area. So, in my mind, Ripple can exit from the pennant, break the support level, and continue to decline. For this reason, I set my target at the 0.5315 level. Please share this idea with your friends and click Boost 🚀

VTHO - 1H - $0,01 - 85% increase possible - Bullish penantVTHO show on the 15 min. And 1H chart a Bullish penant with both a target around the $0,01. This could lead to another 85% profit approx.

ARM Double Inside Day CandlesARM is working on a double inside day after the massive run up. Tightening now and looks ready to explode higher tomorrow. A red to green open tomorrow could be perfect!

BUY Zone for INJINJ has a bullish run at the start, and is consolidating and forming a penant.. Buy zone is mentioned on Chart.
INJ is the most bullish project this season.

Neutral - Watching Pennant/Triangle Consolidation PatternCisco is having trouble getting past the high from the tech bubble at the turn of the century. Keeping an eye on this chart pattern that has formed as it consolidates (may take several more years to play out). I won't short if it breaks down, but I'm watching for a potential upward breakout to trade on (looking for a decisive monthly close above the green tend line ideally with significant volume).

Breaking out of a bullish flagNASDAQ:EA has broken out of the flag pattern and has lots of upside. I'm looking for ~160 as a price target.

This will be interesting|Oil Mid Term PlayLets focus on Feb.'23. Price came from a downtrend, and consolidated under its last support structure to only selloff again.
At the same time, price has been coiling for a move to the upside. This is where we go from $67 to $94 and the range is now formed.
Fast forward till today and yet again we have similar price action like we did last year around today.

TOTAL 3 ~ Potential Breakout in April 2024TOTAL 3
Altcoins minus BTC & ETH
✅Price has broken above the 200 DSMA
✅Price has broken out of the pennant
⏳126th week is 1st April 2024
Earlier today I shared TOTAL 2 which includes CRYPTOCAP:ETH and suggested that including ETH altseason could initiate from Feb/Mar 2024.
TOTAL 2 breaking out ahead of TOTAL 3 makes a lot of sense as this is what has happened in prior cycles
FIRSTLY, bitcoin leads the whole market like it has been.
Secondly, liquidity moves into Layer 1 altcoins like CRYPTOCAP:ETH , CRYPTOCAP:ADA & EURONEXT:ALGO = TOTAL 2 in Feb/Mar
Thirdly, liquidity moves into Layer 2 altcoins like CRYPTOCAP:IMX , CRYPTOCAP:MATIC & NASDAQ:OP (TOTAL 3 in Mar/Apr)
After that the Memecoins and shxtcoins have their wild runs, which usually coincides with peak euphoria and the end of the bull market or a sizable correction. This is why you leave the gambling with small small positions until later in the cycle for those memecoin plays.
I hope this helps you frame the timeline of the market in you mind. It may not happen exactly as outlined with the dates but the sequence will likely be the same so we can watch out for Layer 1's and Layer 2's moment next.
PUKA

TOTAL 2 - Feb/Mar 2024 Key Months for bullish price action TOTAL 2
Crypto Total Market Cap Excluding BTC
✅Above 100 week SMA
✅End of 149 week Cycle (new bull cycle starts)
✅Break above POC
🚨One last pull back (Make it count)
March 2024 is looking like a key month
(You have 4 weeks ~ dip the beak)
We watch for a failure too, if we lose the 100 week (first warning) and if we exit the lower pennant with a close....GET OUT.
PUKA

Is a Rally Brewing? Technicals Signal Bullish Sentiment for AMDAMD Chart Analysis: Potential Bullish Signal on 4-Hour Timeframe
I've observed a potential bullish pennant pattern forming on the 4-hour chart for AMD. This pattern often precedes price breakouts, with a target of $230 based on standard technical analysis measurements. However, it's crucial to remember:
Technical analysis is not a guarantee of future results: Past performance doesn't predict future outcomes. Consider this pattern as a possibility, not a certainty.
Thorough research is essential: Conduct your own research, analyze fundamental factors, and understand the inherent risks involved before making any investment decisions.
Risk management is paramount: Always prioritize risk management strategies like stop-loss orders, regardless of technical signals or price targets.

Alchemix ($ALCX) Bullish OutlookAlchemix ($ALCX) is so undervalued right now, a hidden gem of De-Fi projects.
Falling wedge spotted in 1W time frame, if the price break the swing high then we are good to go. My target is the first major resistance/supply area around 250-400 USD. Don't miss out on this, atleast buy some small amount you will thank yourself in the future.

BTC might move back inside the ascending channelThe shoulder head shoulder pattern may result in an upside move. Long trade can be opened if BTC can make a nice retest coming out of the ascending triangle.
In case of a rise, the 44k level will be quite critical. If it goes above this level and makes it a support level, the rise may continue until the top of the channel. If it cannot close above it, a retreat to current levels is possible.

Watching to see if we break the up side of a long term triangleNASDAQ:EA The daily chart shows a pennant forming, which has been broken by closing above the top of the pennant @ $140.
In the weekly view (shown here), there's a triangle pattern. Top of the triangle is ~$151 and was established in 2018 and tested in 2021. If the top of the triangle is tested and broken (closing above $151 for the week), then this has a lot of upside.
If $151 is tested and rejected, then we're heading back down to test the lower edge of the triangle.
Good Luck!

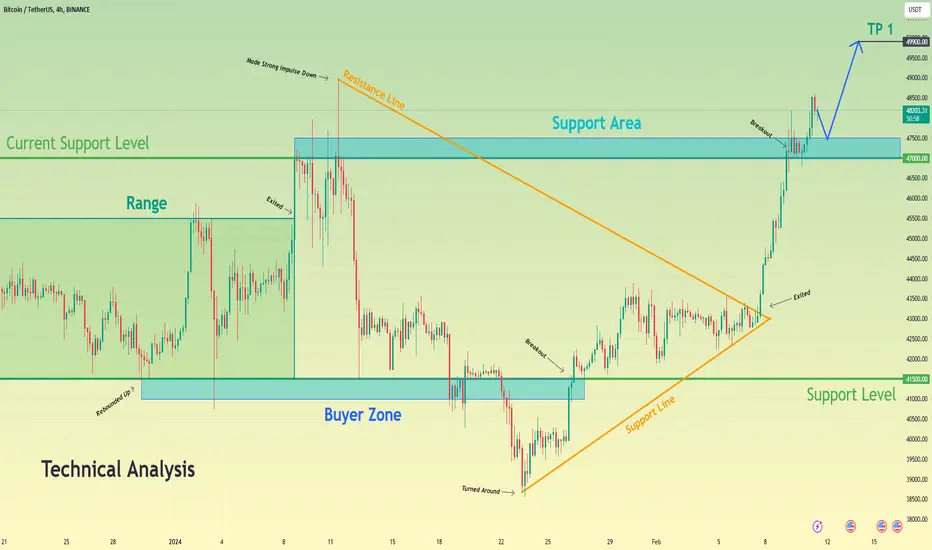
Bitcoin can little correct and then continue to move upHello traders, I want share with you my opinion about Bitcoin. Observing the chart, we can see that the price some days ago traded in the range, where it firstly declined to the 41500 support level, which coincided with the buyer zone, but soon BTC turned around and made impulse up higher than the bottom part of the range, thereby exiting from it. Next, the price entered to the pennant, where it rose to the resistance line, after which it made a strong downward impulse to the support line, thereby breaking two levels - 47000 and 41500. Later price turned around from the support line and in a short time rose higher than the 41500 level, breaking it one more time and little time later BTC reached the resistance line of the pennant and broke it too, exiting from the pennant pattern. After this movement, Bitcoin rose to its current support level, which coincided with the support area, and recently broke it also, after which the price made a retest and continued to move up. At the moment, the price trades near the support area, and in my mind, Bitcoin can correct to the support area, and then BTC will bounce and continue to grow. For this case, I set my target at the 49900 level. Please share this idea with your friends and click Boost 🚀
SUPER ANALYSIS🔴 #SUPER Analysis : ❓❓
🔮There was a formation of Bullish Pennant Pattern in #SUPER and breakout the pattern with good volume. We may see a rise in #SUPER📈📈
🔰 Current Price: $0.9097
🎯 Target Price: $1.1652 and more
⚡️What to do ?
👀Keep an eye on #SUPER price action. We can trade according to the chart and make some profits. Stay tuned for further analysis and stay updated with market sentiments and news.⚡️⚡️
🏷Remember, the crypto market is dynamic in nature and changes rapidly, so always use stop loss and take proper knowledge before investments.
#SUPER #Cryptocurrency #TechnicalAnalysis #DYOR

I Cannot Short This !!! Hi every one
➡️SOL has done a Impressive Movement recently but the odds of another bullish Movement is Pretty high because the pattern which SOL is in, Is a Bullish flag Pattern ! Since The break out has not happened, there is no confirmation of a Bullish Movement But If It happens, we Can Expect a Bullish Movement as much as the Measured Price movement ( Flag pole ) to happen!
🟡 Summery:
- SOL has been Bullish Recently!
- The odds of another Bullish Movement is High!
- Bullish flag is Visible on The chart!
- No break out yet!
- Bullish Divergence
🤑 Stay awesome my friends.
_ _ _ _ _ _ _ _ _ _ _ _ _ _ _ _ _ _ _ _ _ _ _ _ _ _ _ _ _ _ _ _ _
✅ Thank you, and for more ideas, hit ❤️ Like ❤️ and 🌟 Follow 🌟!
⚠️ Things can change...
The markets are always changing and even with all these signals, the market changes tend to be strong and fast!!

I Cannot Short This !!! situation+next targets.Hi.
COINEX:LSKUSDT
-has formed a bullish pennant pattern on the 4-hour timeframe.
-A breakout above descending resistance could lead to a pump higher🚀
_ _ _ _ _ _ _ _ _ _ _ _ _ _ _ _ _ _ _ _ _ _ _ _ _ _ _ _ _ _ _ _
✅Thank you, and for more ideas, hit ❤️ Like ❤️ and 🌟 Follow 🌟!
⚠️Things can change...
The markets are always changing and even with all these signals, the market changes tend to be strong and fast!!

AMD Beautiful Consolidation into PennantAMD is consolidating really nicely after making new highs in late January. Surfing the 20 EMA on the daily chart as well. This will be a top focus for me heading into next week.

Bitcoin Pennant spotted!Looks like Bitcoin´s current correction is now ready for an uptrend rally, or about to be.
I have spotted a traditional "pennant formation" which could shoot up to $48250-$48700 or perhaps even touch/briefly break, the prior $49000 "Bitcoin Spot ETF" high which took place Jan 11, 2024.
Entry points should be sought after pullback, at the $43380-43400 area or so.
Have a nice (LONG) trade.
:)

ACE looking bullishJumping in on 5X long on ACE, looking good here. ACE has very limited supply as of now, & can be manipulated easily, But I think it's a good trade so I got in. NFA

FG - F&G Annuities and Life - Pennant Breakout ImminentF&G is an annuity and life insurance company.
Annuities and Life Insurance have been enjoying a good run due to higher interest rates.
High interest rates decrease reinvestment risk.
For annuities, higher interest rates mean higher income for customers.
Baby boomers are retiring so there will be a massive demand for these products. The fixed income part of it would be the seller even if rates go down from here.
Chart has formed a pennant and will go long on the breakout.
Initial target around 60 as there is a bull flag element from 32 to 47.
