#FXinsights #TradingViewTOOLKIT JAN 2019 CAD inFOCUS FollowupSEE USDCAD TRADE Dec 28 2018 >>>
FollowUP CHARTS ON d61! Reversal (see MY #fxinsights #tradingviewtoolkit hashtags on TWITTER)
Make sure to see cisTRADING website/twitter/tradingview idea feed for INFO ON #TradingViewTOOLKIT ... I have offered it for sale at ONLY $0.25 per client at tradingview for a total of $1,000,000 ... BEST IN INDUSTRY TRADING SYSTEM ...
D61!
USDCAD
GBPCAD
CADNZD
Pinescript

#FXinsights #TradingViewTOOLKIT Jan2019 \/Bonds /\Yields inFOCUSOriginal charts of these trades available at thinkorswimTOOLKIT.com with #TradingViewTOOKIT link
US10YR LONG YIELDS
Short @ 3.11 targeting Jan 2018 levels 2.55
NOW LONG BIAS from 2.55 with Key Levels, MarketDEPTH, and proMETRICS
Momentum Metric Reversal (thin histogram line with "The Great Gatsby" Alert and Cloud Oscillator) [ ] Price Action Metric Reversal is when the histogram column reverses higher than 2 bars previous at peak high /low
ZN1! SHORT 10yr NOTE
Short 122'22'0 / 121'12'0 TARGET LEVELS 121'11'0 121'19'0 119'26'0
Price Action Reversal SHORT with "The Great Gatsby" Alert signal [ ]
Momentum Metric Reversal (thin histogram line with "The Great Gatsby" Alert and Cloud Oscillator) [ ]

#FXinsights #TradingViewTOOLKIT EURCHF "Diamond" DailyEURCHF
LONG Daily "Diamond" "The Great Gatsby" Alert with Price Action Reversal and Momentum Reversal
TARGET 1.13075
EURCAD
EURGBP
EURUSD

#FXinsights #TradingViewTOOLKIT "lil pop!" "All 4 One" es/ym/nqTOTAL BULL!!! really??? yep!
All 4 One Patterns all indexes
Price Action Metric Reversals
Momentum Metric Reversals
Yields Reverse Higher / Notes Top Off
EXPECT SHORT TERM "LIL POP!" >>> THAT MEANS SELL WHERE THE BLUE LINES ARE UNTIL YOU SEE BLUE CANDLES AGAIN
"BE A MARKET MAKER" - what is the problem??? BLAH!
MarketDEPTH increasing++++++
higher trend low
BLAH! that's hebrew for "no way!"
ES1!
YM1!
NQ1!

#FXinsights #TradingViewTOOLKIT Developing in FOREX A61!#cisTRADING NEXTinFOREX trade this month is D61! Canadian Dollar Futures
BUT... DEVELOPINGinFOREX trade this month is A61! Australian Dollar Futures
EXPECT ANY STRENGTH SHORT TERM TO FAIL... Another move down before AUD really finds its market!
MarketDEPTH is increasing and there should be a #cisGGMarketDEPTH HIGHER PEAK HIGH greater than 371 pips into 400's


#FXinsights #TradingViewTOOLKIT GBPCAD "Diamond" Monthly "Diamond" Reversal Monthly FollowUP
See RT GGproMETRICS MarketDEPTH & cisTRADING proTRADER LEVELS
Search "Keywords" Online>>> cisTRADING thinkorswimTOOLKIT tradingviewTOOLKIT GreatGatsbyProTrader
GBPCAD Daily MarketMaking Low Pin TOP

#FXinsights #TradingViewTOOLKIT Price Action Reversal EURUSD Price Action Reversal SHORT
"The Great Gatsby" Reversal
Search "Keywords" ONLINE>>> cisTRADING TradingViewTOOLKIT thinkorswimTOOLKIT GreatGatsbyProTrader

Looking for feedback on an indicator I'm developingI've been working on an indicator to help me out with swing trades and buying the right dips, and knowing when to sit out. I'm new to trading and I find that breakout trading isn't the best strategy, and it actually rarely works when we're in a downtrend as we currently are.
So how to have the confidence to know which dips to buy?
Here's a strategy I'm playing around with and I'd love to get your feedback.
Am I missing anything? Are there other indicators with similar strategies you can point me to? Leave a comment and let me know!

Bitcoin Bullish / Bearish Volume-Based Trading StrategyCustomized Net Volume strategy to help anticipate short-term bullish or bearish market trends for volatile assets.
VHigh and VLow Entry and Exit lines are used for shorts or longs. When the volume crosses each designated line, a short or long is put in place.
In Bullish markets, a lower VHigh and higher VLow will increase Longs and Decrease Shorts. In Bearish markets, a higher VHigh and lower VLow will increase Shorts and Decrease Longs.
This example has yielded over 13% Net Profit on BTC from Sept. - Nov. 2018 during Bearish conditions.
** VHigh and VLow must be customize by market conditions and time scale or backtesting will not be accurate **

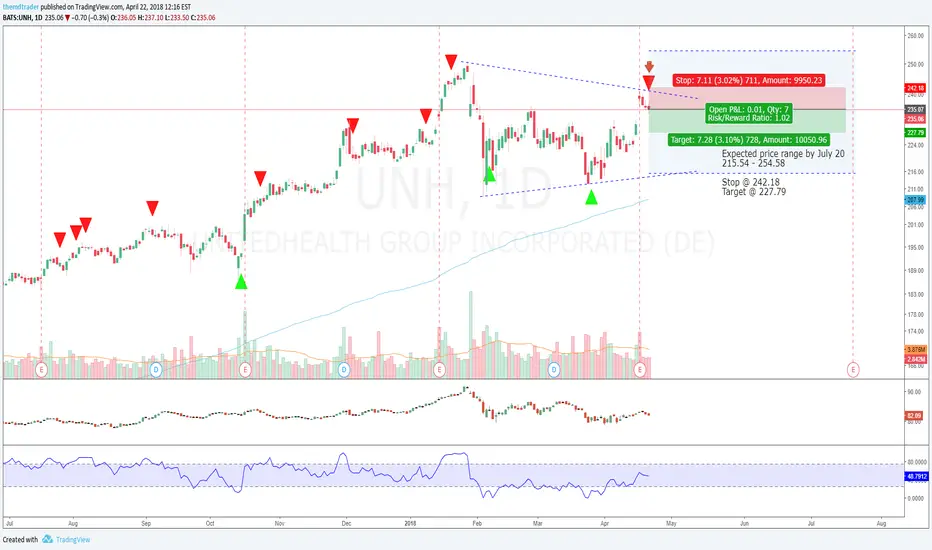
UNH - Slowing Down or Beginning of The End?This stock has been one of the best winners in healthcare over the past few years, in terms of company health, profitability and correlation to stock price action.
All the same, just like with A , the current market uncertainty has left the stock here in a wedge pattern after its earnings report.
Even though the earnings beat estimates, it was not better than the prior growth experienced and so combined with the overbought nature of the stock, this could be a sign that the stock is topping out at least for now.
In short, if the company fails to keep growing, fear could set in and investors will go ahead to ease off the gas pedal, leading to a possible bearish trend.
For now, I am looking for a bearish drift after earnings, but I look to stay longer if a bearish trend develops; losses will be cut quickly.
Stop @ 242.18
Target @ 227.79
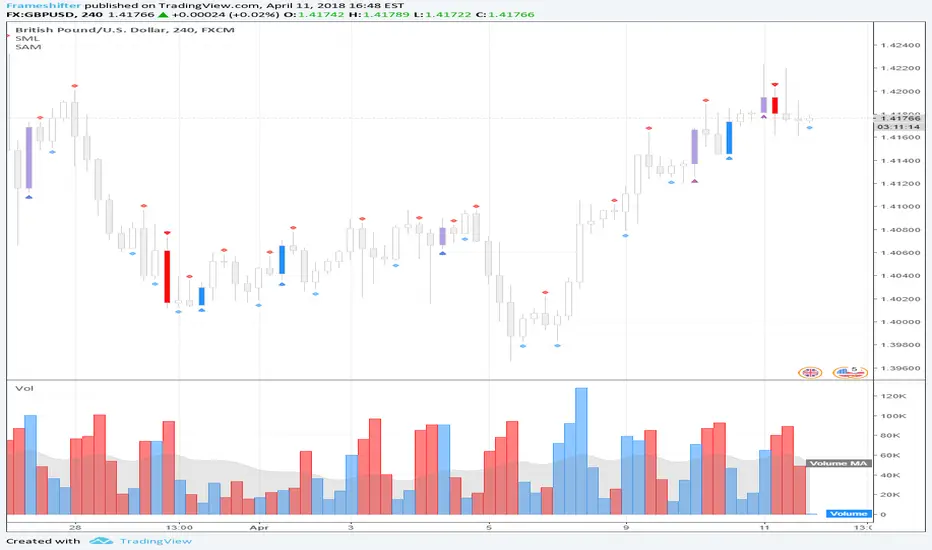
More progress on the initial visual debug systems (GBPUSD).Got a little closer to one of the debug modules being finished which should then be easy to port over for the rest of them. Then the real fun begins. This chart is GBPUSD Four Hour and shows the indications for raw S/R levels (Without volume checks) and some basic raw patterns (No proper volume pr range checks) The debug modules are the hardest part when porting over years of work but once one is done, it should translate pretty quickly to others (I hope heh)
Thanks for the encouragement and follows.
Showing the capabilities of what I call Fractals (SHS and iSHS)We all know how to calculate a possible target when a a SHS or iSHS appears with a horizontal neckline mirroring the top-neckline distance. What is less known however, is the fact that sloped necklines can also be very supporting. In that case you take the point of the bar connected to the neckline with the greatest distance to the Head. In my example you cannnot recognize a SHS, but as you can see it workes (this time...) the same and also very accurate in this case!
I'm planning to make a Pine script to calculate the target value and to add that value as text and a horizontal line on that target value to the graph as in this example. I'm however completely new to Pine scripting. So, if anyone can give me some inside how to find the values where the bars are connected to my blue 'neckline' I would be very grateful!

indicator wishWish i had this realtime indicator on the right side of any current candle.
It's really just the price/range indicator we now from TW's left side tools menu.

New Video Tutorials - Coding Custom Indicators - Ask Questions!I am currently recording a Video Tutorial Series on PineScript...Creating Custom Indicators.
ASK QUESTIONS BELOW....QUESTIONS WILL BE ANSWERED IN ON-GOING VIDEO SERIES.
Each Video will be 10 Minutes in Length, Covering a Specific Topic.
I will Start By Taking A Common Indicator Like the MACD and Starting From The Very Basics, Then Adding In All Customizable Options.
Topics Include:
- The Basics You Need To Know.
- Available Reference Materials.
- Creating Custom Colors Based On Conditions.
- Changing Bar Colors Based On Conditions.
- Using Multi-TimeFrames.
- And More...
We Will Have Guest Appearances From Some Of The Top Coders On TradingView Showing Advanced Techniques!!!
We Will Also Cover Other Types Of Indicators!!!
ASK QUESTIONS BELOW...ANYTHING REGARDING CODING IN PINESCRIPT.
QUESTIONS WILL BE ANSWERED IN VIDEO SERIES.

Price Action Indicator - Price Patterns That Work! Price Action Indicator - Price Patterns That Work!
9 Minute Video Goes Into Detailed Explanation
4 Simple but Effective Price Patterns!
Yellow = Inside Bar – Breakout Patterns
Orange = Outside Bar – Breakout Patterns
Green/Red = Pin Bars
Aqua/Fuchsia = Shaved Bars
***MANY Features and Customizing Options…Detailed Overview In Video.
How To Turn Bars Patterns On And Off.
Ways To Customize.
General Thought Process of the 4 Price Action Patterns.
What Each Setting in the Inputs Tab Does.
***Special Announcement. Video Below Just Updated. Received a Special Promotion from the creator of these Price Action Bars and Many other Price Action Setups. Hedge Fund Manager and Founder of 2ndSkiesForex.com Chris Capre.
1st 10 minutes of Video is covering throughout process and how to implement the Indicators.
2nd 12 minutes covers a Special Promotion offered to TradingView members directly from Chris Capre.
Video Link Below.
vimeopro.com
This Version of the video will be taken down 2/01/2015 and the original video will be uploaded again.

New Intra-Day Gap Indicator. V1 - More Features Coming Soon!CM_Gap_Indicator_Intra-Day_V1
This is a Simple Gap Indicator.
Version 1…Many Additional Features To Come.
***Designed for Intra-Day Charts.
***Great for Stocks…Forex and Futures Sunday Night Gaps.
***Plots Green Lines If Gap Up
***Plots Red Lines If Gap Down
Additional Filters Coming Soon:
***Minimum Gap% Filter
***Gap Mid Lines
***Color Coding On Filled Gaps

Williams Vix Fix -Major Update -Filtered Entries - Much MoreNew CM_Williams Vix Fix_V3 - Major Update - Filtered Entries - Additional Alerts - And Much More...
***01-05-2015 Major Updates Include:
***ALL Features Available To Turn On/Off On The INPUTS Tab!!!
FILTERED ENTRIES -- Plus AGGRESSIVE FILTERED ENTRIES - HIGHLIGHT BARS AND ALERTS
*Alerts Enabled for 4 Different Criteria
*Ability To Plot Alerts True/False Conditions on top of the WVF Histogram
*Ability To Turn Off the Histogram and just see True/False Alerts Conditions.
*Ability to Turn All Price Bars Gray, and Color the Price Bars to Match the WVF Colors Exactly, Including All 3 Entry Types.
*Added Inputs To Adjust the 3 Numerical Inputs That Define The PRICE ACTION FILTER! Explained in Video.
*Main Video is 34 Minutes…However, the New Features Are Extensive and I Go Thru All Features In Depth.
*I Recommend Using the VSTOP Indicator. I Go Through How To Customize It In Video.
Videos:
Video: The Evolution of the Williams Vix Fix - 12 Minutes.
vimeopro.com
Video: Williams Vix Fix V3 - Major Update - Additional Alerts and Filtered Entries - 34 Minutes.
***Video Covers In Detail How To Use The Multiple Alerts And Plot Styles Available.
vimeopro.com
Posts To Reference…
New Video on How to Create Alerts W/ Any Custom Indicator.
www.tradingview.com
Great Confirming Indicator for the Williams Vix Fix
CM_WILLIAMS_VIX_FIX FINDS MARKET BOTTOMS

New Donchian Channels Modified_V2 With Alert CapabilityBelow are links to 2 updated indicators with Alert Capability...
***This Indicator was created by user Request to Add Alerts Capabilities for Donchian Channels.
New Features:
***Alerts Work - Ability To Create Alerts From Main Indicator.
***Can Also Be Used In Conjunction with Lower Indicator - CM_Donchian Channels Modified_V2_Lower_Alert
***Added Ability To Turn On/Off Highlight Bars.
***Added Ability to Turn On/Off Donch Channel Midline
***Added Ability to Turn On/Off Triangles That Plot At Top and Bottom Of Chart When Breakout Condition is TRUE.
Special Indicator Features:
***Ability To Use Different LookBack Period on Upper and Lower Donch Channel Lines.
How To Create Alerts:
***Create Alert by selecting Indicator - Either the name of the Upper Or Lower Indicator...
***Then select either Alert Breakout Upside or Downside(To The Right Of Indicator Name)
***Select Greater Than
***Select Value
***For Value put .99
Original Post Explaining Indicator is -
***If You Need Help Getting Custom Indicators to Trigger Alerts then View This Post.

Famous Filtered Pivots Indicator - Many Time Frames Available!!!CM_Pivot Points_M-W-D-4H-1H_Filtered
***Special Thanks to TheLark...AKA...The Coding Genius For Providing His Expertise...
***New Feature - Ability to turn On/Off Pivot Moving Average
***New Feature - Ability to turn On/Off Filtered Pivots (Explained Below)
Available Timeframes (Change In Inputs Tab):
1 Hour
4 Hour
Daily
Weekly
Monthly
Yearly
***All Features Available in Inputs Tab
-Ability to Plot just 1, or all Pivot Timeframes
-Defaults to Monthly Pivots
-Ability to turn On/Off Pivot Moving Average
-Ability to turn On/Off Filtered Pivots
-Ability to Plot S3 and R3 on 1 Hour and 4 Hour Pivots
***FILTERED PIVOTS!!!
-THIS IS A WAY TO FIND THE HIGHEST PROBABILITY MOVES
-IF CURRENT PIVOT IS GREATER THAN PREVIOUS PIVOT (INCLUDING MARKET THRESHOLD CALCULATION) THEN PIVOT, S1, & R2 PLOT
-IF CURRENT PIVOT IS LESS THAN PREVIOUS PIVOT (INCLUDING MARKET THRESHOLD CALCULATION) THEN PIVOT, S2, & R1 PLOT
-***THIS IS A WAY TO FILTER OUT PIVOTS AND ONLY PLOT THE LEVELS THAT ARE EXPECTED TO BE MAJOR SUPPORT AND RESISTANCE
***VIDEO COMING SOON WHERE i WILL GO OVER IN DETAIL THE THOUGHT PROCESS AND METHODOLOGY
Link To Code Below Under Related Ideas

ADX Trading System Overview! Link To Video!ADX System Overview
So I Came Across Another Trading System for Only $997. However, if you purchased in the next 24hours the whole system could be Yours For Only $497.
So I decided to Code it. This is only Version 1, and I discuss in the Video What I’ve found so for, some plans for Version 2 of the indicator, and I ask for your feedback on anything you find.
Indicators used in System:
CM_DI_Plus_Minus_V1 (Indicator On Bottom).
CM_ADX_V1 (Indicator On 2nd Pane).
CM_Gann_Swing_Hi_Lo (Indicator on Price Pane). This Indicator was published before…Link Below.
Link In Related Ideas Below
CM_DI_Plus_Minus_V1
Link In Related Ideas Below
CM_ADX_V1
Link In Related Ideas Below
In Video I go over settings and how to customize charts.
Link To Video:
vimeopro.com
Link To Downloadable PDF Shown in Video:
d.pr

New Pivot Bands Indicator W/ Link To Video Explaining Features!CM_Pivot Bands V1
Special Thanks to Michael S for Introducing Code.
Instead of a Long Write Up I Recorded A 8 Minute Video Going Into Detail On V1 Of This Indicator. Please View To See My Initial Findings, My Thoughts For V2, And Items I Need YOUR Help With!!!
In Inputs Tab Indicator Has Ability to Turn On/Off Multiple TimeFrames…Thought Process Explained In Video.
Link To Video:
vimeopro.com
Link To PDF Mentioned In Video:
d.pr

New Type of Indicator. Renko Overlay Bars.CM_Renko Overlay Bars V1
Overlays Renko Bars on Regular Price Bars.
***Color of Renko Open and Close Lines Change Based on Direction.
Default Renko plot is based on Average True Range. Look Back period adjustable in Inputs Tab.
If you Choose to use "Traditional" Renko bars and pick the Size of the Renko Bars the please read below.
Value in Input Tab is multiplied by .001 (To work on Forex)
1 = 10 pips on EURUSD - 1 X .001 = .001 or 10 Pips
10 = .01 or 100 Pips
1000 = 1 point to the left of decimal. 1 Point in Stocks etc.
10000 = 10 Points on Stocks etc.
***V2 will fix this issue.
