Pitchforks

GOLD, From 1150 to 1750 !! What happened?OANDA:XAUUSD
To see more clearly the explosion of the price of gold it is necessary to look at the Andrews's Pitchfork.
Indeed you just have to wait for confirmation of a rebound or a break to enter either SELL or BUY as shown on the graph! A principle that is simple but very effective as you can see!
The fork is a tool to integrate to better analyze!
If
For those who do not know how to use it please click here www.waldata.fr
If you agree with this idea please leave me a like and don't forget to subscribe!


Extend Your Trendlines, Pitchforks, and Fibonacci Retracements In this video tutorial, we quickly want to show you how to extend your drawings across your chart.
The steps to getting started are easy:
1. Draw a Pitchfork, Fibonacci Retracement, or Trendline on your chart.
2. Open the settings of your drawing.
3. Find and check the box that says "Extend Lines Left" or "Extend Lines Right"
We think this feature is an effective way for traders and investors to study significant price levels in the past and prepare for upcoming levels in the future.
If you enjoyed this video tutorial, please press like or leave a comment if you have any questions. Our team is here to help! You can read more about this release on our blog: www.tradingview.com

WAVE 3 OF WAVE C OF WAVE B WAVE 3 OF WAVE C OF WAVE B
TECHNICAL SL AND A REDUCED SL, WITH LESS RISK BUT WITH GOOD CHANCE OF NOT BEING TOUCHED. TAKING THE GUIDELINES OF THE TRIDENTS : IF AT THE BEGINNING OF A TRIDENT OF ONE HARMONIC (GARLEY IN THIS CASE) A 5-WAVE IMPULSE BEGINS, THE PRICE HAS 80% CHANCE OF REACHING THE CENTER LINE (DOTTED RED) AND NOT BREAKING THE SIDE LINES.
ONDA 3 DE LA ONDA C DE LA ONDA B
SI EL PRECIO TOCA LA LINEA LATERAL DE TRIDENTE , PROBABLEMENTE TOME OTRA ENTRADA.
SL TECNICO Y UN SL REDUCIDO , CON MENOS RIESGO PERO CON BUENAS PROBABILIDADES DE NO SER TOCADO . TOMANDO LAS GUIAS DE LOS TRIDENTES : SI AL INICIO DE UN TRIDENTE DE UN DE UN ARMONICO (GARLEY EN ESTE CASO) EMPIEZA UN IMPULSO DE 5 ONDAS , EL PRECIO TIENE 80% DE PROBABILIDADES DE LLEGAR A LA LINEA DEL CENTRO (ROJA) Y NO ROMPER LAS LINEAS LATERALES DEL TRIDENTE .


Double Top or Double Bottom or Triangle?We might have a different view of "chart pattern"...I'm inclined to Bullish View? How about You?

SP500 still on Red BullP/S: Unlike conventional, To have consistent Elliott wave counts,there is ONLY 3 subwave ( abc ) counts on ANY Impulsive wave (1,3,5) VS conventional counts which is 5 subwave (1,2,3,4,5)


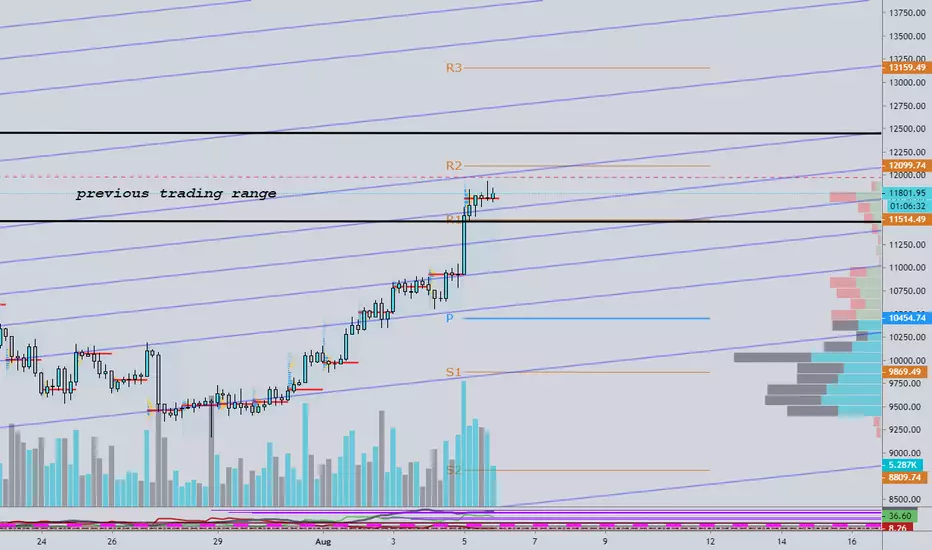
BTC 4H Look with Pivots and a Fork to get a grip on it . Hi .
Thank you for looking . . Its hard ATM for anyone to predict whats going on . I was trying to put some sort of channel on this and after doing so I dragged the pitchfork and they mach perfectly so why bother ... I think this is good look for now with this price moves . We can still see accumulation on smaller time frames witch its conforming the trend .. Until we see major sales accruing we are marching up for now looks like .. Pivots are great to see the trend . I have Weakly pivots in place to give us and idea and support zones . We are currently in trading range from previous run . Historically we accumulated in this zone around EQ and then pushed thru . If we see some major problems with this area we have to consider other options then straight bull run and hitting previous high . I will follow with my other platform soon waiting for big cluster to tell us whats going on. For now there are small sell and buy orders going thru . But staying in positive delta Makes me think we going Up and to hit the top of that channel before some pull back .
Happy Trading . Thumbs up keeps me motivated so if you like my content hit one .
MAYBANK (1155): MALAYAN BANKING BHD For Education Purpose ONLY
Murphy's law : "Anything that can go wrong will go wrong". So?!! Cut lost , cut lost AND CUT LOST!! If anything wrong!
P/S: Unlike conventional, To have consistent elliot wave counts,there is ONLY 3 subwave ( abc ) counts on ANY Impulsive wave (1,3,5) VS coventional counts which is 5 subwave (1,2,3,4,5)

Is it a Pendulum-Swing, a Swing, or a Pivot?That's a question many traders have.
Unfortunately only the minority can identify the real Swings & Pivots in the markets correct.
Go to the Blog of my website and learn this simple rule and read how you can implement them in your trading.
Maybe your PNL will skyrocket too...
P!

ANDREW'S PITCHFORK BASIC TRADING GUIDE FOR TRADER ANDREW'S PITCHFORK
BASIC TRADING GUIDE
FOR TRADER
by Shah Mohammad - XIG Markets Analyst
shah.mohammad@xigmarkets.com
Andrew's Pitchfork's Rules
Before and during trading always remember:
1. The probability of price movement
towards the median line is high.
2. When reaching the median line,
the price movements will reverse
or exceed the median line
and continue the movement.
3. After passing the median line,
the price will retrace and retests
the median line then continue the movement.
4. The price movements will usually be reversed
at any median or the lower parallel and upper parallel line.
Reference:
Bahasa Melayu
www.mydagangan.com
English
www.investopedia.com

Structures: Minor into a major.Just take a minute and study this chart.
Price has often the tendency to morph from a minor structure into a major one.
However, there are similarities and we can find them out by understanding the connections between the movements of price.
Study the chart peace by peace and you will learn more then if you read a new book about a new trading setup...
P!
...if you like what you see, how about learning how the Pitchforks work? Take my free ForkTrading BLUEPRINT course. Just register and you're good to go. Happy learning!

Pitchfork Trading - Video 1Video Nr. 1
I explain the quick principals of the Pitchfork and how we use it.
Parallel to the educational benefit, you get the analysis of the NQ and a good feeling, where we are in the whole big picture.
If you like to learn more about the Pitchforks and how they produce great trades, then here's how you can get your free course:
1. Klick the link at the bottom to get to our website.
2. Register for the FREE MEMBERSHIP
3. Login and start the course
Thanks for watching and if you like it, give a thumb up :)
P!

GOLD replay from 2014 using pitchfan as a projection tool.Nesta and I were throwing some projections on to gold, backtesting something we had looked at with the upward trend lines because I have noticed when I drop the trend lines on, the angles seem to follow some very fibonacci-esque ratios. So we decided to backtest with the pitchfan and see what we saw. Very interesting stuff.

AUDUSD Keep pounding - Watch the details!The yellow Fork describes the current most probable path of price. Forks are great, indeed. And adding details to the chart is like seasoning a sauce.
So here we have our ingredients.
See the up-sloping red lines? Know what's their job? Well, they describe the amplitude of the sine-wave within this down-swinging market.
The last one...watch the last one...looks like something disturbs the harmony. Something going on?...change ahead?
We dunno...and we don't have to know!
Why?
Because as a Forker you just follow your set of rules. So is it worthless marking out these details?
Nope!
You really should pay attention to them. Make notes about your observations every time you see something new or interesting. In the long run, this is one edge more you have, a new side-rule for example which can act as a filter, an entry signal or a warning sign.
So, pay attention to these details use these observations as a takeaway from your chart work, even if you don't get a trade right now.
P!

GBPUSD - Win free knowledge!Hey, want to learn something today?
OK, participate and answer the following question:
Which is the most probable target and why?
1 - white Centerline
2- yellow Centerline
3 - white U-MLH (Upper-Medianline-Parallel)
4 - yellow U-MLH (Upper-Medianline-Parallel)

GC - Gold...hmmmm...?!?Right side of the chart:
See how it broke the last time?
There was a retesting at the L-MLH (white) going on. Then in the middle it pierced the upsloping orange, dotted Pressure-Line.
Now, compare it to the actual situation...
One of my coaches in the earlier days always told me: "Before you cut meat, you must sharpen your knife".
In Trading the Grindstone is called "observation". Let's learn to earn...
P!

How Action/Reaction worksMany weeks ago, I freshly published this chart. I wanted to make a longterm project out of it.
The idea behind this chart is, to show you LIVE how pure Action/Reaction works - and that it's not a mystery, fake or something "balloonie".
Here you have 5! reactions in a relative short period of time. Let's go through them right now:
1 Overshoot and fall back to...
2 ...last magenta A/R line, which provided support.
3 Price drops from prior support down to the next line, but creating, what we at ForkTrading call a confirmed "Hagopian" (you learn about this in my free ForkTrading BLUEPRINT).
4 From 3 price moves up and reacts even three times at the magenta A/R line, bouncing it's head on it, before moving up to the magenta A/R line, just to find resistance and...
5. drops back to the magenta A/R line again where it finds support.
What do you say now?
On my website you find a free subscription to start learning the Basics of ForkTrading, which stems directly from Action/Reaction, but offers much more room for trading then just plain Action/Reaction.
I appreciate you thumb up and would love to have you on board in our ForkTrading Group soon.
P!

Swing & Pivot Rules - Extreme ExampleMy rules for Pivot & Swing Highs/Low says:
If a H. is broken, the L. is confirmed.
If a L. is broken, the H. is confirmed.
Just with these simple rules one is able to enhance his ability to analyze markets dramatically.
Like these information?
Watch the footer where the links are placed.
P!
