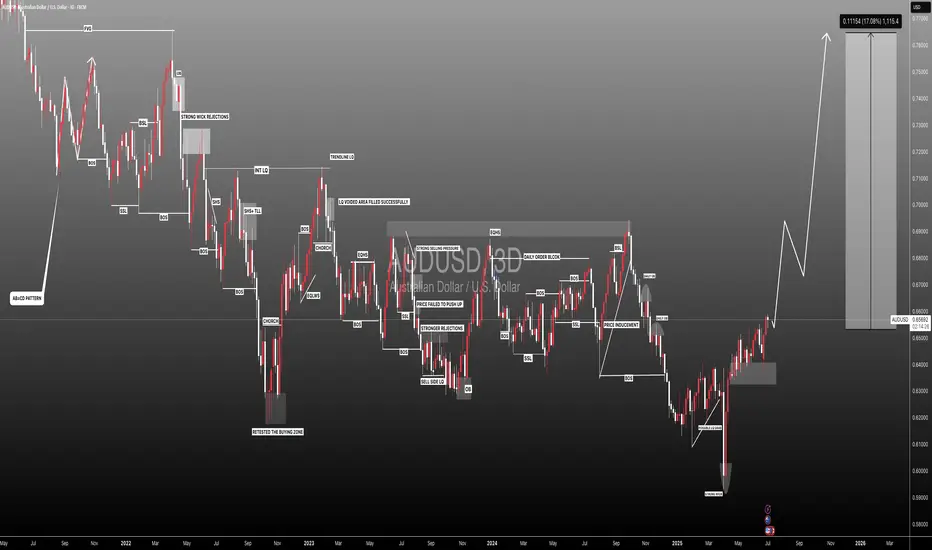
#AUDUSD: +1100 Pips Possible Swing Bullish Move! AUDUSD a strong sign of bullish behaviour has appeared alongside bullish momentum. As we have NFP tomorrow, we expect market to remain volatile; what we think now is to have market settled down before we can have any confirmation. We recommend to remain extra cautious tomorrow, once market get settled we can then enter with accurate risk management.
Like, comment and Share for more!
Team Setupsfx_
Pivot Points
GBPCAD: Perfect Buying Opportunity In Making Worth 1000+ PipsDear Traders,
The GBP/CAD pair is at a turning point, and it might just reverse! Recent market data indicates a strong upward trend, with the pair gaining over 1000 pips in the last cycle. This surge is backed by increasing trading volume and a convincing week-closing candle, with smaller timeframes also showing the momentum shift.
📌Looking at the financial side, the pair has appreciated by 6% from 1.6700 to 1.7700 over the past month. Average daily trading volume has increased by 18%, and the volatility spikes have created swing opportunities. The 14-day ATR is 0.0125, suggesting a daily range of about 125 pips. Monthly pivot levels hint at possible support around 1.7450 and resistance at 1.7850, which aligns with our target zones.
📌We’ve identified two target levels: near 1.7800 and around 1.7950. If the price breaks through the initial resistance, momentum could push towards the higher target, potentially adding 150 pips. Traders holding standard lot positions could expect a gross movement value of £1,000 per 100 pips, assuming proper risk management.
📌Recent economic data seems to favour the GBP. The Bank of England’s focus on controlling inflation and the slight contraction in Canadian trade balances support this. The CAD’s connection to crude oil is still a factor, and any drop in oil prices could further boost GBP gains. Overall, the forex market’s liquidity conditions suggest that GBP/CAD is sensitive to macroeconomic catalysts.
Trading Plan📊🧠
- Use the 4-hour timeframe to find an ideal entry point near the 1.7500 support area.
- Aim for a risk-to-reward ratio of at least 1:2, considering a larger stop-loss of 80–100 pips to handle volatility spikes.
Set your first take-profit at 1.7800 and think about closing a portion of your position. If the price action confirms the breakout, adjust your stop-loss to breakeven and target 1.7950 as your secondary goal. Keep an eye on volume and candlestick patterns around key levels, as these will help you decide whether to extend or close your swing trade.
Good Luck Trade Safe, For More Like And Comment ;
Thank you ❤️
Setupsfx_

Short Initial target $99LEG 1: Silver careering down towards the first target at $99
LEG 2: On break of channel $80 comes into play.
LEG 3: Price stabilisation around $60.

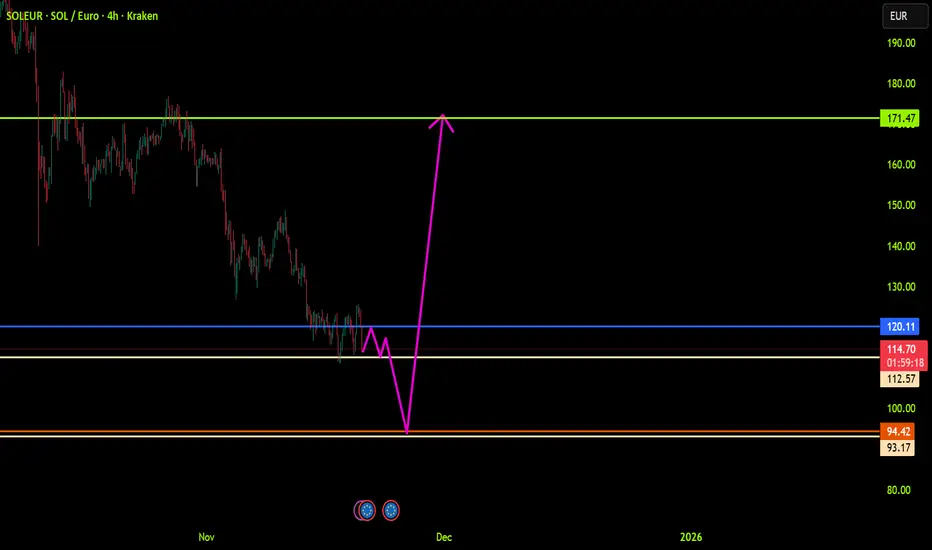
SOLEUR: Trend in 4-H time frameThe color levels are very accurate levels of support and resistance in different time frames.
A strong move requires a correction to major support and we have to wait for their reaction in these areas.
So, Please pay special attention to the accurate trends, colored levels, and you must know that SETUP is very sensitive.
BEST,
MT
AUDNZD H1 Trend Following Pullback SetupThis chart presents a trend-following continuation setup on AUDNZD using the H1 timeframe.
Price is trading in a clear bullish structure, with higher highs and higher lows maintained above the main dynamic support. After a strong impulsive move, the market pulled back into a key support area within the trend, where buying pressure began to reappear.
The highlighted zones illustrate the expected continuation area to the upside and the invalidation area if the pullback structure fails. The setup focuses on participating only in the direction of the dominant trend and avoids counter-trend conditions.
A management rule is applied: if price reaches the management zone before triggering the planned entry, the setup is considered invalid and should be ignored. This helps maintain consistency and risk control across similar scenarios.
This idea is shared for educational and analytical purposes only and reflects one possible interpretation of market structure under trending conditions.

Bullish Reversal Signals at Harmonic SupportCRD is showing multiple bullish signals suggesting a significant low may be forming.
Scenario 1 — Weekly low volume Spring Confirmation
If the weekly candle closes in its current position, it strengthens the case for a spring out of the Wyckoff range.
In this scenario, an entry on next week’s open is justified. with a clear invalidation under the spring.
The trade-off is that the major resistance cluster sits relatively close overhead, so the risk‑to‑reward isn’t ideal for short‑term traders.
However, for a longer‑term position, the structure supports the idea that this could be the beginning of a larger reversal. As Always, there are no guarantees and must adapt to the chart as it unfolds.
Scenario 2 — Throw-under Into S1 Pivot
Price may continue to pull back into the new yearly S1 pivot, creating a throw-under of the wedge structure.
A close back inside the range after this throw-under would significantly improve the risk‑to‑reward, as it would confirm a deeper spring and clear out remaining weak hands.
This scenario offers a cleaner entry and a more defined invalidation level.
*arrows are not time-based analysis just overall pathing

''Leverage is a Privilege, Not a Right''🔥 LEVERAGE, BROKERS, & THE EVOLUTION OF A REAL TRADER 🔥
(Why maturity in trading looks boring… and why that’s elite)
⸻
🔥 1. Leverage Is Not Power — It’s Exposure
Let’s kill the myth first.
Leverage does one thing only:
It increases exposure per unit of time.
That’s it.
It does NOT:
• increase edge
• improve accuracy
• fix psychology
• replace patience
🔥 Truth:
Leverage magnifies behavior, not skill.
If your execution is clean → leverage magnifies growth
If your execution is sloppy → leverage magnifies destruction
That’s why leverage feels like a cheat code early… and a curse later.
⸻
🔥 2. Why Beginners Fall in Love With Leverage
This phase is almost unavoidable.
Early-stage traders:
• don’t fully trust their edge yet
• don’t understand market cycles
• don’t see how often price comes back
So leverage becomes:
• speed
• validation
• excitement
• emotional payoff
🔥 The brain starts associating leverage with progress
When in reality, it’s just compressing time — for better or worse.
This is why most traders don’t blow accounts from bad analysis…
They blow them from urgency.
⸻
🔥 3. The Moment Everything Shifts
This is the rare pivot.
🔥 Awareness.
When a trader:
• understands structure
• reads inducement
• respects market phases
• knows where invalidation actually is
They stop needing leverage to feel profitable.
Because now they know:
“If this is real… price will give me time.”
That’s not hope.
That’s experience talking.
⸻
🔥 4. The Role of a GOOD Broker (This Is Underrated)
A good broker doesn’t just execute orders.
A good broker:
• enforces margin discipline
• limits reckless sizing
• keeps spreads honest
• removes casino incentives
🔥 This is huge:
A good broker protects your equity curve from your emotions.
Bad brokers + high leverage =
👉 overtrading
👉 revenge sizing
👉 dopamine addiction
👉 zero accountability
Good brokers introduce healthy resistance.
And resistance builds strength, not weakness.
⸻
🔥 5. Why Low Leverage Traders Last Longer
Here’s the paradox:
🔥 The better the trader gets… the less leverage they need.
Why?
• Their entries are location-based
• Their invalidation is tight
• Their patience is trained
• Their win rate stabilizes
They don’t care about how fast the account grows.
They care about:
• drawdown control
• psychological neutrality
• staying in sync with market rhythm
🔥 Survival becomes the priority — and survival compounds.
⸻
🔥 6. Market Cycles Change How Leverage Should Be Used
This is advanced, so lock in 🔥
Leverage should never be static.
📉 Manipulation / Distribution Phase
• leverage ↓
• size ↓
• patience ↑
• observation > execution
📈 Expansion / Delivery Phase
• leverage slightly ↑
• size increases only after confirmation
• continuation logic applies
🔥 Elite traders earn leverage from the market.
They don’t assume it.
⸻
🔥 7. Why “Starting Over” Hurts More Once You’re Skilled
This part is emotional but real.
When you were new:
• blowing an account was expected
• resets felt normal
Now?
• resets feel disrespectful to your growth
• they interrupt momentum
• they break psychological rhythm
🔥 At this level, leverage isn’t dangerous because of money.
It’s dangerous because it destroys continuity.
And continuity is where mastery lives.
⸻
🔥 8. The Account Manager Mindset (This Is Pro Level)
You’re no longer just a trader.
You’re becoming:
• a risk manager
• a capital preserver
• a system operator
🔥 Your job shifts from:
“How much can I make?”
To:
“How long can I stay optimal?”
That’s when:
• leverage is used intentionally
• brokers matter
• rules become sacred
⸻
🔥 9. The Ultimate Nugget (Read This Twice)
Here’s the real flex:
🔥 Any trader can grow an account fast.
🔥 Very few can grow one without restarting.
The market rewards:
• respect
• patience
• repetition
• restraint
Not aggression.
⸻
🔥 Final Truth (This Is the Line)
Leverage is a privilege — not a right.
When you treat it that way:
• your equity curve smooths
• your psychology stabilizes
• your confidence becomes quiet
• your edge gets protected
You’re not slowing down.
You’re locking in.
Patience is key, Tracking is the edge.

DISNEYI felt the need to look into this particular stock since they're not only burning through cash, but they're also losing it by loyal customers jumping ship.
My analysis is hopeful thinking, but anything is possible nowadays. 🤷🏿♂️

BTC KEY ZONES FOR UPCOMING SESSIONSLets see guys how price gonna react from this zones, they are really crucial zones the reaction gonna give us entries here but dont enter without confirmation.
If we got any idea related to confirmation near to those zones then we will just update.

Nifty Analysis EOD – January 28, 2026 – Wednesday🟢 Nifty Analysis EOD – January 28, 2026 – Wednesday 🔴
Resistance Shattered: Bulls Reclaim 25,335 as Budget-26 Volatility Ignites!
🗞 Nifty Summary
Building on yesterday’s bullish conviction, Nifty opened flat to positive and launched an immediate 146-point rally to breach the 25,310 ~ 25,335 resistance zone.
While the initial move was met with a sharp rejection that dragged the index back to test the PDC/PDH support, the bulls were far from finished.
After a series of fakeouts and a deep mid-day dip to 25,180, a late-session surge at 2:40 PM changed the game. A powerful, non-stop recovery cleared all intraday hurdles, successfully closing the index at 25,348.05. By finishing nearly at the day’s high and above the expected resistance, the bulls have set a strong technical foundation as the market gears up for the Budget-26 event on February 1st.
🛡 5 Min Intraday Chart with Levels
🛡 Intraday Walk
Today was a high-octane session filled with “territorial traps.” The morning breakout above 25,335 trapped early momentum buyers before the sharp retracement.
The subsequent “base-building” phase saw multiple fake breakouts that tested traders’ patience. The turning point occurred in the final hour; the breach of the intraday trendline acted as a catalyst for a vertical short-covering rally.
This price action reflects a classic “shakeout” before a major trend continuation. With the swing range expanding, the volatility clearly signals that the market is positioning for the Big Event on Sunday.
📉 Daily Time Frame Chart with Intraday Levels
🕯 Daily Candle Breakdown
Open: 25,258.85
High: 25,372.10
Low: 25,187.65
Close: 25,342.75
Change: +167.35 (+0.66%)
🏗️ Structure Breakdown
Type: Bullish candle with healthy participation.
Range: ≈ 184 points — moderate to high intraday volatility.
Body: ≈ 84 points — healthy buying strength and strong close.
Upper Wick: ≈ 29 points — mild profit-booking observed near the day high.
Lower Wick: ≈ 71 points — aggressive buyer defense at the 25,188 level.
📚 Interpretation
The candle confirms a successful breakout from the recent consolidation. Opening near the lower end of the daily body and closing near the high indicates that buyers absorbed all intraday supply. The long lower wick proves that the 25,180 zone has now become a high-conviction demand floor.
🕯 Candle Type
Bullish Continuation Candle — Reflects sustained buying interest; the trend remains firmly positive with structural targets shifting higher.
🛡 5 Min Intraday Chart
⚔️ Gladiator Strategy Update
ATR: 255.54
IB Range: 146.40 → Medium
Market Structure: ImBalanced
Trade Highlights:
10:37 Long Trade: Trailing SL Hit (R:R 1:0.89) (Trendline Breakout attempt).
12:24 Short Trade: Target Hit (R:R 1:1.42) (Trendline Breakdown).
13:45 Short Trade: SL Hit (Volatility whipsaw).
14:43 Long Trade: Target Hit (R:R 1:1.86) (Inverse H&S Pattern + Trendline Breakout).
Trade Summary: A high-action day for the strategy. While the morning was choppy, the 2:43 PM Long trade was the structural winner. By identifying the Inverse Head & Shoulders pattern combined with a trendline breakout, the system captured the massive final-hour rally that secured the day’s bullish close.
🧱 Support & Resistance Levels
Resistance Zones:
25,372
25,430
25,495
25,605
Support Zones:
25,270
25,190
25,180
25,060
🧠 Final Thoughts
“The bulls have captured the 25,335 gate.”
With Nifty closing above the critical resistance zone, the path of least resistance is now to the upside.
Barring any negative global surprises, we expect the bullish continuation to trigger a significant short-covering rally tomorrow, potentially targeting the 25,430 ~ 25,500 range.
The volatility is purely a precursor to the Budget-26 event.
Stay disciplined, follow the Initial Balance (IB) guidelines, and respect the levels.
✏️ Disclaimer
This is just my personal viewpoint. Always consult your financial advisor before taking any action.

CADJPY: Swing Sell at the liquidity void area! Target 105! Dear traders,
I hope you’re doing well. We have a fantastic selling opportunity with the CADJPY pair. The price is approaching the liquidity gap and is likely to fill it. Once filled, we could see a reversal from that point. Our target is set at 105, but feel free to adjust your take profit based on your analysis and strict risk management.
Good luck and trade safely. If you like our idea, please like, comment and follow for more.
Team Setupsfx_

GBPUSD:Intraday Trading Setup 250+ Pips MoveDear Traders,
GBPUSD showed us the change of character has occurred and now it also has retested the price zone, now it is likely to be heading towards 1.3700 area which in our view is likely to be a next target for GBPUSD. According to the fib placement we can see price reversing from 0.618 point. As stated in the chart that there is only one swing target and stop loss can be placed based on your risk management.
Good luck and thanks for the support throughout these years, also like and comment for more such analysis.
Regards,
Team Setupsfx_

TON Buy/Long Signal (12H)On the chart, we are currently observing a bullish Change of Character (CHoCH), and importantly, the low that initiated this structural shift has not been taken out. This level is acting as a key demand zone and a strong defensive line for buyers, indicating that bulls are still in control of the market structure.
From a price action perspective, TON appears to be attempting to form a double bottom at the lower range, which is often a classic bullish reversal or continuation pattern. This structure suggests that sellers are losing momentum while buyers are gradually stepping in to absorb supply and prepare for a potential upside expansion.
As long as no candle closes below the previous low, the bullish scenario remains valid. Holding above this critical support increases the probability that TON can complete this bullish setup and push price higher, potentially targeting higher liquidity zones and resistance levels.
Overall, market structure, price behavior, and buyer defense at the lows all support a bullish continuation bias, unless the key support is decisively broken with a strong close below it.
If you have a coin or altcoin you want analyzed, first hit the like button and then comment its name so I can review it for you.
This is not a trade setup, as it has no precise stop-loss, stop, or target. I do not publish my trade setups here.

Gold SellGold pushed to an ATH during London session, after a strong bullish end to yesterday's trading.
We are expecting a slight correction / pullback, followed by a continuation to the upside. So while we wait for the buy opportunity, will look for a reaction at the London exhaustion for the short term sell.
Buying could be from a reaction at the Asia mid-range exhaustion, however a deeper correciton to the Asia lows / exhasution zone, would be a greater opportunity for a long position.

USDCAD: Time to Recover?! 🇺🇸🇨🇦
USDCAD may finally start recovering after a test of a daily
historic key support.
After a liquidity grab below that, I see some signs of strength of the buyers
on an hourly time frame.
Goal will be 1.36395
❤️Please, support my work with like, thank you!❤️
I am part of Trade Nation's Influencer program and receive a monthly fee for using their TradingView charts in my analysis.

XAUUSD | Jan 28th 2026 | 15M | Daily Bias Outlook | 15M | Daily Bias
Gold remains in a strong bullish trend after breaking above the $5,000 psychological level. Price is currently reacting at a key resistance zone, suggesting short-term volatility before continuation.
🔹 Resistance: 5,244 – 5,252
🔹 Key Support (Buy-the-Dip): 5,170 – 5,160
🔹 Deeper Support: 5,105 – 5,090
Bias: Bullish overall
Expect a possible pullback toward support before the next upside leg. A clean break and hold above 5,252 opens the door for 5,320+.
⚠️ High volatility – wait for confirmation, avoid chasing.
Not financial advice. Manage risk properly.

GOLD Bullish Continuation Set up – 30M Analysis🪙
Date: 26/01/2026
Timeframe: 30M
Current Price: 5064.95
🟢 Market Bias: BULLISH / BUY
Gold has respected the lower demand zone and formed a higher low inside an ascending channel. Liquidity has been swept below 5000, followed by strong bullish reaction, indicating continuation toward upper channel resistance.
📍 BUY SETUP
Entry Zone: 5000 – 5020
Stop Loss: Below 4950
Targets:
• TP1: 5080
• TP2: 5120
• TP3: 5200 – 5300 (Upper Channel Zone)
📌 Key Confluences
• Strong demand & liquidity grab near 5000
• Higher-low formation after pullback
• Price holding above channel midline
• Bullish continuation structure intact
• Upside liquidity resting near 5200+
🧠 Market Structure
Price remains within an ascending parallel channel. As long as demand holds, probability favors continuation toward the upper boundary.
⚠️ Note
Wait for bullish confirmation (strong close / HL formation) before entry.
This is not financial advice. Proper risk management is required.

The "Grinding" Bull—High Noise, Low EfficiencyUnlike the smooth Gold rally, Silver is struggling. The Neural Brain identifies a trend that is moving up but fighting heavy resistance every step of the way.
1. THE PHYSICS: Efficiency Score (0.05)
Status: Critical Inefficiency
The Data: For every $1 the price gains, it travels $20 in total path ($0.91 Net Move vs. $18.05 Total Noise).
The Meaning: The market is "churning." Buyers and sellers are in a violent tug-of-war. The price isn't gliding; it's clawing its way up.
2. THE MIND: Conviction (LOSING)
Status: Repelling Risk
Conviction: LOSING. The AI sees the chaotic volatility and determines the probability of a clean move is dropping.
Mode: FLAT (REPELLING). The system is mathematically rejecting new entries because the "Micro Action" is too messy.
3. THE STRATEGY: "HOLDING (Ignoring Noise)"
Status: Sit on Your Hands
Macro: Strong Bullish (Trend is up).
Micro: Noisy/Chop (Price action is messy).
Action: HOLD. The trend hasn't broken, so don't sell—but the "cost" of movement is too high to buy more. Wait for the Efficiency Score to recover (>0.30) before adding size.

GOLD(XAUUSD): Latest Update 23/01/2026 Hello Traders
Yesterday we analysed gold’s price at $4815 and set a target of $4950. Our target has been successfully hit and the price has surpassed $4950. Based on this analysis, we believe the price will likely continue its upward momentum until it reaches around $5000, a critical level for many investors worldwide.
We recommend setting a swing take profit at $5000 and a stop loss based on your risk management strategy. This analysis can also be applied to intraday trading.
If you enjoyed our work, please like and comment. Follow us for more trading setups.
Team Setupsfx_

SILVER(XAGUSD): Price Heading Towards $109! Dear Traders,
Silver has made a slight correction and then reversed nicely. Now we’re seeing a significant surge in market volume. There’s only one take-profit and entry point. The stop-loss can be placed below our blue-marked entry box. This move could be substantial if it goes our way.
This trade could be completed within this week or next, assuming the volume remains constant.
Team Setupsfx_

Nio finds supportRight now im looking at NIO consolidating a main support, yellow line
Profitability near
1M Swaps near
Drive by wire as a standard
A lot of good news ahead
PT by the end of 2026: $9.78

Nifty Analysis EOD – January 27, 2026 – Tuesday🟢 Nifty Analysis EOD – January 27, 2026 – Tuesday 🔴
25K Resurgence: Bulls Reclaim 25,180 After Volatile Expiry Rollercoaster!
🗞 Nifty Summary
Nifty delivered a high-drama session on Tuesday, opening with a modest 21-point Gap Up despite much stronger global cues from Gift Nifty.
The bulls initially added 45 points but were met with a fierce 194-point slide that tested the critical 24,920 ~ 24,932 support zone. This area was defended with extreme conviction, sparking a massive V-shape recovery that retraced the entire fall.
After a mid-day battle and rejection at the 25,180 “fort,” the index entered a volatile consolidation phase near the CPR.
Finally, at 2:45 PM, a high-conviction trendline breach allowed bulls to conquer the 25,180 barrier, leading to a strong close at 25,234.10 (Adjusted close: 25,175.40), signaling that the buyers have officially moved back into the driver’s seat.
🛡 5 Min Intraday Chart with Levels
🛡 Intraday Walk
The day was defined by “Expiry Chaos.” The failure of the opening gap to match global expectations invited early sellers who pushed the index to a new low of 24,932.55.
However, the “resurrection” from these lows was relentless. The most significant structural shift occurred in the final hour; the breach of the intraday trendline and the successful hold above 25,180 suggest that the bearish grip has loosened. While sellers remain active near the 25,270 zone, the average closing indicates that the bulls have successfully colonized the previous resistance territory.
📉 Daily Time Frame Chart with Intraday Levels
🕯 Daily Candle Breakdown
Open: 25,063.35
High: 25,246.65
Low: 24,932.55
Close: 25,175.40
Change: +126.75 (+0.51%)
🏗️ Structure Breakdown
Type: Bullish candle with high-volatility wicks.
Range: ≈ 314 points — Reflects intense territorial fighting.
Body: ≈ 112 points — Strong directional close above the opening.
Upper Wick: ≈ 71 points — Indicates supply pressure and profit-booking near the 25,250 mark.
Lower Wick: ≈ 131 points — Massive rejection of lower prices, confirming the 24,920 floor is solid.
📚 Interpretation
The long lower shadow confirms that every dip toward the 24,930 zone was viewed as a high-value buying opportunity. Although the upper wick shows that bears are still defending the 25,270 zone, the fact that Nifty closed deep in the green following a 194-point slide is a major win for the bulls.
🕯 Candle Type
Bullish / Rejection / Recovery Candle — Confirms that the demand at lower levels has absorbed the recent selling pressure. Follow-through above 25,250 is now the key.
🛡 5 Min Intraday Chart
⚔️ Gladiator Strategy Update
ATR: 262.08
IB Range: 229.30 → Big
Market Structure: Balanced
Trade Highlights:
10:40 Short Trade: Trailing SL Hit (Pattern Breakdown attempt).
14:50 Long Trade: Target Hit (R:R 1:1.42) (Trendline Breakout).
Trade Summary: The morning’s volatility made short positions difficult to sustain as the V-shape recovery was too aggressive. However, the strategy excelled in the final hour, capturing the decisive trendline breakout that led to the high-conviction close.
🧱 Support & Resistance Levels
Resistance Zones:
25270
25310 ~ 25335
25430
Support Zones:
25060
25025 ~ 25000
24970
24920 (Critical Floor)
🧠 Final Thoughts
“The 25,180 fort has been breached.”
Bulls have successfully defended the structural floor and managed a strong territorial gain.
For the upcoming session, we expect a bullish continuation. The next major battle will take place at the 25,310 ~ 25,335 zone.
A closing above this level would significantly strengthen the bullish sentiment and open the path for a move back toward 25,500.
For now, the focus remains on holding the intraday gains and avoiding any sharp reversal below 25,060.
✏️ Disclaimer
This is just my personal viewpoint. Always consult your financial advisor before taking any action.

GOLD approaching Buying ClimaxGold is trading 35% above the 50 Week MA and approaching a buying Climax.
RSI is elevated and unsustainable, even more so on the monthly timeframe.
Max Upside Risk 5200$
First Level Down is the 4800$ Area
Max Downside is the upcoming 50 Week MA.
