AUDCAD - Bullish BiasHTF (4H) remains within a bullish range, consolidating near highs with strong volume support favoring continuation.
On the 30M, the OB has been mitigated from the marked zone, and we’re seeing LTF reaction off that area.
LTF (5M): still tracking alignment — waiting for a clean sweep into the OB before executing. Once that happens, I’ll look for confirmation to enter.
Patience is key.
Tracking is the edge.
Let’s go. 🔥
Pivot Points

USDCAD - Bullish BiasHTF (4H) structure remains bullish. I’ve mapped it from the Daily to get a broader perspective — liquidity has been taken, leading price into a strong OB after the trap was set.
On the 30M, I’m watching for a midterm market structure shift. Once that confirms, I’ll define the internal OB and prepare for execution.
LTF (5M): after midterm alignment, I’ll wait for price to mitigate the zone, then look for a clear MSS and pullback into demand to take buy entries.
Until then, patience is key.
Tracking is the edge.
Let’s get it. 🔥

USDCHF - Bullish BiasHTF (4H) structure remains bullish, printing the same tape as last week — nothing has changed. Bulls remain in control as price was driven into a strong internal structure OB after taking out major IDM.
On the 30M, price has mitigated the OB with strong reaction off the wick, showing respect for the zone and confirming participation through volume.
LTF (5M): market structure shifts are forming, but after the initial sweep, probability isn’t fully aligned yet. I’m watching for deeper discounted territory and cleaner alignment across timeframes before engaging. All prior OBs have been mitigated — now it’s about patience and confirmation.
Until everything syncs up, I’m waiting.
Patience is key.
Tracking is the edge.
Let’s go. 🔥

Bank Nifty Weekly Outlook (29th Dec 2025 – 2nd Jan 2026)The Nifty Bank Index ended the previous week at 59,011.35, registering a marginal decline of –0.10%. The index is currently hovering around a critical price action zone, suggesting a decisive move could unfold in the coming week.
🔹 Key Levels for the Upcoming Week
📌 Price Action Pivot Zone (59,011 area)
This zone represents the immediate weekly decision point.
Sustaining above this region could attract fresh buying interest, while failure to hold may invite selling pressure.
🔻 Support Levels
Support 1: 58,555
Support 2: 58,224
Support 3: 57,893
🔺 Resistance Levels
Resistance 1: 59,402
Resistance 2: 59,777
Resistance 3: 60,144
📈 Market Outlook
✅ Bullish Scenario
If Bank Nifty sustains above the 59,011 pivot zone, the index may attempt an upward move toward Resistance 1 at 59,402.
A decisive breakout above this level could open the gates for 59,777, and further strength may push the index toward 60,144 in the coming weeks.
❌ Bearish Scenario
If the index fails to hold above 59,011 and slips below this zone, short-term weakness could drag prices toward Support 1 at 58,555.
Further breakdown may test 58,224 and 57,893. A weekly close below 57,893 would indicate a deeper corrective phase ahead.
Disclaimer: aliceblueonline.com

Nifty 50 Weekly Outlook ( 29th Dec 2025 – 2nd Jan 2026)The Nifty 50 Index ended the previous week near 26,042, showing consolidation after a strong upward move. The index is currently hovering around a critical price action pivot, which will decide the next directional move.
🔹 Key Levels for the Upcoming Week
📌 Price Action Pivot Zone (26,008 – 26,058)
This blue-shaded zone is the most important decision area for the market.
Sustaining above 26,058 can keep the bullish momentum intact.
Rejection or failure to hold below 26,008 may invite short-term selling pressure.
🔻 Support Levels
Support 1 (S1): 25,902
Support 2 (S2): 25,788
Support 3 (S3): 25,680
These levels may act as buy-on-dips zones if the broader trend remains positive.
🔺 Resistance Levels
Resistance 1 (R1): 26,141
Resistance 2 (R2): 26,240
Resistance 3 (R3): 26,320
These zones are likely to witness profit booking or supply pressure on upward moves.
📈 Market Outlook
✅ Bullish Scenario
If Nifty holds above the Price Action Pivot Zone (26,008–26,058), the index may attempt a move toward:
R1: 26,141
A sustained breakout above R1 can push Nifty toward R2 (26,240) and R3 (26,320).
❌ Bearish Scenario
If the index breaks and sustains below 26,008, short-term weakness may emerge, dragging Nifty toward:
S1: 25,902
Further breakdown may extend the decline toward S2 (25,788) and S3 (25,680).
📌 Conclusion:
The 26,008–26,058 zone remains the make-or-break level for the coming week. Traders should closely watch price behavior around this area for directional cues.
Disclaimer: aliceblueonline.com

EURUSD - Bullish ContinuationHTF (4H) structure remains bullish, with price driving toward higher objectives.
On the 30M, structure is aligned after the major LH break. Now waiting for a clean SSL sweep into the internal OB — sitting just beneath the inducement zone.
LTF (5M): once mitigation occurs into the bullish block, I’ll wait for a CHoCH and a clean pullback to execute buy entries.
Patience is key.
Tracking is the edge.
Let’s go. 🔥

EURGBP - Bullish ContinuationHTF (4H) showing bullish intent — waiting on full mitigation of the internal OB. This zone carries strong significance, mapped from higher timeframe structure with volume confirming sustained interest, making it a high-quality area to work from.
On the 30M, I’m looking for alignment confirmation — once the LH is broken, bullish bias is validated and continuation becomes favored.
LTF (5M): once the mid-zone is mitigated and a clear CHoCH prints, I’ll wait for a pullback into clean demand to execute buys.
Patience is key.
Tracking is the edge.
Let’s get it. 🔥

CADJPY - Bullish ContinuationHTF (4H) showing clean bullish structure — tape reading confirms strength and continuation intent.
On the 30M, structure remains bullish as price works toward the SSL. Waiting for price to dip into the internal OB test area before engagement.
LTF (5M): once mitigation occurs, I’ll wait for a clear LH break and pullback into the bullish leg — targeting liquidity above mid and HTF highs.
Patience is key.
Tracking is the edge.
Let’s get it. 🔥

GBPJPY - Bullish ContinuationHTF (4H) structure remains bullish, printing higher highs and higher lows with strong volume supporting key pivot points.
On the 30M, I’m waiting for a deeper pullback — looking for price to sweep SSL and tap into the underlying OB. Once full candle mitigation is confirmed, I’ll shift into execution mode.
LTF (5M): after mitigation, I’m waiting for a clean LH break followed by a pullback into fresh demand to take buy entries targeting mid and major highs.
Patience is key.
Tracking is the edge.
Let the market do the work. Let’s go. 🔥

AUDJPY - Bullish Continuation Setup4H HTF showing strong bullish momentum, with volume supporting higher lows and upside intent.
On the 30M, price is approaching the SSL sweep — looking for a pullback into the underlying OB. Once we get a full candle mitigation, I’ll drop to lower timeframes to assess reaction.
LTF (5M): waiting for a clean LH break followed by a controlled pullback to confirm entry.
Until then, patience is key — tracking the process and letting the setup come to me.
Let’s go. 🔥

USDJPY - Bullish ContinuationHTF (4H) showing strong bullish intent — solid momentum supported by clean volume expansion.
On the 30M, price respected the refined prior-week OB, with engineered liquidity swept into the zone.
LTF (5M) delivered confirmation: bullish break of structure, higher high established, and a clean pullback entry.
Buy executed on the retrace — higher low holding, volume supporting continuation.
Now it’s just patience and execution.
Trade is active. Let the market deliver.


SUSHI Analysis (4H)At the lowest price on the chart, if you look closely, a red candle with very strong momentum has formed, but the price quickly reversed. The origin of this candle was a bearish move, which means it was a fake move designed to collect orders.
Since the origin of this candle has been engulfed, we usually see strong moves in the opposite direction of this candle.
Since we placed the green arrow on the chart, a bullish phase with good momentum has started.
It seems we have an ABC pattern, or possibly a more complex one, and we are in the early stages of wave C.
Wave C has more room to expand and can continue its upward movement. However, entering a position should be done at optimal points.
We have identified two entry points and will enter using a DCA (Dollar-Cost Averaging) approach.
There are two main targets on the chart, and we suggest closing a portion of the position at the first target.
A daily candle closing below the invalidation level would negate this analysis.


BOB Analysis (4H)The BOB asset is approaching a strong origin zone. This zone has successfully broken and cleared the previous two highs.
So far, multiple support levels have been broken, indicating that a significant amount of liquidity has been swept.
We expect a reaction from the identified origin zone. The stop loss should be placed slightly below the previous low.
We have marked two specific points for entry, where positions should be built using a DCA strategy. The targets have been clearly indicated on the chart.
Do not enter the position without capital management and stop setting
Comment if you have any questions
thank you

BEAMX Analysis (4H)Market makers, in this weak and low-volatility market, are hunting for liquidity. Bullish momentum on this asset is very weak, and the previous trend is bearish, which causes most traders to look for sell/short positions.
However, there are signs on the chart indicating a potential stop hunt for sellers.
Price is currently trading at a key level, and we have a bullish CH (Change of Character) after a bearish consolidation/compression.
We have two entry points, which can be executed using a DCA approach.
Targets are marked on the chart.
If you would like us to analyze a coin or altcoin for you, first like this post, then comment the name of your altcoin below.

UNI Analysis (4H)A trigger line has been broken on the chart. We have a bullish CH, and a Three Drive pattern is also visible at the bottom. These patterns usually push price upward toward the nearest supply zone. Price has been fueled from a strong origin, suggesting sufficient buy-side orders.
We currently have two re-buy entry points. If price pulls back to the downside, we can enter the position using a DCA approach.
The targets are marked on the chart.
Please note: if price reaches our entry zones before touching the red supply zone, we will enter the position. However, if price first reaches the supply zone and then returns to our entry area, we will not enter.
A daily candle close below the invalidation level will invalidate this analysis.
For risk management, please don't forget stop loss and capital management
When we reach the first target, save some profit and then change the stop to entry
Comment if you have any questions
Thank You

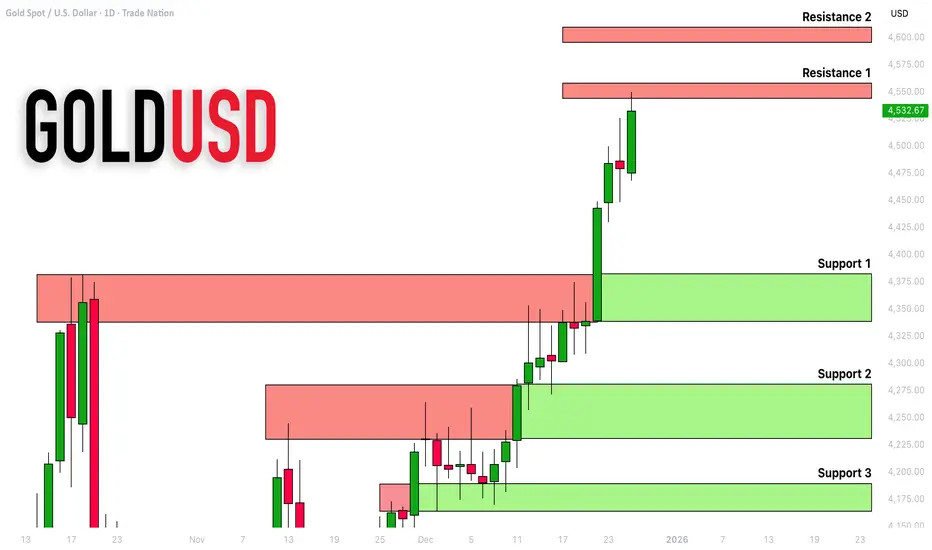
GOLD (XAUUSD): Support & Resistance Analysis For Next Week
Here is my latest support & resistance analysis for Gold
for next week.
Consider these structures for pullback/breakout trading.
❤️Please, support my work with like, thank you!❤️
I am part of Trade Nation's Influencer program and receive a monthly fee for using their TradingView charts in my analysis.
EURUSD: Support & Resistance Analysis for Next Week 🇪🇺🇺🇸
Here is my latest structure analysis and important
supports & resistances for EURUSD for next week.
Consider these structures for pullback/breakout trading.
❤️Please, support my work with like, thank you!❤️
I am part of Trade Nation's Influencer program and receive a monthly fee for using their TradingView charts in my analysis.

FILUSDT The daily chart of BINANCE:FILUSDT shows an overall bearish structure, but weakening selling pressure and price consolidation suggest that downside momentum is fading at current levels.
Price is moving inside a lower-range trading zone, and a breakout above the range high could be the first sign of a bearish trend correction.
Supports:
1.150
Resistances:
1.311
1.600 to 1.700
2.100
2.500

Serv pivot longServ I have followed for a while and the stock appears to be basing here. This is also exactly where the golden fib is, my favorite trading strategy. I note a meaningful rise in volume and BBWP is strengthening with lots of room to run. My plan would be a swing to 14.17.

STRK Buy/Long Setup (4H)It seems we are at the end of the corrective wave C.
There are confirmations indicating a pullback to higher levels, including a bullish CH and positioning at important levels.
We have identified two entry points, where you should enter the position using DCA.
Targets are also marked on the chart.
A 4-hour candle closing below the invalidation level will invalidate this analysis.
For risk management, please don't forget stop loss and capital management
When we reach the first target, save some profit and then change the stop to entry
Comment if you have any questions
Thank You

USDCAD: +400 Pips Selling Opportunity!Overview🧠
The USDCAD currency pair has reversed and a potential change in trend is occurring. Confirmation is required before a sell entry can be made. The only take profit is a swing move with a potential gain of approximately 400 pips. The stop loss can be placed above the higher high. Please like and comment for more.
Team Setupsfx
