BTC 2026 Outlook - Roadmap Speculation to $300KHello BTC Watchers.
Let's talk about BTC in the Logarithmic view.
I mapped out the date-ranges, as well as how far the price fell logarithmically after each top. You'll see the word "lines" on the chart. This simply indicates the amount of diagonal trendlines it has fallen. By using this pattern-dedicated approach, a commonality is found which may be useful in speculating a future price. Because if not for past history, how else would we speculate on the future?
It's interesting to note that the past 3 ATH's (all time high's) are each lower than the previous if you compare it not to price but to the "lines". Even the fifth high (the one coming next) will be on a lower click-line than the previous, and that estimate is already over 300k. This is a really helpful way to speculate a future high because usually on a regular-view chart, the zone above the ATH is uncharted territory. You could use a Fibonacci trend-based extension, but this is limited to the cycle that you're using for input points. Logarithmic chart + indicators factor in the entire history of the price.
This would mean the new peak could be in 2026 around USD 300k.
It's important to note that this ay not be a straight line up. As you'll see, although the price has been increasing exponentially, there have been periods of hard pullbacks or corrections. These are great times to enter the market, NOT when the price is close to the peak of the curve (in green).
So could it be that this is just another dip in the road towards a new ATH - despite the recent market liquidation?
Pivot Points

ING - Critical Area of Interest This is a valid long setup with mixed cues. Price swept the 22 Sep lows and printed a clean hammer back inside the range, offering either a trade or a longer‑term dividend play. The Aug–Oct pullback came on rising volume (not ideal), but the silver lining is the narrowing candle spreads into the low with high volume, signaling demand stepping in and absorption rather than panic.
Liquidity and composite operator read
- Early reversal risk: It’s still early to call the low. The November sweep wasn’t deep, so the Composite Operator may engineer one more push to harvest liquidity.
- If another flush occurs: A sharp retest toward the yearly S2 pivot could set a monthly bullish hammer/doji, then rotate higher back into the range.
Trade Plan
Scenario 1 – Higher risk, price action led
• Initial target: Mid‑range EQ, aligning with the monthly FVG EQ and the local 50% level
• Extended target: $3.50 if price accepts above the range midpoint and holds retests
• Invalidation: November low (tight SL to respect the risk)
Scenario 2 – If November low breaks
• Entry: Look for a bullish hammer/doji close above the yearly S2 pivot
• Confirmation: Add to the position once price closes back inside the range
• Targets: Same as Scenario 1, but with improved risk‑reward if the flush plays out
Bottom Line
Conflicting signals remain, but the structure is tradable. Respect the downside via the November low, and let the chart dictate whether this is absorption turning into rotation.

TRADOOR is in a dangerous area | be careful (4H)Note: This is a risky and highly volatile coin.
With the recent spike movements, a large amount of liquidity has been accumulated. We have marked the liquidity zones on the chart, and we are close to the ATH. Despite sweeping all this liquidity, price has not corrected yet and may correct at any moment.
If you enter a sell/short position, make sure to manage your risk, wait for confirmations, and set a stop-loss.
The targets have been marked on the chart.
A daily candle closing above the invalidation level will invalidate this analysis.
Do not enter the position without capital management and stop setting
Comment if you have any questions
thank you

CRV PO3 LONGPower of 3 Setup
Enter brief manipulation under .35 HTF support
Reclaim .35 HTF support into expansion towards 1.4 target
Invalidation / SL below wick low ~.18

XAUUSD 01/12 Support zoneSalutations,
Hi traders, This is the crucial support zone for XAU-USD at 15 minute,
based on the movement of the day prior and market trends.
Support zone (White line)
Important levels:
4211.25 is the entry
Target: 4221.25
Stop loss: 4201.25
1:1 Risk-Reward Ratio
We are inspired to continue learning and exchanging ideas by your likes and boosts!

$BTC Weekly Chart: Huge Hidden Bullish Divergence + .618 In times the market is bleeding, its CRITICAL to zoom out, get off the 1 minute chart as we like to say, and see the entirety of the market - we do this through HTF (high time frame) TA.
This is what the high time frame chart of CRYPTOCAP:BTC shows on the Weekly.
1. Hidden Bullish Divergence on BTC. Notice the lower low on the weekly RSI whilst the RSI makes a higher low. This is a HIDDEN BULLISH DIVERGENCE. Typically these are not as strong as strong bullish divergence. While I would love to see that, its not what is showing. It is still however showing bullish signs of reversal.
2. .618 Fibonacci level - the .618 Fib level is right around 78.5K - This is a super significant area in relation to fib levels. The .618 is oftentimes a massive support. This happens to coincide with a previous all time high. Typically, old resistances become support. So on the way down (when price is declining), I like to see what use to be a significant resistance in that range - this is known as an S/R flip. Support / Resistance flip. When old resistance becomes support, its very bullish.
So we take alllll of this into account to try and find a bottom. So far, i like what I am seeing on the chart. Combined with the fact fear and greed is majorly fearful, this is yet again another bottom type sign.
I don't think we are in the clear by any means - liquidity is thin across global markets currently. However this sentiment can shift with a 2% rise in the SP500 - so we want to be very aware when we are showing bottom signs on the chart and in the sentiment.
I have started building a long position on CRYPTOCAP:ETH as ETH / BTC has shown beautiful resilience as of late.

FF looks Bearish (4H)It appears that we have an ABC pattern in which wave B formed a triangle, and the final leg of this triangle | wave e of B | has now completed. The price is entering a larger wave C, which is a bearish wave.
A 4-hour candle closing above the invalidation level will invalidate this analysis.
The targets are marked on the chart. These targets are for taking profit. Price can even move beyond the green zone, but since this is a volatile and newly listed coin, it’s better to take profit at each level and then move the stop-loss to breakeven.
For risk management, please don't forget stop loss and capital management
When we reach the first target, save some profit and then change the stop to entry
Comment if you have any questions
Thank You

BPCL LONG TRADEIdea: Long trade BPCL for weekly income.
Logic: With BPCL in continuous uptrend, a demand zone formed on 349.4 levels is strong probability for bounce up, as it has broken prior pivot and is also near higher time frame demand zones.
The zone being formed on 50 EMA on weekly time frame adds another edge to the zone working in our favor.
Keeping R:R as 1: 2.5 a long trade with strict SL can be initiated.
Entry : 349.4
SL: 341.35
Target: 369.5.
#Safe trading
#Take proper position size and risk management.

Nifty Analysis EOD – December 1, 2025 – Monday🟢 Nifty Analysis EOD – December 1, 2025 – Monday 🔴
Exhaustion Gap Turns Lethal: Bears Take Driving Seat
🗞 Nifty Summary
The Nifty opened with a substantial 108-point Gap Up, placing it above the 26300 level and the Previous Day’s High (PDH)—a clear sign of early bullishness.
After the Initial Balance (IB) formation, bulls failed decisively to hold 26277 (the ATH zone), and the index slipped to fill the gap. Once the 26220 support was briefly tested, a trendline push initiated a sharp sell-off below the PDC, hitting 26150.
After forming a base near the PDL and S1 zone, bulls attempted a recovery, but the confluence of 26220 + CPR Zone + VWAP all acted as strong resistance, pushing Nifty back down.
The session closed at 26,175.75, near the PDL, with a loss of -27.20 points (-0.10%). The day confirms that the initial gap-up was an exhaustion move. After the critical break below the IB Low, bears remained firmly in the driving seat throughout the session.
🛡 5 Min Intraday Chart with Levels
🛡 Intraday Walk
The day began with a false signal. The gap-up failed to find follow-through buying, indicating strong supply near the ATH. The decisive shift occurred when the price failed to hold the 26277 zone, leading to the gap-fill and a breakdown below the IB Low. The subsequent inability to regain and hold the 26220 level—a key pivot from the previous two days—confirmed the bearish reversal.
Today’s Daily Candle range engulfs the previous two-day range, which is a clear technical sign of heavy selling pressure at higher levels. However, the bounce from the 26150 region suggests that buyers are ready to support the index near 26100.
📉 Daily Time Frame Chart with Intraday Levels
🕯 Daily Candle Breakdown
Open: 26,325.80
High: 26,325.80
Low: 26,124.20
Close: 26,175.75
Change: −27.20 (−0.10%)
🏗️ Structure Breakdown
Type: Bearish candle (Near Bearish Marubozu).
Range (High–Low): ≈ 202 points — expanded volatility.
Body: ≈ 150 points — reflecting clear, continuous downward movement from open to close.
Upper Wick: ≈ 0 points — Market opened at the high, showing zero buying follow-through above the open. This signals immediate and strong rejection.
Lower Wick: ≈ 52 points — buyers attempted to defend lower levels (around 26150) but were unable to regain control.
📚 Interpretation
The candle opened at the high (Bearish Marubozu with lower wick defence), confirming immediate supply and an exhaustion gap.
The range engulfing the past two sessions is a strong bearish signal. Tomorrow is the Weekly Expiry, and the crucial question is whether Nifty can hold 26100 to attempt one more challenge of 26277 and achieve a strong close.
🕯 Candle Type
Bearish Marubozu (with strong directional selling pressure).
🛡 5 Min Intraday Chart
⚔️ Gladiator Strategy Update
ATR: 197.31
IB Range: 56.35 → Small
Market Structure: ImBalanced
Trade Highlights:
10:39 Short Trade - Target Hit ( R:R 1:2.54)
12:52 Long Trade - Target Hit ( R:R 1:1.93)
Trade Summary: The strategy adapted well to the day’s sharp, imbalanced moves. Despite the overall bearish sentiment, the system successfully captured high R:R opportunities on both the significant short-side move from the exhaustion gap and a key long-side recovery.
🧱 Support & Resistance Levels
Resistance Zones:
26220 (Immediate Pivot/CPR)
26277 (Old ATH/Key Resistance)
26320
Support Zones:
26104 (Previous Strong Resistance, now first support)
26030
25985
25930 ~ 25920
🧠 Final Thoughts
“The gap-up was the liquidity required for the short.”
The failure to hold the ATH zone, coupled with the Bearish Engulfing candle, shifts the short-term bias to bearish. The fate of the weekly expiry hinges on 26104. If Nifty breaks and sustains below 26100, we should see an aggressive drop towards 26030 quickly. For bulls to survive, they must reclaim 26220 immediately on the open.
✏️ Disclaimer
This is just my personal viewpoint. Always consult your financial advisor before taking any action.

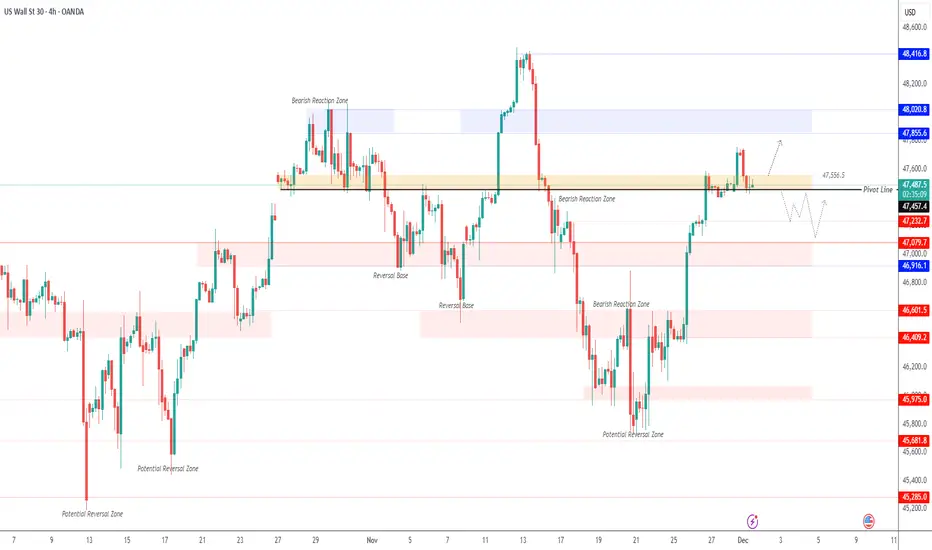
US30 | Breakout Confirmation RequiredUS30 – Technical Overview
US30 is currently consolidating between 47450 and 47560, awaiting a clear breakout to define the next direction.
A 1H or 4H close below 47450 will confirm bearish momentum, opening the way toward 47240 and then 47080.
However, a 1H — and especially a 4H — close above 47560 will signal continuation of the bullish trend toward 47850 and 48000.
Pivot Line: 47450
Support Levels: 47230 · 47080
Resistance Levels: 47700 · 47860
IREN Well overextended.... deeper pullback before upsideNASDAQ:IREN Price has overextended in a macro wave 3, the strongest and most powerful move described as a “wonder to behold” by Elliotticians. Novice investors are likely to get over-confident in these conditions, enter without risk management and keep chasing the price upwards only to be underwater when it turns around.
Profit taking appears to be taking place. I have closed my positions and am waiting for re-entry. The weekly pivots have been run.
Initial downside targets for wave (4) have been hit $39, the next is 0.382, $26.43. Expect shorts to pile in, adding to any downside momentum.
In the long term, we have higher to go in wave (5).
🎯 Terminal target for the business cycle could see prices as high as $124 based on daily pivots
📈 Weekly RSI hit overbought with no divergence
👉 Analysis is invalidated if we continue into price discovery
Safe trading

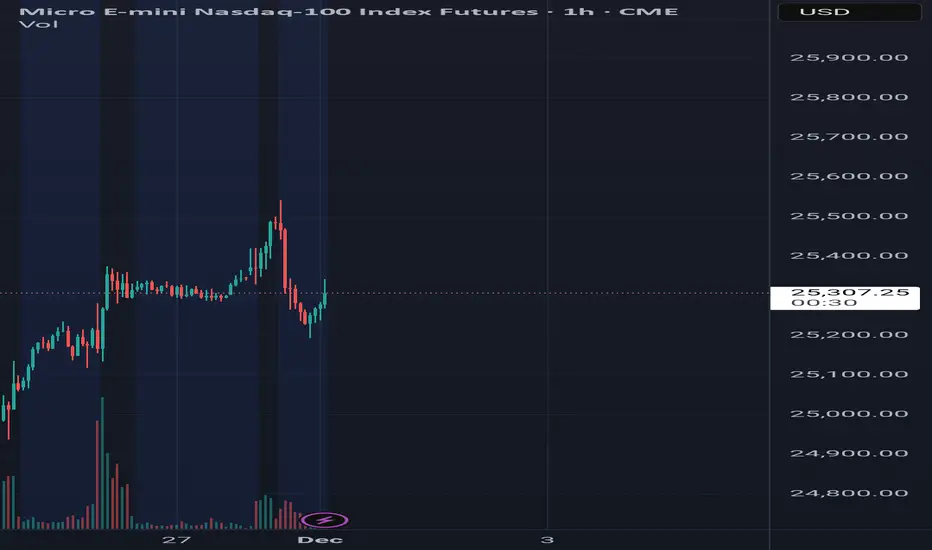
December 1st action Hello,
The market is at 25320 is right now.
The market will either go down to 25200-25000 first or it will go up to 25400-25500 before returning to 25200 on the 1st of December.
This is how the whales are planning to manipulate it today.
4284.50 Sell Limit XAUUSDSafe Place For Sell on Xauusd is 4284.50 with 30/40 pip Sl And 60/80 pip Tp
Waite For Result/update

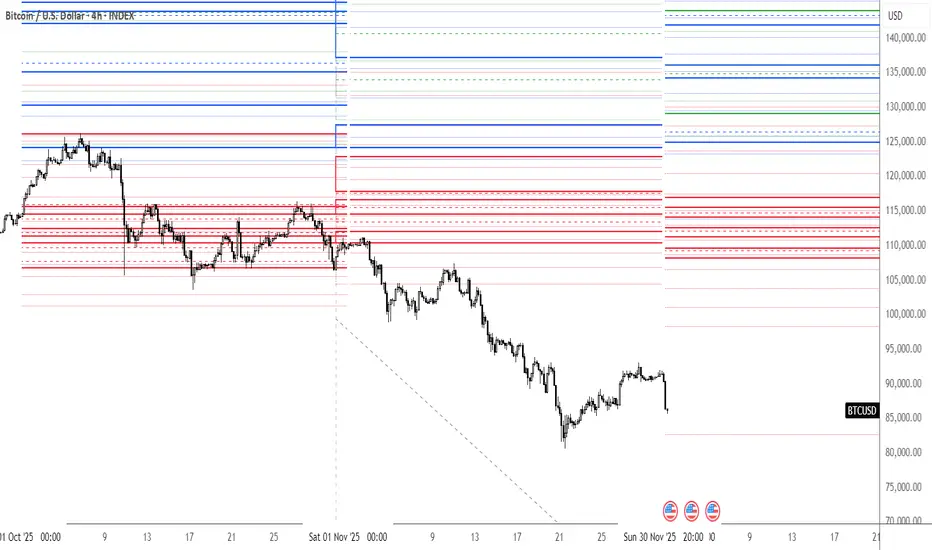
Key Levels the Month 12/2025 ∷BitCoin∷
supply 🐻&🐍&🐂 demand🔳30Day🔲
__________________________
U-Support-Resistance🔀
129068 143963 159397 162853 169545 172352 183459 188149 195060 197966
Mids∷🏛∷
124905 134172 136129 141876 143949 145557 147433 152625
L-Support-Resistance🔀
108239 109608 111230 112567 114054 115545 116924
EUR/JPY Update, New LL formed breaking the 4HR/1HR UptrendEUR/JPY Update – Structure Shift & Early-Week Outlook
Price has now formed a new Lower Low (LL) on the 1H, breaking the previous 4H/1H bullish structure. This confirms that the prior uptrend has been invalidated and that the market is showing early signs of transitioning into a downtrend.
On the chart:
The previous equal-high / supply zone has rejected price multiple times (circled areas).
Price retested the broken structure level (the neckline) and continued lower.
A clean bearish displacement followed, creating a clear LL.
The current pullback is shallow and corrective, showing weak bullish strength.
Key Level to Watch
👉 180.537
A short position becomes more favourable if price breaks and closes below 180.537, which is acting as an intraday support. A break below that level opens the door for continuation towards the next liquidity zone around the 179.5 – 179.8 area.
Early-Week Notes
It’s still early in the trading week, so flows can be choppy, but the market structure is currently favouring bearish continuation. If momentum holds and liquidity is taken below 180.537, a downtrend for the week is very likely.

4097.90 Buy Limit XAUUSDSafe Place For buy with 30/40 pip Sl And 60/80 pip Tp On XAUUSD is 4097.90, For Now...
Waiting For Result/update

4132.40 Buy Limit XAUUSDSafe Place For buy with 30/40 pip Sl And 60/80 pip Tp On XAUUSD is 4132.40, For Now...
Waiting For Result/update

STRK Analysis (4H)STRK is one of the coins that has performed well during the bear market, but after a bearish CH it has entered a downward phase.
Opening a short position at these levels is meaningless. We should wait for a proper liquidity pool to be collected and for the price to retrace upward, then enter a position at optimal levels.
The optimal zone for entering a position is the LP area. If the price reaches this zone, we expect it to be rejected toward the TP levels.
Do not enter the position without capital management and stop setting
Comment if you have any questions
thank you

ETHEREUM Analysis (12H)A large amount of liquidity has been hunted at the top, which corresponds to the all-time high. After this liquidity was taken, the price entered a bearish structure with strong momentum.
For this bearish structure to reverse or slow down, sufficient liquidity needs to be collected from the lower areas of the chart.
There is a possibility of a temporary rebound from the current levels, but the main reversal should come from the lower zone that we have identified.
We still maintain this outlook on Ethereum in the daily and 12-hour timeframes
Do not enter the position without capital management and stop setting
Comment if you have any questions
thank you

DELTA MANUFACTURINGDelta Manufacturing Ltd., incorporated in the year 1982, is a Small Cap company (having a market cap of Rs 85.24 Crore) operating in Electric/Electronics sector.
Delta Manufacturing Ltd. key Products/Revenue Segments include Ferrites (Hard) and Other Operating Revenue for the year ending 31-Mar-2025.
For the quarter ended 30-09-2025, the company has reported a Consolidated Total Income of Rs 14.42 Crore, down 1.33 % from last quarter Total Income of Rs 14.61 Crore and down 27.20 % from last year same quarter Total Income of Rs 19.80 Crore. Company has reported net profit after tax of Rs -1.55 Crore in latest quarter.
The company’s top management includes Mr.Jaydev Mody, Dr.Ram H Shroff, Mr.Abhilash Sunny, Ms.Anjali Mody, Mr.Aurobind Patel, Mr.Darius Khambatta, Mr.Jehangir Aibara, Mr.Kaarshan Awatramani, Ms.Madhuri Pawar. Company has MHS & Associates as its auditors. As on 30-09-2025, the company has a total of 1.09 Crore shares outstanding.

USD/JPY: Seeking a Swing LowThe daily chart of USD/JPY shows an established uptrend, though prices have been retracing lower for the past seven trading days. I am therefore on the lookout for a swing low in anticipation of a move back to at least 157.
The daily RSI (2) has not yet reached oversold and momentum on the lower timeframes is currently bearish. But with the 155 handle, 155.20 weekly VPOC and monthly pivot point at 155.62 nearby for potential support, perhaps a swing low is near.
Bulls could seek dips towards 155 in anticipation of a move top 157.
Matt Simpson, Market Analyst at City Index

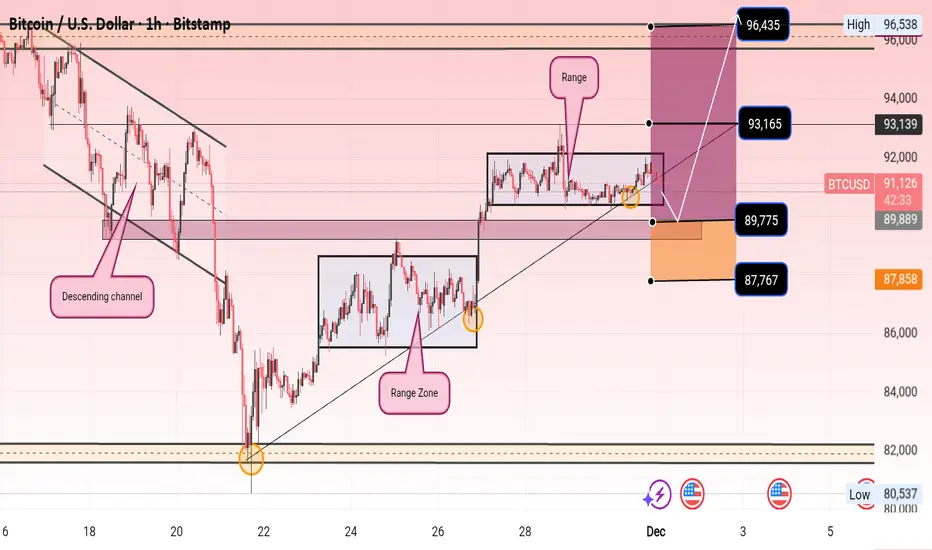
Selena | BTCUSD 1H — Breakout Setup FormingBITSTAMP:BTCUSD
Liquidity has been collected both above and below the current range, suggesting possible buildup before an impulsive expansion. A clean break and retest above the range high may trigger continuation toward the next supply zone, while failure to hold support may lead to deeper retracement.
Key Scenarios
✅ Bullish Case 🚀
Entry 89775
→ 🎯 Target 1: 96,435 (Major supply / imbalance fill)
→ Extended possibilities if momentum continues.
❌ Bearish Case 📉
Break below 87,767
If structure collapses further → deeper discount toward support demand zone below 86K–82K.
Current Levels to Watch
Resistance 🔴: 93,165 | 96,435
Support 🟢: 91,160 (range mid) | 89,775 | 87,767
⚠️ Disclaimer: This analysis is for educational purposes only. Not financial advice.
SPX Analysis (12H)As shown on the chart, the SPX structure is bearish because we have bearish CH (Change of Character) and BOS (Break of Structure).
Based on the fractals indicated with dashed lines and the drawn rectangles, we should expect one more bearish leg in this timeframe.
We are looking for sell/short positions around the swap zone.
The targets have been marked on the chart.
A daily candle closing above the invalidation level will invalidate this analysis.
Do not enter the position without capital management and stop setting
Comment if you have any questions
thank you
