Gold Bulls in control? Going of the technicals, Gold price at 4090 looks very attractive. If bulls can manage to stay in controls I would be looking to buy me some gold.
Pivot Points

SOLUSDT: Get Ready For 300 Mark, This Time Reversal BigSOLUSDT has the potential to reach the 300 price range once it falls to our buying zone, defined by two horizontal white lines. Upon reaching this area we can target the 300 price level. Please exercise accurate risk management when trading cryptocurrencies.
For further analysis please like and comment.
Team Setupsfx_

XAU/USD – Potential Pullback Before ContinuationGold may experience a pullback today toward the 4,100 zone before continuing its upward trend.
Technical Factors:
Price recently surged above 4,140, leaving limited liquidity below.
Support zone ~4,100 aligns with prior consolidation and minor Fibonacci levels (~0.5 retracement of recent swing).
Short-term structure shows higher lows, indicating the overall bullish trend remains intact.
RSI and momentum indicators suggest overbought conditions, supporting a near-term pullback.
Fundamental Factors:
Fed rate-cut expectations continue to support gold upside; a dovish tone could accelerate the rally.
USD strength/weakness will influence gold’s reaction; recent USD weakness favors gold.
Geopolitical tensions (e.g., Russia–Ukraine) increase safe-haven demand, supporting bullish pressure.
Upcoming low liquidity days (Thanksgiving week) may cause volatile reactions, so patience and discipline are key.
Trading Plan:
Watch for price action confirmation around 4,100.
Ideal entries are longs at or near support with tight stops.
Targets can extend toward 4,180–4,200 (upper channel resistance).

BRENT gartleySneaky gartley printed on H4 tf on Brent crude. If proves to play out we should see much upside from oil in the coming days/weeks.

EURUSD Buy/Long Setup (2H)We are seeing a bullish CH (Change of Character) and a bullish ICH on the chart.
The risk for long positions on the hourly timeframes has decreased, and we are looking for buy/long setups around the demand zone.
The targets are marked on the chart.
A 4-hour candle closing below the invalidation level will invalidate this analysis.
Do not enter the position without capital management and stop setting
Comment if you have any questions
thank you

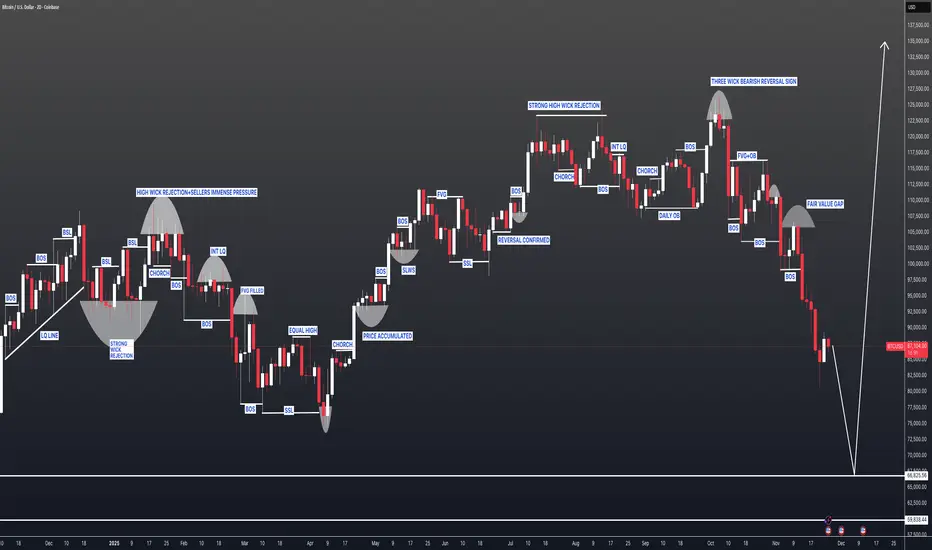
BITCOIN(BTCUSDT): First Setup Dropped From $107k To $80K, Next? Dear Traders,
Bitcoin has fallen from our selling point as described in our previous trading setup on BTCUSDT. The price has dropped significantly from $107k to $80k.
We anticipate a further decline to approximately $66k to $57k. This area appears to be a discounted price point where a large number of buyers are likely to be present. Once the price reaches our entry point marked by two white lines, we believe it will follow a strong bullish impulse. This will likely take the price from $60k to $140k.
We wish you the best of luck and trade safely.
Team Setupsfx
BTCUSDT(BITCOIN): Bitcoin is bearish for now at least! Bitcoin is in distribution phase if we using the smart money concept, that is why we think price is at the final point before it drop faster. There will be mixed views regarding the bitcoin, but this is our personal view and which is more likely view compare to buying. Please use accurate risk management while trading bitcoin. This setup may take time to get it completed, and we will keep you guys updated.
Good luck and trade safe!
Team Setupsfx_

Nifty Analysis EOD – November 25, 2025 – Tuesday🟢 Nifty Analysis EOD – November 25, 2025 – Tuesday 🔴
Expiry Day Bears Break Critical Support Zone
🗞 Nifty Summary
The Nifty opened with a 55-point Gap Up near the 26K level, but sellers immediately stepped in, causing an 81-point fall that filled the gap and marked the initial day low at 25,924.15.
The index successfully took support in the crucial 25940 ~ 25950 zone and rallied, briefly breaching the 26K and IBH levels. However, this breakout was rejected by the trendline resistance, confirming a fakeout. Nifty then hovered in a wide, choppy range within the Initial Balance (IB). Multiple attempts to reclaim 26K failed.
Around 2:15 PM, bulls gave up, leading to a sharp sell-off. The critical 25950 ~ 25940 support was instantly breached, along with the day low and IBL.
The market reached the next defined support zone at 25860 ~ 25840, precisely as aimed in yesterday’s note.
The day closed at 25,884.80, the lowest level of the session, wiping out the previous week’s gains. The bullish structure is now seriously threatened.
🛡 5 Min Intraday Chart with Levels
🛡 Intraday Walk
As expected, yesterday’s note and on the expiry day, the session was exciting and volatile, offering excellent two-sided opportunities for intraday traders.
The key event was the failure to sustain the breakout above 26K in the late morning, which exhausted the buyers. The late-session sell-off was decisive, signaling strong bearish conviction. The breach of the previous session’s critical support (25940) indicates a shift in momentum.
Now that the Previous Week’s Low (PWL) has been tested, a sustained break of today’s low will open the path immediately to the deep support at 25740 ~ 25715.
📉 Daily Time Frame Chart with Intraday Levels
🕯 Daily Candle Breakdown
Open: 25,998.50
High: 26,032.60
Low: 25,857.50
Close: 25,884.80
Change: −74.70 (−0.29%)
🏗️ Structure Breakdown
Type: Strong Bearish candle.
Range (High–Low): ≈ 175 points — moderate volatility.
Body: ≈ 114 points — reflecting steady selling pressure.
Upper Wick: ≈ 34 points — buyers attempted an early push, but sellers rejected higher levels.
Lower Wick: ≈ 27 points — slight buying interest near the lows but not enough to support the price.
📚 Interpretation
The close is a strong bearish signal, sitting near the day’s low and confirming the successful breakdown of the 25940 critical zone.
The inability of bulls to hold the gap-up and subsequent failure to hold 26K indicates clear distribution at upper levels. This structure suggests vulnerability for the immediate future.
🕯 Candle Type
Bearish Candle with Mild Lower-Wick Support — Sellers controlled the session decisively.
🛡 5 Min Intraday Chart
⚔️ Gladiator Strategy Update
ATR: 192.98
IB Range: 81.30 → Medium
Market Structure: Balanced
Trade Highlights:
09:53 Long Trade - Target Hit (R:R 1:1.2)
10:44 Short Trade - Target Hit (R:R 1:2.2)
13:25 Long Trade - SL Hit
14:24 Short Trade - Target Hit (R:R 1:3)
Trade Summary: The volatile, two-sided nature of the expiry day played perfectly into the strategy, capturing profitable trades on both the initial bounce and the final, decisive breakdown, proving effective in the balanced market structure.
🧱 Support & Resistance Levels
Resistance Zones:
25950 ~ 25940 (Immediate Resistance - Now broken support)
26000
26040 ~ 26075
26104
Support Zones:
25860 ~ 25840 (Current Base)
25740 ~ 25715 (Next Major Target)
🧠 Final Thoughts
“The bull structure is now dependent on 25840 holding.”
The decisive close in the 25860 ~ 25840 zone marks a significant bearish achievement. The bias for Wednesday is now firmly to the downside. We need to see if bulls can successfully defend this new base.
A clear move and close below 25840 will open the floodgates toward 25740 ~ 25715. For the bulls to regain control, they must reclaim and hold 25950 immediately.
✏️ Disclaimer
This is just my personal viewpoint. Always consult your
financial advisor before taking any action.

EURUSD Long: Buyers Eye a Push Toward 1.15700 Supply ZoneHello traders! EURUSD continues to trade within a broader bearish market structure, remaining below the long-term Supply Line, which acts as dynamic resistance and keeps the pair under selling pressure. The chart shows several pivot points forming along both the supply trendline and the rising demand trendline, confirming the current wedge-like structure. Earlier, the pair created a Rounding Top Pattern near the upper boundary of the structure, which signaled weakening bullish momentum and triggered a sharp decline toward the Demand Line. After touching the demand trendline around 1.1500, EURUSD formed a strong bullish reaction at the pivot point, showing buyers stepping in to maintain support. However, the recent breakout and retest of minor structure levels still leave the pair below the key 1.15700 Supply Zone, where price has reacted multiple times in the past. This zone aligns with horizontal supply and the descending Supply Line — forming a high-confluence resistance area.
Currently, the pair is attempting to recover toward 1.15700, which is the nearest upside target. If price reaches this level, it may face strong selling pressure once again, as previous breakouts from this zone turned into bearish rejection candles. As long as EURUSD remains trapped between the Demand Line and Supply Line, the overall structure stays corrective and heavily dependent on reactions at these key zones.
My scenario as long as EURUSD holds above the Demand Zone at 1.1500–1.1510, buyers may attempt a short-term recovery toward 1.15700, which acts as the nearest structural resistance. A clean breakout above 1.15700 would confirm bullish strength and could open the way for a deeper correction toward the descending Supply Line. However, if the pair gets rejected at the Supply Zone again, sellers may regain control and push price back toward 1.1510–1.1500, where demand is expected to react. A confirmed break below 1.1500 would invalidate the bullish recovery potential and could signal continuation of the broader bearish trend. For now, EURUSD supports a short-term bullish retracement, but the larger trend remains bearish while price stays below the descending Supply Line. Manage your risk!

Bitcoin / U.S. Dollar - BearishThe signs are evident. There's blood on the crypto markets. Don't bother looking at your portfolio unless you want to cry!
I've been expecting a downturn for a while, bitcoin has been too extended and overpriced and with the economic doom lingering on every sector cashing out and placing your money in safer assets is an old strategy well known to those around long enough to know having skin in the game during uncertainty is not being smart, is gambling. And we dont want to gamble.
Having said that, November has brough a significant downturn in crypto assets creating a ripple effect. Typically, Fall/Winter months bring a bullish outlook in crypto, and despite the clear signs, many still believe this is a dip to buy. I say, hold you horses. If you've profited and took money out, never try to guess the bottom or buy the bottom unless the trend has pivoted. The bloodshed is not over. Comparing JAN25-APRL25 we can clearly see the pivot in trend after April when it finally gained momentum and the bulls took control. This most recent decline OCT25-NOV25 +4.85% to the downside than that of January to April 2025 decline. We're in bear territory (clearly right!).
The point is, you want to anticipate these pivots way ahead of a massive dump like this one and park your assets in Tether USD or somewhere else. This guarantees your profits and a bigger hand to buy the dip when the market is ready to turn. You can go 'shopping'. But if you're one of the unlucky ones and part of the HODL gang lets get straight into it.
After the $107,500 pivot retracement sell confirmation, it was clear that structure broke and more downside was expected. This was also the peak of JAN25-APRL25❗ A key price point. After breaking through this important key price point, a retest is usually followed and that's where the shorts reposition (institutional order flow) to capitalize or add on to their initial shorts, those long is their opportunity to flip. You've to look at the markets in waves!
ANALYSIS :
Expecting further downside on Bitcoin. A particular price point i have my eyes on is APRL25 lows to round up $75K is a good psychological level and is right below the 80 level (ie 00, 20, 50, 80,).
Additionally, the peak of 2022 is right below these levels as well so a $75-$70K is an attractive level acting as a magnet. Two scenarios are currently at hand, either we continue to slam down to the forementioned levels OR a retracement is due to the 90s100 level.
Thank you for taking the time to read this piece.

Bitcoin Pension Interest Grows as Inflation Pressures RiseBitcoin draws pension fund interest as inflation rises, offering a potential hedge while funds weigh volatility, regulations, and security.
Pension funds are known for being very careful with money. They focus on safety and long-term growth. But today, many of them face new challenges. Inflation is rising in many countries, and global tensions continue to affect markets. Because of this, several pension funds are now looking at Bitcoin again and asking if it can help protect value over time.
Why Pension Funds Are Paying Attention
Inflation has reduced the power of traditional investments and bonds do not always give strong returns. Gold, which many people trust, has also moved up and down in ways that worry long-term investors. As a result, some pension fund managers want new options.
Furthermore, Bitcoin offers a fixed supply of 21 million coins. This limited number interests investors who want assets that cannot be created or changed by governments. Many funds now see Bitcoin as something worth studying, even if they do not buy it yet.
Geopolitical events are also a factor. Conflicts, high interest rates, and global trade issues push investors to find assets that can survive uncertain times. Bitcoin’s global nature makes it a possible choice for these situations.
The Big Questions Pension Funds Ask
Pension funds still move slowly, and they must answer many questions before investing. One of the main concerns is volatility. Bitcoin prices go up and down very quickly. Moreover, funds want steady growth, not sudden jumps.
Regulations also matter, and different countries treat Bitcoin in different ways. Some offer clear rules while others change rules often. Pension funds prefer stable environments because they handle retirement savings.
Security is another important area. In the past, it was hard to store Bitcoin safely. Today, large banks and trusted financial companies offer secure storage. This gives investors more confidence, but some still want more time before making large commitments.
Small Steps Are Already Happening
A few pension funds in the United States, Canada and Australia have made small investments in Bitcoin-related products. These investments are small compared to the size of their portfolios, but they show growing interest. These early moves help other funds study how Bitcoin might behave during market stress.
What Comes Next?
Most pension funds will not jump into Bitcoin quickly. But the discussion has already begun. Many managers believe they must explore new ideas as the financial world changes. Bitcoin may not replace traditional assets, but it may become a small part of long-term strategies.
For now, pension funds continue to watch Bitcoin closely. As inflation and global risks grow, their interest in digital assets is likely to increase.

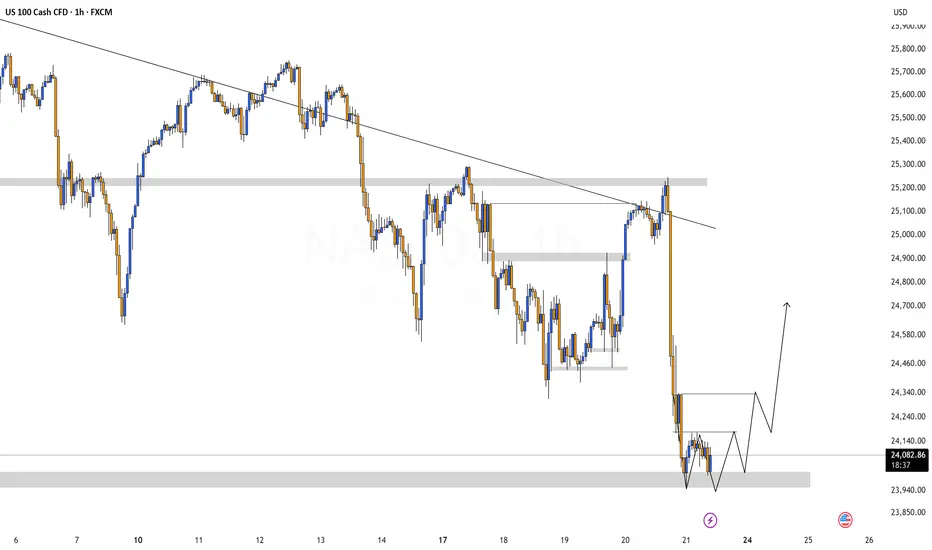
NASDAQ Analysis – Recovery Expected After an Overextended DropYesterday’s sharp Nasdaq drop was surprising, especially considering Nvidia’s exceptional earnings, renewed confidence that we’re not in a bubble, and the strong labor data from NFP. Under normal conditions, the market would likely have reacted with a 2%+ rally.
However, investors are now pricing in the idea that the Fed will not cut rates in December, which created fear-driven selling and an exaggerated move to the downside.
Today, I would like to see a relief recovery, as the index has started to form a double-bottom pattern, a typical structure before liquidity grabs to the upside. If confirmed, price could push back up to take out recent highs.
Historically, after large impulsive drops, the stock market tends to open in green, as investors take advantage of discounted prices. If momentum shifts, the Nasdaq could quickly reclaim lost ground.
Nifty Analysis EOD – November 24, 2025 – Monday🟢 Nifty Analysis EOD – November 24, 2025 – Monday 🔴
Bears Seize Control: Close on Critical Fib Zone Confirms Short-Term Retracement.
🗞 Nifty Summary
The Nifty opened with a misleading 70-point Gap Up. This gap was quickly filled within minutes, finding brief support at the Previous Day’s Close (PDC). The subsequent rally was capped at the major resistance juncture of CDH + IBH + CDO and a key trendline, which successfully pushed the price back toward the day’s low.
After finding rescue near the 26075 zone, Nifty was stuck in a tight 25-30 point range for two hours. This consolidation was followed by a sharp breakdown around 2:00 PM, and a final free fall at 3:00 PM toward the 25940 zone.
The day’s low was marked at 25,911, and the index closed near the low at 25,943.35, resulting in a loss of -108.65 points (-0.42%). The overall day was clearly driven by sellers, closing on the important support band of 25940 ~ 25950.
The daily candle forms a Lower High – Lower Low (LH-LL) structure, confirming a short-term retracement.
🛡 5 Min Intraday Chart with Levels
🛡 Intraday Walk
The initial bullish gap was a clear trap, as selling pressure immediately took over and restricted upside momentum. The prolonged consolidation near 26075 was the calm before the storm. The decisive breakdown in the afternoon, marked by the long-term trendline penetration, signaled a shift in short-term control to the bears.
The close on the critical Fibonacci zone (25940 ~ 25950) means the immediate bias for tomorrow is highly contingent on the opening and subsequent action.
Intraday traders must now prepare for moves in both directions; a long play should look for a successful retracement of the fall, while short plays can aim for 25850 and 25725.
📉 Daily Time Frame Chart with Intraday Levels
🕯 Daily Candle Breakdown
Open: 26,122.80
High: 26,142.80
Low: 25,912.15
Close: 25,959.50
Change: −108.65 (−0.42%)
🏗️ Structure Breakdown
Type: Strong Bearish candle.
Range (High–Low): ≈ 231 points — demonstrating high intraday volatility.
Body: ≈ 163 points — reflecting strong, continuous downside pressure.
Upper Wick: ≈ 20 points — confirming failure to sustain the initial gap-up.
Lower Wick: ≈ 47 points — buyers attempted to defend the low, but the close remained bearish.
📚 Interpretation
The candle is a definitive bearish structure, characterized by its LH-LL formation compared to the previous day. This strongly suggests that the index has started a short-term retracement phase. The close right on the critical support level (25950) means the market is at a crossroads. If tomorrow’s session fails to trade and close above today’s low, the downside scenario toward deeper supports will become highly probable.
🕯 Candle Type
Bearish Candle (LH-LL Formation) — Confirms short-term trend reversal/retracement.
🛡 5 Min Intraday Chart
⚔️ Gladiator Strategy Update
ATR: 194.97
IB Range: 72.85 → Medium
Market Structure: Balanced
Trade Highlights:
10:12 Long Trade - Trailing SL Hit
12:32 Short Trade - SL Hit
14:20 Short Trade - Target Hit (R:R 1:1.5)
Trade Summary: The choppy, two-sided nature of the session around the consolidation zone led to mixed results. The strategy successfully capitalized on the afternoon breakdown with the profitable short trade, aligning with the day’s dominant bearish momentum.
🧱 Support & Resistance Levels
Resistance Zones:
26000 (Immediate Psychological)
26040 ~ 26075
26104
26135
26180
Support Zones:
25950 ~ 25940 (Critical Fib/Current Support)
25860 ~ 25840
25740 ~ 25715
🧠 Final Thoughts
“We are sitting directly on the short-term inflection point.”
The decisive break and close at 25940 ~ 25950 puts the market in a precarious position. The bias for Tuesday hinges entirely on the action at this level.
A continuation of selling pressure, pushing the Nifty below 25911 and holding, will target 25860 next. Only a strong, sustained move back above 26040 can negate the current bearish short-term structure.
✏️ Disclaimer
This is just my personal viewpoint. Always consult your financial advisor before taking any action.

XAU Selling Model #2Hello everyone, Welcome to the XAU-SYNDICATE...
This is my entry model for selling. If the price holds within the bearish trendline and print a clean 15 min rejection candle backed by strong volume. I'll take that as my cue to execute sell positions from this zone, aiming for a short-term downside move.
#XAU-SYNDICATE

BTC/USDTFollowing the OTE pullback, price has corrected into the discount zone.
If the market provides proper confirmation signals, this area may offer valid long opportunities.

ETH/USDTETH remains in a broad consolidation phase.
Price has now reached the lower boundary of the range, bringing the market into a potential long setup zone — but only if proper confirmation signals are present.
As always, patience and validation of conditions are key before considering any long entries.

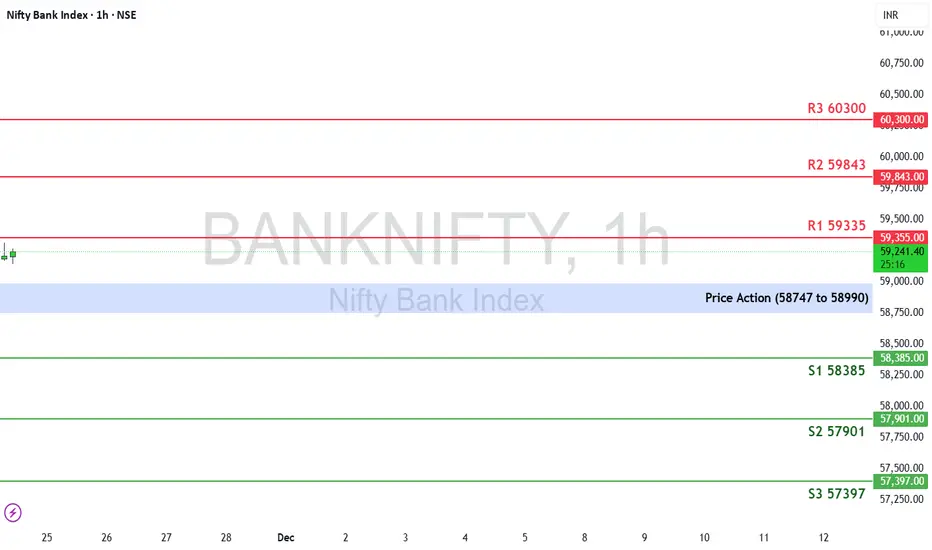
Bank Nifty Weekly Outlook (24th Nov – 28th Nov 2025)The Nifty Bank Index last week ended at 58,867.70, posting a healthy gain of +0.60%. The index continued its upward momentum and is now trading near a crucial supply zone, indicating that the market is at an important decision point for the coming week.
🔹 Key Levels for the Upcoming Week
📌 Price Action Pivot Zone: (58,747 to 58,990)
This blue-shaded zone marks the key decision area. Sustaining above 58,990 may invite strong buying interest. Rejection from this zone could lead to mild profit booking.
🔻 Support Levels
S1: 58,385
S2: 57,901
S3: 57,397
🔺 Resistance Levels
R1: 59,355
R2: 59,843
R3: 60,300
📈 Market Outlook
✅ Bullish Scenario:
If Bank Nifty sustains above the Pivot Zone (58,990), the index may move toward R1 (59,355).
A strong breakout above this level could extend the rally toward R2 (59,843) and eventually R3 (60,300).
❌ Bearish Scenario:
If the index falls below 58,747, short-term weakness may drag it toward S1 (58,385), followed by S2 (57,901) and S3 (57,397).
A weekly close below 57,400 could indicate the beginning of a deeper corrective phase.
Disclaimer: aliceblueonline.com
Nifty 50 Weekly Outlook ( 24th Nov – 28th Nov 2025)The Nifty 50 Index last week ended at 25,910.05, posting a +1.64% gain. The index bounced strongly from lower levels and is now trading near a key supply zone, indicating that the market may see either continuation or consolidation depending on price action in this region.
🔹 Key Levels for the Upcoming Week
📌 Price Action Pivot Zone (25,988 to 26,149)
This blue-shaded zone represents the crucial decision area.
Sustaining above 26,149 may attract strong buying interest, while rejection from this zone could lead to short-term profit booking.
🔻 Support Levels (as per chart)
S1: 25,747
S2: 25,426
S3: 25,088
🔺 Resistance Levels (as per chart)
R1: 26,393
R2: 26,718
R3: 27,027
📈 Market Outlook
✅ Bullish Scenario:
If Nifty holds above the Pivot Zone (25,988–26,149), bullish momentum could push the index toward R1 (26,393).
A decisive breakout above this may extend the rally toward R2 (26,718) and eventually R3 (27,027).
❌ Bearish Scenario:
If the index fails to sustain above 25,988, short-term weakness may emerge, dragging Nifty toward S1 (25,747).
A breakdown below this zone could open the path toward S2 (25,426) and S3 (25,088).
A weekly close below 25,088 may signal a deeper correction.
Disclaimer: aliceblueonline.com

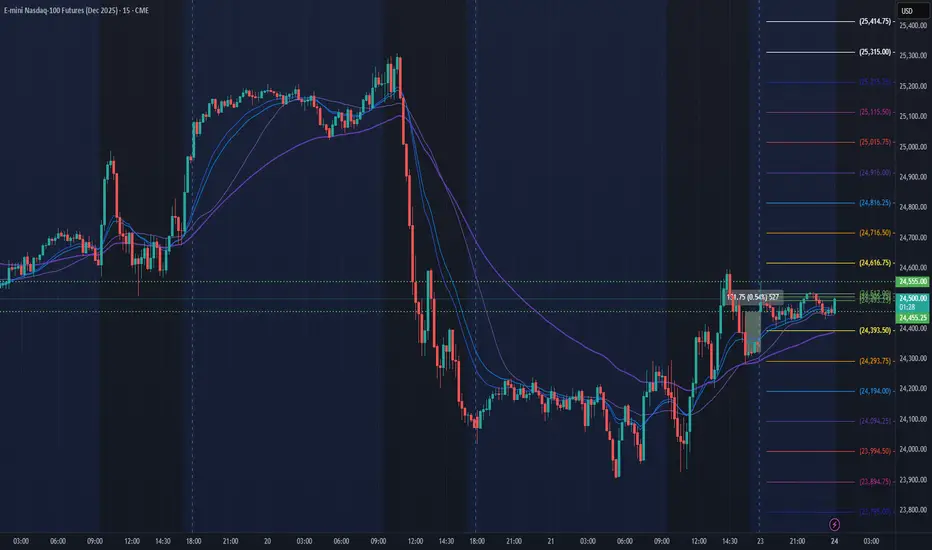
NQ Power Range Report with FIB Ext - 11/24/2025 SessionCME_MINI:NQZ2025
- PR High: 24555.25
- PR Low: 24455.25
- NZ Spread: 223.5
No key scheduled economic events
Low participation expected for short Thanksgiving holiday week
Session Open Stats (As of 12:05 AM)
- Session Open ATR: 533.61
- Volume: 41K
- Open Int: 298K
- Trend Grade: Long
- From BA ATH: -7.4% (Rounded)
Key Levels (Rounded - Think of these as ranges)
- Long: 26636
- Mid: 25410
- Short: 24039
Keep in mind this is not speculation or a prediction. Only a report of the Power Range with Fib extensions for target hunting. Do your DD! You determine your risk tolerance. You are fully capable of making your own decisions.
BA: Back Adjusted
BuZ/BeZ: Bull Zone / Bear Zone
NZ: Neutral Zone
BTC Fibo RetracementIn the meantime, here is my BTC plan. Now we are very close to ATH and I would wait for next retracement to enter long, if we are going to 120.
Zone Of Interest combines several reasons to make an entry.
• 0.5 Fibo
• Sell Side Liquidity
• Valid 8H FVG
• And a border of discount zone
It is not at all necessary that the price will fall to these levels, but if it will, I`ll be watching price action there and make my decision.
Have a good trades!

AAVE Retracement Long Entry ZoneStructure broken. Looking for a Fibo retracement to enter Long. Target Levels are supply POI on the chart.

$BTC planCRYPTOCAP:BTC depending on weekly close I will go long or short. Reclaim trendline and I will go long. Stay below and I will short it.

NZDCHF LONG3M is bullish and it's currently holding nicely above the 2020 high with early signs of bullish market structure, waiting for further confirmation, but it looks juicy here at the moment.
