ETH/BTCHere is the range I'm looking at for the ETH/BTC pair. A bounce in this box means buying Ethereum will be more profitable than Bitcoin.
Pivot Points

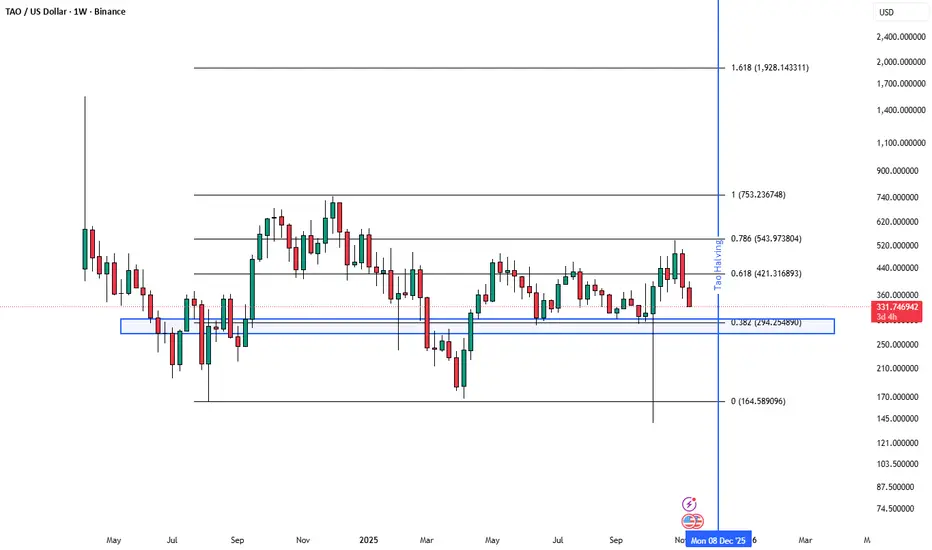
$TAO PlanGETTEX:TAO I put my buy orders in blue box. This is around 300/270 dollars. Also on the montly and weekly chart you can see this is a strong support. With 0.382 fib level around $294, I think this box will hold and we will see a bounce from it.
$Aster low timeframe planTrying this SEED_WANDERIN_JIMZIP900:ASTER short with low risk. We have a resistance here on 4h timeframe and expect the price to dump from this area. But since the market is unsure I'm using low risk for this trade.

$HYPE planSetting bids 40.3/39.5 area for $HYPE. With a support line on 37.77. Rsi below 50 on 1h timeframe. The orange line is an important area on low and high time frame which is why I'm bidding it.

$ETH Macro planI made this CRYPTOCAP:ETH cheatsheet. I'm looking to bid 2900-2700 area. As you can see we lost the level on weekly timeframe. And retesting it this week. A close below means we will likely go to my marked area.

$BTC MacroCRYPTOCAP:BTC following my macro plan. I will start adding in the purple box. We might get a short term bounce but we never got the $106250 which was an important level for us to go higher with btc and potentially see $109000. But now we have lost $100000 I think we will likely end op hitting 88/92k

The Future of the Crypto Ecosystem: Will Bitcoin Rise Again?Following Trump’s directive to support digital currencies, Bitcoin surged from around $69,000 to a peak price around $126,000.
But after a period of major turbulence, Bitcoin began to lose value. Based on monthly Ichimoku timeframe analysis and Andrews’ Pitchfork , our models suggest Bitcoin could fall back to around $70,000 in the coming period.
We expect this downward trend to continue until early 2027.
The big question is: what happens after that? Will Bitcoin re-value and recover, or will it get stuck around these low levels, potentially threatening thousands of smaller altcoins?
ZEN is Bullish (4H)The structure of ZEN is completely bullish, and we are looking for demand zones and supportive order blocks to enter long positions, since buy setups align with the bullish structure and therefore carry lower risk.
There is a key zone on the chart; as long as ZEN remains above this level, the market stays bullish. Only if the specified zone gets broken and cleaned out can we say that there is confirmation for ZEN to turn bearish.
Do not enter the position without capital management and stop setting
Comment if you have any questions
thank you

Nifty Analysis EOD – November 18, 2025 – Tuesday 🟢 Nifty Analysis EOD – November 18, 2025 – Tuesday 🔴
26K Rejection: Bears Take Control, Wiping Out Previous Day’s Gain!
🗞 Nifty Summary
Despite lingering negative global sentiment, the Nifty opened with a modest 13-point Gap Up, but the bullishness quickly vanished. The index dipped 97 points in the first minute and eventually found a base near the critical 25880 support, marking the day’s low at 25,882. After a gradual recovery to test the previous resistance levels of 25944 and 25977, the index met the same fight near the 25980 ~ 26000 zone.
The rejection from the psychological 26K mark proved decisive, pushing Nifty sharply back down toward the day’s lows. The day closed at 25,910.05, resulting in a loss of 103.40 points (or -0.40%).
This move erased all of the previous day’s gains and confirmed a clear sign of rejection at the upper levels. The move was tricky, briefly breaching the PDL and hinting at manipulation ahead of the upcoming expiry. The trend confirmation remains pending, and caution is advised.
🛡 5 Min Intraday Chart with Levels
🛡 Intraday Walk
The session was dominated by bears, right from the opening bell, despite the initial small gap-up. The sharp morning decline established the day’s direction. The mid-session saw bulls attempt to reclaim ground, but the recovery was consistently capped by strong supply near 26,000. The failure to hold this key level resulted in the late-day sell-off, closing the index back near the bottom of its trading range.
This volatile price action, marked by the day’s range engulfing the previous day’s range, strongly suggests an upcoming period of higher volatility or a potential change in the short-term trend bias.
📉 Daily Time Frame Chart with Intraday Levels
🕯 Daily Candle Breakdown
Open: 26,021.80
High: 26,029.85
Low: 25,876.50
Close: 25,910.05
Change: −103.40 (−0.40%)
🏗️ Structure Breakdown
Type: Bearish candle
Range (High–Low): ≈ 153 points — indicating higher volatility for the session.
Body: ≈ 65.25 points — clear bullish dominance for the day.
Upper Wick: ≈ ~8 points — confirming immediate rejection and almost no strength from buyers near the open.
Lower Wick: ≈ ~34 points — buyers did attempt to defend the 25880 support, but the recovery was limited.
📚 Interpretation
The strong bearish body and the close well below the open are clear indicators that the upward momentum has stalled, and selling pressure is currently dominant. The small upper wick confirms that the bearish sentiment was present from the very beginning. This candle’s large range, encompassing the previous day’s action, is often a warning sign of a shift in market sentiment.
🕯 Candle Type
Bearish Candle with Lower-Wick Support — A strong bearish signal, moderated slightly by limited buying interest near the day’s lows.
🛡 5 Min Intraday Chart
⚔️ Gladiator Strategy Update
ATR: 194.58
IB Range: 134.05 → Medium
Market Structure: Balanced
Trade Highlights:
10:47 Long Trade - Target Hit (R:R 1:4.57)
12:54 Long Trade - Target Hit (R:R 1:3.28)
14:03 Long Trade - SL Hit
Trade Summary: Despite the overall bearish market structure, the Gladiator Strategy successfully capitalized on the strong counter-trend buying attempts in the mid-session, yielding two high R:R profitable long trades. The final short trade was stopped out due to the sharp reversal back to the lows.
🧱 Support & Resistance Levels
Resistance Zones:
25944
25977
26010 ~ 26040 (Crucial Rejection Zone)
Support Zones:
25880 ~ 25865 (Current Base)
25790
25740 ~ 25715 (Ultimate Support)
🧠 Final Thoughts
“Caution is the watchword until the range is broken.”
The market has now established a high-volatility range between 26,040 (Resistance) and 25,865 (Support). I will maintain a cautious bullish sentiment only until a decisive breach and close below the lower level of 25700 occurs, or until bulls achieve a solid close above 26100. The upcoming sessions are likely to remain choppy as this indecision plays out.
✏️ Disclaimer
This is just my personal viewpoint. Always consult your financial advisor before taking any action.

FF Looks Bullish (2H)FFUSDT has been ranging within a zone for a while, taking out both buyers’ and sellers’ stop-losses. After creating a large liquidity pool at the bottom and sweeping that lower pool, it now appears ready to move toward the key level.
On this timeframe, we have a bullish outlook on the FFUSDT pair.
Do not enter the position without capital management and stop setting
Comment if you have any questions
thank you

Gold Ready for Reversal? Price Tapping Key Liquidity“Gold is tapping into a major liquidity pocket.
If we hold this zone, a sharp bounce is on the table — if not, prepare for deeper expansion.
Watching this level for a high-probability reaction.”
“Price just swept liquidity under the recent lows and tapped into a clean demand zone.
If smart money defends this area, the move up could be explosive.
This is the zone I’m watching for a sniper entry.”

SOL — Deep Pullback Into Major SupportSOL has been in a steady freefall over the past weeks. On the higher timeframes the key support and resistance zones are very clearly defined. The $250 level acted as a big resistance area, with multiple rejections showing sellers were firmly in control up there.
On the downside, the $125 support zone has shown clear strength, with bulls defending this area and producing strong bounces each time price revisited it.
The swing low at $126 presents an attractive long opportunity, especially with the sell-side liquidity and the quarterly level at $124.54 sitting just below, adding further confluence. Additionally, the anchored VWAP from the $8 low lies around $114, aligning almost perfectly with the 0.886 Fibonacci retracement at $113.3, providing deeper support should price extend lower.
Long Entry Zones:
0.786 Fib: $129.13
0.886 Fib: $113.3
Why the 0.786–0.886 Zone Is a Major Reversal Area
The 0.786–0.886 Fib zone is one of the best spots to look for a reversal after a deep pullback. It’s where strong trends often take their final dip before bouncing.
Here’s why it works so well:
It’s the typical “deep correction” zone in strong trends.
Price usually sweeps sell-side liquidity here before reversing.
Many harmonic patterns use this exact area as their turning point.
It often lines up with anchored VWAPs or volume nodes, adding extra support.
It’s basically the capitulation zone where weak hands exit right before a bounce.
Overall, it’s a clean area with clear invalidation and great R:R → perfect for spotting high-probability reversal setups.
_________________________________
💬 If you found this helpful, drop a like and comment!

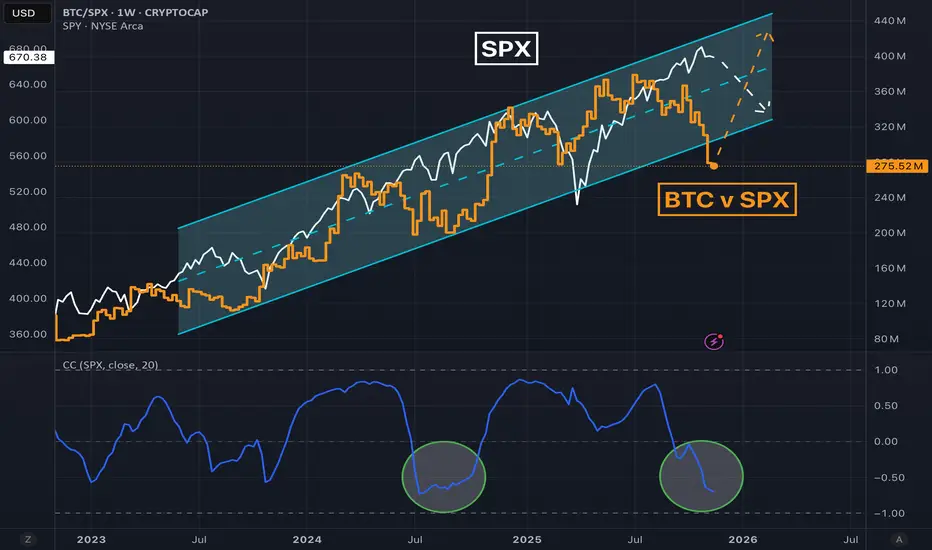
Upcoming rotation from big tech to crypto?Tech SP:SPX and crypto CRYPTOCAP:BTC have been tightly correlated despite suggestions that crypto is a hedge. Therefore it's surprising to see the relative outperformance in tech this year.
In fact, Bitcoin has just gone negative on the year, while the stock market is up double digits again after a sharp April drawdown.
History suggests that crypto / stock relationship should return to a tight correlation, but how do we get there? Will stocks hold and crypto appreciate? Will crypto hold and stocks depreciate?
I think crypto could dig in around current levels, but there's a very good chance I'm mental lol!
Buy the bottom of the PayPal uptrendNASDAQ:PYPL is known to be a high value stock with a depressing valuation.
Investors are under optimistic due to the struggling performance the past several years after a dizzying rally during the pandemic.
Recently the stock rallied on earnings due to a deal with Open-AI. Shares quickly gave the spike back and headed lower along with a broader tech pullback on AI bubble fears.
NASDAQ:PYPL has now undercut a long term upward trend line. Judging by the past few times this has happened, it could be a fantastic setup. It looks like the downtrend was broken in late 2024 when the price bottomed on an RSI divergence. The shares seem to be coiling up for a big move, and have been for almost a year now.

BTC possible scalping buyI would like to see BTC drop into the 94,100 zone to look for a potential bullish rebound, targeting the 97,900 area. This plan only becomes valid if we get a clear bounce inside the grey support zone marked at the bottom of the chart.
However, if price prints a strong bearish candle with a large body in that zone, I will not take the long setup. Instead, I would shift my bias and look for an opportunity to continue trading with the downward trend, aiming for lower levels.
The key here is confirmation, not anticipation — reacting to what price shows, not what we hope to see.
Summary:
📍 Long setup: Only if BTC shows a clear bounce at 94,100 → Target 97,900.
❌ Invalidation: A strong bearish candle in the zone.
🔄 Plan B: Look for shorts if support fails decisively.

EURUSD Long: Buyers Targeting a Move Toward 1.1670 ResistanceHello traders! EURUSD is maintaining a bullish structure after rebounding from the Demand Zone at 1.1600–1.1610, where buyers consistently stepped in to defend support. This area also aligns with the Demand Line of the ascending channel, making it a key decision point for the current uptrend. Earlier, the pair formed a Rounding Top near the 1.1650–1.1670 Supply Zone, which triggered a downside breakout and a short-term correction. Once price reached the pivot point around 1.1530, buyers regained control and initiated a steady recovery, forming a clean ascending channel.
Currently, EURUSD is approaching the Supply Zone at 1.1650–1.1670, which also aligns with the Supply Line of the channel — creating a strong confluence resistance area. A breakout above this zone would confirm bullish continuation toward the next major liquidity cluster. As long as the pair holds above the Demand Line, the bullish structure remains intact. A minor pullback toward the 1.1610–1.1620 Demand Zone would be considered a healthy correction within the trend.
My scenario as long as EURUSD stays above 1.1600–1.1610, buyers remain in control and the bullish channel is valid. The primary upside target is 1.1670, which serves as both a Supply Zone and a key structural resistance. A confirmed breakout above 1.1670 would signal continuation toward higher levels and mark a shift into a stronger bullish phase. If the pair rejects the Supply Zone, a pullback toward 1.1620–1.1600 is likely, where buyers may re-enter. A break below 1.1600 would weaken the bullish outlook and open the path toward deeper correction. For now, the market favors buying pullbacks while holding above demand. Manage your risk!
