Mana is looking to recover a bit (8H)Mana is approaching a key origin of movement, a zone that previously delivered a significant impulsive move, which we have clearly identified and labeled with a BOS (Break of Structure). This highlights the importance of this area from a market structure perspective.
Additionally, there is a major key level in this region that aligns and overlaps with the movement origin, adding further confluence and increasing the probability of a reaction from this zone.
It is important to note that the recent bearish move has retraced the entire previous bullish leg in a much shorter time, which signals strong bearish pressure. Because of this, risk management is critical. From this area, we are primarily looking for a bullish reaction or corrective bounce, rather than immediately expecting a full trend reversal.
We have identified two entry zones, and positions should be built using a DCA (Dollar-Cost Averaging) approach to reduce risk and improve average entry price.
There are two upside targets defined. At Target 1, it is recommended to move the position to break even and secure partial profits. The remaining position can be held toward the higher target as long as structure remains valid.
⚠️ Invalidation:
A daily candle close below the invalidation level will invalidate this bullish scenario and indicate that further downside is likely.
If you have a coin or altcoin you want analyzed, first hit the like button and then comment its name so I can review it for you.
This is not a trade setup, as it has no precise stop-loss, stop, or target. I do not publish my trade setups here.
Pivot Points

ICPUSDT The overall trend of BINANCE:ICPUSDT is bearish, as the price is below the 200 EMA and the EMAs are sloping downward. Currently, the price is near the support level of 3.300 USD, and if this level is broken, a further decline toward 2.865 USD is possible.
Supports:
3.300 USD 🛑
2.865 USD 🛑
2.300 USD 🛑
Resistances:
3.700 USD 🔼
4.356 USD 🔼
5.500 USD 🔼

USDT DOMINANCE Analysis (4H)We are currently observing a well-defined and complete market structure on USDT Dominance. The presence of a bullish Change of Character (CHoCH), along with a strong and decisive break of the bearish trendline, clearly suggests that buyers have stepped into the market and that selling pressure from bears is weakening.
From a technical perspective, this shift in structure indicates a potential trend reversal or at least a strong corrective move to the upside in USDT dominance. As expected in such scenarios, price is likely to pull back toward the identified support zone before continuing its movement toward the previously marked targets. This pullback can be seen as a healthy retracement and a possible opportunity for confirmation rather than immediate continuation.
An increase in USDT dominance typically signals risk-off behavior, meaning capital is flowing out of riskier assets. Therefore, if this scenario plays out, it strongly implies that Bitcoin and most altcoins may experience further downside pressure, leading to more red candles across the crypto market.
For traders, this index can be a valuable macro-level confirmation tool. It is crucial to manage risk carefully, avoid overexposure, and adjust your trading plan in alignment with USDT dominance behavior. Always wait for confirmation, respect key levels, and make sure your position sizing and risk management strategy reflect the current market conditions.
Trade smart, stay disciplined, and let the market confirm the move before committing.
If you would like us to analyze a coin or altcoin for you, first like this post, then comment the name of your altcoin below.

BITCOIN is still bearish (12H)Bitcoin Liquidity Sweep & Bearish CH – What Traders Need to Know
As we can clearly see on the chart, Bitcoin has already swept the liquidity above the structure, successfully triggering a bearish Change of Character (CHoCH). This move confirms that the market is shifting toward bearish momentum, and the bulls have lost control.
But the story doesn’t end there. After clearing the upper liquidity, Bitcoin has now also swept the liquidity below the chart. This is a classic sign of liquidity hunting by market makers and smart money, aiming to collect stops and pending orders before pushing the market in the desired direction.
What to Expect Next (High-Probability Scenario)
Once the liquidity below the market has been taken out, we typically expect a temporary retracement or pullback to the upside. This retrace serves two key purposes:
It allows the market to breathe and shake out weak hands,
It helps market makers gather more liquidity before continuing the main move.
After this expected pullback, we anticipate that price will resume its downward movement, continuing the bearish structure.
Entry Strategy (DCA Plan)
We have identified two clear entry zones, designed for DCA (Dollar-Cost Averaging). This approach allows traders to:
enter with lower risk,
reduce entry price uncertainty,
and avoid the danger of catching the exact bottom.
Target Zone
Our target can be one lower liquidity level (one lower “L”), which aligns with the overall bearish structure and liquidity flow.
Key Takeaways for Traders
Liquidity sweeps indicate market maker activity
Bearish CH confirms the shift in trend
A temporary pullback is likely after liquidity hunting
Use DCA for safer entries
Target can be the next lower liquidity level
If you would like us to analyze a coin or altcoin for you, first like this post, then comment the name of your altcoin below.

Nifty Analysis EOD – January 30, 2026 – Friday🟢 Nifty Analysis EOD – January 30, 2026 – Friday 🔴
The Calm Before the Storm: Nifty Coils for Budget-26!
🗞 Nifty Summary
As predicted, Friday was a “silent” consolidation session characterized by narrow range-bound movement and pre-event manipulation.
The day started with an unexpected 150-point Gap Down that tested our second support at 25,270. Nifty found its footing at the Fib 0.786 level, which acted as a rock-solid floor throughout the day.
A late-session attempt to break the IBH and the Long-Term Trendline at 1:50 PM briefly crossed the 25,335 mark, but the momentum faded precisely at the Fib 0.618 retracement level.
Nifty eventually closed at 25,320.65 (-0.39%), positioning itself exactly in the center of a high-stakes 700-point battlefield.
🛡 5 Min Intraday Chart with Levels
🛡 Intraday Walk
The session was a classic “wait-and-watch” game.
The 157-point range—significantly lower than the Gladiator average of 260—confirms that institutional players are sitting on the sidelines ahead of Sunday’s Budget.
While the intraday volatility offered some scalp opportunities, the false IBH breakout served as a trap for those over-anticipating the move.
The market is now balanced on a knife-edge, with the daily close sitting equidistant from major targets on both sides.
📉 Daily Time Frame Chart with Intraday Levels
🕯 Daily Candle Breakdown
Open: 25,247.55
High: 25,370.70
Low: 25,213.65
Close: 25,320.65
Change: -98.25 (-0.39%)
🏗️ Structure Breakdown
Type: Small Bullish Candle according CDO (Bearish according to PDC)
Range: ≈ 157 points — significantly compressed volatility.
Body: ≈ 73 points — mild selling pressure from the gap-up rejection. (Same size of Previous day)
Upper Wick: ≈ 123 points — strong supply rejection from the 25,370 zone.
Lower Wick: ≈ 34 points — limited buying interest at the extreme lows.
📚 Interpretation
The candle structure is the definition of indecision. The long upper wick proves that sellers are still capping any pre-emptive rallies, while the narrow body reflects a lack of directional conviction. The market has effectively “coiled,” and this compression usually leads to a violent expansion once the Budget news hits the tape.
🕯 Candle Type
Bearish Rejection / Consolidation Candle — Signals a standoff; the Budget session will be the ultimate tie-breaker for this structure.
🛡 5 Min Intraday Chart
⚔️ Gladiator Strategy Update
ATR: 254.37
IB Range: 104..20 → Medium
Market Structure: Balanced
Trade Highlights:
12:23 Long Trade: SL Hit (Mistake: Assumed HTF break based on STF trend; recency bias).
13:54 Long Trade: Trailing Hit (1:0.76) (HTF Trendline Breakout).
Psychology Note: As explicitly mentioned in yesterday’s note, today was intended to be a “No-Trade” day due to expected pre-event consolidation. However, greed and recency bias triggered entries in a non-conducive environment.
The market punished the mistake, providing a stern reminder that discipline is more important than catching every tick.
🧱 Support & Resistance Levels
Resistance Zones:
25,370
25,430 ~ 25,460
25,515
25585 ~ 25605
25650 ~ 25,670
Support Zones:
25180 ~ 25160
25,060
25009
24970 ~ 24920
🧠 Final Thoughts
🧠 Special Budget-26 Note :
The Nifty has closed at 25,320, which is exactly the center point between the 25,670 resistance and the 24,970 support (350 points each way).
For the Budget day, it is highly probable that Nifty will test at least one of these extremes.
A sustained breach of the 25,160–25,460 range will be our “Prime Trade” signal.
✏️ Disclaimer
This is just my personal viewpoint. Always consult your financial advisor before taking any action.

Back inside the channel Textbook move back to channel. Look for shorting ops on retest of top of channel and buying ops at the lower end esp $4400 for a good buy area

Potential trading ideaDead cat bounce then steeper falls to $55ish with some relief rallies along the way? I was waiting for a hit on the channel mid line but we didn't get there today but I think that is a good area to catch a dc bounce next week.

$ZETA good place to build positionNYSE:ZETA is checking back into prior resistance / upsloping support. good place to enter a defined trade. Exit position with a weekly close below key trendlines.
Beware of upcoming earnings if you don't want to hold long term

GDX – Gold Miners Beta to BullionVanEck Gold Miners ETF (GDX) tracks a basket of global gold mining stocks, typically offering higher beta and volatility than spot gold ETFs. This chart is for capturing leveraged exposure to the gold theme: I’m marking structural demand zones, prior capitulation lows, and breakout levels to time long entries when miners begin to outperform bullion.

GOLD(XAUUSD): +8000 Pips Possible Swing Buy, Is This Possible?Dear Traders,
The market has been extremely volatile recently, fuelled by widespread uncertainty. Trading in these conditions is extremely dangerous and could easily wipe out your accounts. However, we see an excellent opportunity. The price could drop around $4740, which would be a critical level for a price reversal and a potential all-time high.
We recommend waiting for the price to reach this level before trading gold today.
Team Setupsfx_


XAUUSD: Trend in 4-H timeframePlease pay special attention to the accurate trend, and magic colored levels.
Its very sensitive setup, ...............<<<<<<<<<<<<<<<<<<<<<<<
Be careful
BEST
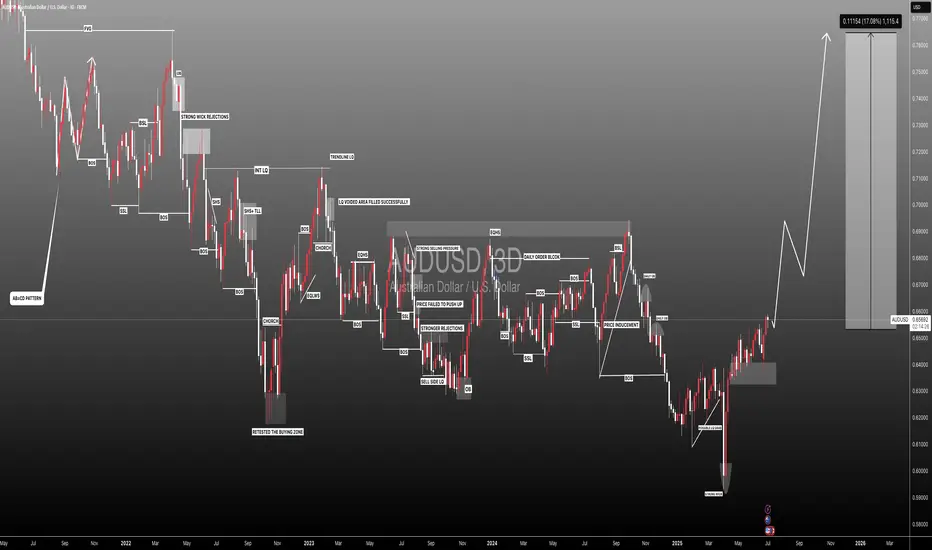
MT

#AUDUSD: +1100 Pips Possible Swing Bullish Move! AUDUSD a strong sign of bullish behaviour has appeared alongside bullish momentum. As we have NFP tomorrow, we expect market to remain volatile; what we think now is to have market settled down before we can have any confirmation. We recommend to remain extra cautious tomorrow, once market get settled we can then enter with accurate risk management.
Like, comment and Share for more!
Team Setupsfx_
GBPCAD: Perfect Buying Opportunity In Making Worth 1000+ PipsDear Traders,
The GBP/CAD pair is at a turning point, and it might just reverse! Recent market data indicates a strong upward trend, with the pair gaining over 1000 pips in the last cycle. This surge is backed by increasing trading volume and a convincing week-closing candle, with smaller timeframes also showing the momentum shift.
📌Looking at the financial side, the pair has appreciated by 6% from 1.6700 to 1.7700 over the past month. Average daily trading volume has increased by 18%, and the volatility spikes have created swing opportunities. The 14-day ATR is 0.0125, suggesting a daily range of about 125 pips. Monthly pivot levels hint at possible support around 1.7450 and resistance at 1.7850, which aligns with our target zones.
📌We’ve identified two target levels: near 1.7800 and around 1.7950. If the price breaks through the initial resistance, momentum could push towards the higher target, potentially adding 150 pips. Traders holding standard lot positions could expect a gross movement value of £1,000 per 100 pips, assuming proper risk management.
📌Recent economic data seems to favour the GBP. The Bank of England’s focus on controlling inflation and the slight contraction in Canadian trade balances support this. The CAD’s connection to crude oil is still a factor, and any drop in oil prices could further boost GBP gains. Overall, the forex market’s liquidity conditions suggest that GBP/CAD is sensitive to macroeconomic catalysts.
Trading Plan📊🧠
- Use the 4-hour timeframe to find an ideal entry point near the 1.7500 support area.
- Aim for a risk-to-reward ratio of at least 1:2, considering a larger stop-loss of 80–100 pips to handle volatility spikes.
Set your first take-profit at 1.7800 and think about closing a portion of your position. If the price action confirms the breakout, adjust your stop-loss to breakeven and target 1.7950 as your secondary goal. Keep an eye on volume and candlestick patterns around key levels, as these will help you decide whether to extend or close your swing trade.
Good Luck Trade Safe, For More Like And Comment ;
Thank you ❤️
Setupsfx_

#EURUSD: Three Take Profit With One Swing Entry! 2026 TargetDear Traders, 🚀
Hope you are doing great, we have an excellent opportunity coming up for EURUSD, buying at our buying zone can be beneficial for swing traders. There is one entry zone, and there are three targets or take profit points. We are expecting the trade to completed by end of the year.
We will keep you all updated❤️
Team Setupsfx_

Key Levels & Bias — XAUUSD (Gold)Timeframe: 1H
Date: 30 Jan 2026
Update: Intraday
🔹 Bias
Bullish Reversal (Buy the Dip – Conditional)
🔹 Key Levels
Resistance / TP Zone: 5514.30
Major Supply Above: 5580 – 5600
Strong Demand / Support Zone: 5000 – 5100
Current Price Area: ~5087
🔹 Technical Context
Price corrected sharply after a parabolic rally.
Market is testing a high-probability demand zone.
Trendline broken → focus shifts to horizontal structure.
Projection suggests W-formation / double bottom potential.
🔹 Trade Idea (Not a Signal)
Prefer buy confirmation from demand.
Entry only after bullish structure shift / confirmation.
Conservative traders wait for 15m confirmation candle.
⚠️ Risk Note
Strong bearish momentum recently.
Avoid blind entries — confirmation is key.
Disclaimer ⚠️: This is not a financial advice

Short Initial target $99LEG 1: Silver careering down towards the first target at $99
LEG 2: On break of channel $80 comes into play.
LEG 3: Price stabilisation around $60.

$TSLA looks "Cheap" but it can always get cheaperTSLA has been consolidating in a flag here. While price could break up out of it, I actually lean towards price breaking to the downside. The reason is because there have been more tests on the downside, and I think if price falls and tests it again, it'll break.
That and, if you turn on Heikin Ashi candles, it looks like bearish momentum is starting on higher timeframes (1D-4D) and Ichimoku giving bearish warning signals in the cloud formation.
I think the most likely outcome is that we break lower and go test the box below for a new low. Everyone would get bearish down there, but that will be a great level to buy for the long term.

ETH Sell/Short Setup (4H)Based on the price reaction at the FLIP zone, the loss of the ascending trendline, and the formation of a bearish CH (Change of Character), it seems that bearish momentum is starting to take control of the market. These factors together suggest a potential shift in market structure in favor of the sellers.
We have marked two red dashed lines on the chart, which represent our planned entry zones. These areas are selected based on structure and price behavior, not emotions or anticipation.
The targets are clearly defined and labeled on the chart in advance. Risk management is a priority in this setup. Once Target 1 is reached, the position should be moved to break-even in order to protect capital and eliminate downside risk.
If the stop loss is triggered, it simply means we are out of the trade—no revenge trading, no overthinking. This is part of the plan and must be respected.
Now we wait and let the market decide. Patience and execution matter more than prediction.
Normally, we do not share such clean and straightforward setups here. This example is posted purely for educational purposes, to demonstrate how we approach structure-based trading and risk management.
Let’s see how price reacts and what the market delivers.
If you have a coin or altcoin you want analyzed, first hit the like button and then comment its name so I can review it for you.
This is not a trade setup, as it has no precise stop-loss, stop, or target. I do not publish my trade setups here.

$SPY the beginning of a covid style selloff? 20-32% drop?It is finally time for a larger selloff to happen. As you can see, we've broken down out of a rising wedge and many people are calling for another scenario to buy the dip, but this dip doesn't look the same as all of the other dips.
To me, this looks more like the start of a larger selloff. My thesis is that this selloff will be a cross between the selloff that took place in 1989 and covid. I think we're about to see a 20-32% drop that comes very quickly not giving people time to get out.
The past two days we're already trading exactly like we did in covid, where we can see sharp rallies that are met with more selling.
The reason this selloff is different is because volatility is starting to react and I have strong buy signals on the weekly timeframe while I'm getting weekly sell signals on SPY.
While my base case was that we'd only get a 20% selloff down to the $550-560 area on the chart, I won't rule out the possibility of the market selling off to the next support level down at $468-$481.
The selling should get stronger once we're under the $666-672 level and volatility will start to rise quickly. Under the $650 level should be lights out for the market.
Again, I think this selloff is going to happen very quickly over the next few weeks, so I'd be cautious buying any dips.
Let's see how it plays out.

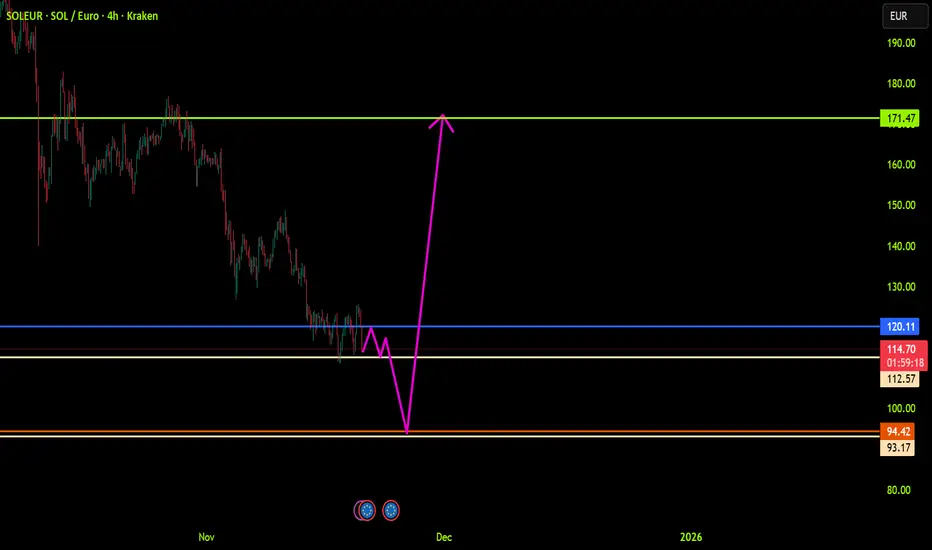
SOLEUR: Trend in 4-H time frameThe color levels are very accurate levels of support and resistance in different time frames.
A strong move requires a correction to major support and we have to wait for their reaction in these areas.
So, Please pay special attention to the accurate trends, colored levels, and you must know that SETUP is very sensitive.
BEST,
MT
VRAUSDT: Trend in weekly time frameThe color levels are very accurate levels of support and resistance in different time frames, and we have to wait for their reaction in these areas.
So, Please pay special attention to the very accurate trend, colored levels, and you must know that SETUP is very sensitive.
Be careful
BEST
MT
