RELIANCE Unleashed | Bulls Roaring StrongThis is the daily timeframe chart of Reliance.
Reliance is moving in a strong momentum phase and is consistently respecting the Supertrend indicator.
Based on Supertrend, the key support level is at 1518.
Currently, the stock is trading above multi-timeframe pivot levels, indicating short-term momentum strength.
Buying opportunities may be considered near the 1530–1540 range.
The stock has a strong support zone around 1515–1520.
Potential upside target is near 1620.
If the support zone sustains, we may see higher prices in Reliance in the coming sessions.
Thank you.
Pivotstrategy

ETH — Using Fibonacci for High-Precision TradingUnderstanding Tools, Confluence & Today’s Setup
I’ve been getting a lot of DMs asking what the best indicator is.
The truth? There is no universal “best indicator” because indicators are tools, and every tool serves a different purpose. Trading is like carrying a toolbox: the skill isn’t in having the tools, but in knowing when and how to use them.
Educational Segment: Why Fibonacci Should Be Your Foundation
After years of studying different systems, I’ve come to a very simple conclusion:
👉 Fibonacci tools are the most powerful and reliable in my entire arsenal.
Why?
They help you spot reversal zones with precision
They work across all market conditions
They are rooted in natural ratios that markets consistently gravitate toward
They create predictable targets, retracements, extensions, and even timing when used correctly
Indicators like oscillators etc. are best used as confirmation, not as the primary signal.
If I had to pick one indicator besides Fibonacci, it would absolutely be the VWAP.
Why the Anchored VWAP Is Incredibly Underrated
It shows where true volume-weighted market support + resistance lies
It adapts dynamically
It works extremely well as a dynamic support/resistance line
It is fantastic as a trailing stop-loss tool
It helps identify institutional footprints in price structure
Fibonacci + VWAP is one of the strongest forms of confluence you can build.
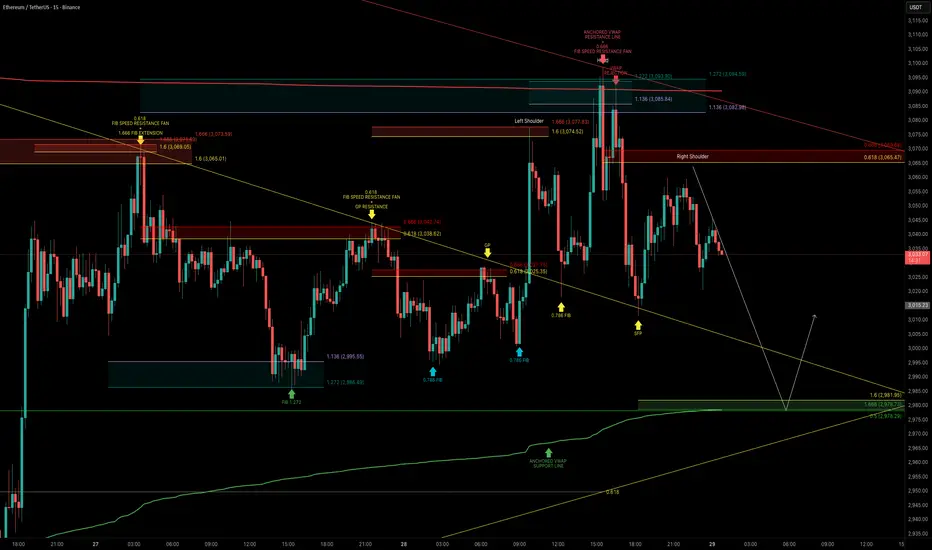
ETH Technical Breakdown
Today, ETH attempted a breakout but the move failed, and the rejection was clean.
ETH rejected at the anchored VWAP aligned with Fibonacci reversal zone:
ETH tested the anchored VWAP near $3,090 twice, coinciding with the 1.136–1.272 Fibonacci Reversal Zone.
This confluence acted as a strong resistance, leading to a swift selloff soon after.
Key Confluence Level Below:
My next major downside target lines up with a cluster of confluences:
1.6-1.666 Fibonacci extension
0.5 Fibonacci retracement
Anchored VWAP (green support line)
Liquidity zone (demand area)
0.618 Fibonacci speed fan support
Educational Takeaway → Confluence Is King
If there’s one lesson to internalize:
The more factors that align at the same level or zone, the higher the probability of a successful trade.
This ETH range has provided several high-quality setups for anyone who understands how to read price through Fibonacci.
Final Notes
ETH remains in a well-defined trading range use confluence, stay patient, and let the market come to your level.
_________________________________
💬 If you found this helpful, drop a like and comment!
Kotak Near Crucial Support Zone — Opportunity AheadThis is the daily timeframe chart of Kotak Bank.
The stock is moving within a well-defined parallel channel, with a key support zone around 1950–2000.
When applying the Fibonacci retracement from the recent low to high, the 2050 level aligns as an important support area.
This 2050 zone is also confirmed by the pivot levels—whenever this level holds, the stock avoids further decline and maintains a range-bound movement. For the past month, Kotak Bank has been trading between two key pivot levels:
Quarterly Pivot: 2050
Monthly Pivot: 2120 (which will shift after monthly expiry)
A breakout above the monthly pivot can trigger further upside, with potential targets around 2330–2350.
If the support continues to hold, we may see higher levels in the stock.
Thank you.

EUR/USD It is at OB LVL and pivot lvl cpr sell limitI've been waiting for this level for several days for EUR/USD. I'm expecting a drop in it, always with a risk appetite.
CSB Bank Gaining Strength – Momentum Trade Setup ActiveCSB Bank – Daily Timeframe Analysis
Stock has taken reversal from Supertrend support.
Currently trading above Pivot level.
Supertrend support lies near ₹400 zone.
Daily MACD has given a positive crossover and is moving in the positive zone.
If this support sustains, momentum is likely to continue upward.
Possible new highs can be seen in the coming sessions.

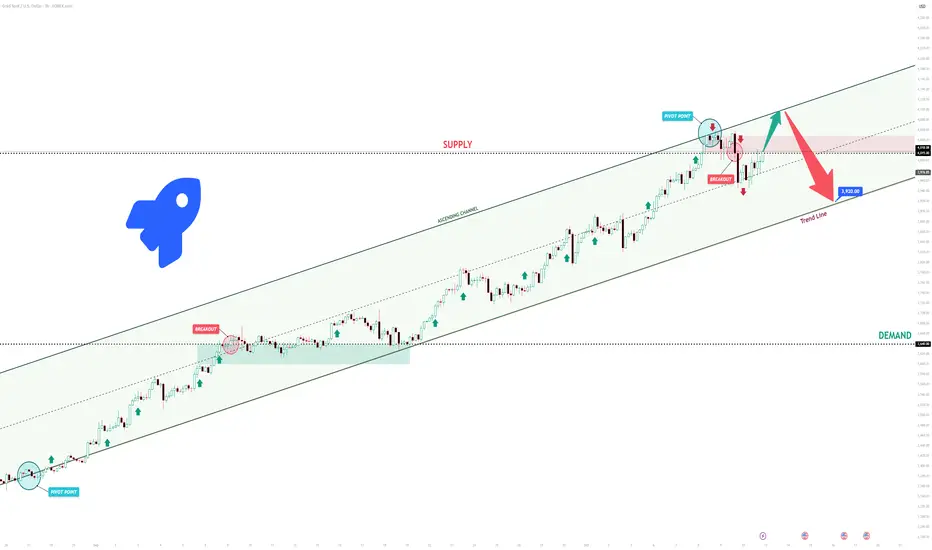
XAUUSD Short: Correction to 3920 Expected from the HighsHello, traders! The price auction for XAUUSD has been dominated by a strong bullish trend, which has been clearly defined by a large ascending channel. The market has consistently made higher highs and higher lows, breaking through key resistance levels like 3640 and showing that the buyer initiative has been in firm control of the trend.
Currently, the auction has reached a major point of contention at the 4015 supply level. The price is consolidating here, right below the upper resistance line of the ascending channel, after a failed initial attempt to break higher. This area represents a significant test for the continuation of the uptrend.
My scenario for the development of events is a 'blow-off top' followed by a correction. I believe the price will make one final push, breaking the 4015 level to touch the channel's upper resistance line. In my opinion, this move will be exhaustive, and a sharp reversal will occur from that line. The take-profit is therefore set at 3920, targeting a retest of the nearby trend line. Manage your risk!
BTCUSD: Watching for Exhaustion at the HighsHello everyone, here is my breakdown of the current Bitcoin setup.
Market Analysis
From a broader perspective, the price action for Bitcoin has been extremely volatile, with multiple failed breakdowns and breakouts. After a complex struggle, the most recent significant event was a powerful breakout above the 116800 level, followed by a successful retest, which confirmed the shift in control to buyers.
Currently, following that breakout, the price has entered a high-momentum rally. This upward impulse is strong but is becoming technically extended, which often increases the probability of a sharp corrective pullback as buyers begin to take profits.
My Scenario & Strategy
My scenario is a tactical short, aiming to capture this likely corrective move. After such a strong, impulsive rally, a pullback to test the original breakout level is a very common and healthy market dynamic. I'm anticipating that the price will make one last small push to a new high, where it will likely fail to find new buyers.
Therefore, the strategy is to watch for this exhaustion at the highs. A confirmed reversal would validate the short scenario. The primary target for this corrective move is the 116800 level, which aligns with the key Support zone.
That's the setup I'm tracking. Thank you for your attention, and always manage your risk.

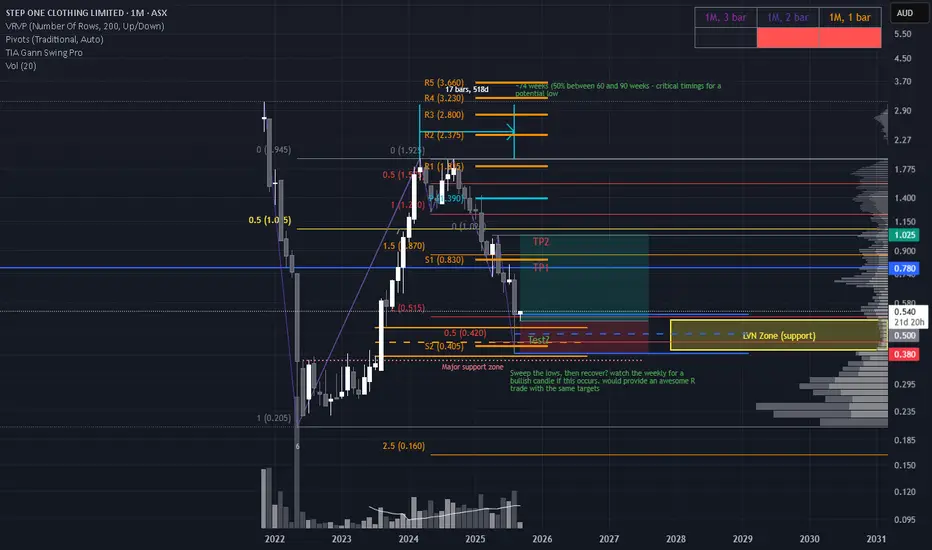
High-Risk, High-Reward Setup at Critical Confluence ZoneSTP is offering a compelling—but extremely high-risk—opportunity. As a nanocap stock with no confirmed uptrend, risk management must be the top priority.
Price has retraced into a major Fair Value Gap (FVG) from August 2023, and notably, the August 2025 candle printed a strong demand wick on elevated volume. This zone aligns with:
The 200% Fibonacci extension from the double top at 1.940
The 50% extension from the 1.900 swing high to the April 25 low
A 74-week decline from the 1.950 high, marking a significant Gann time support—a detail seasoned time-cycle traders will appreciate
This confluence suggests a structurally significant support zone where price may be preparing for a reversal.
Trade Scenarios
Option 1: Wait for a Wick Retest Price may revisit the demand wick/yearly s2 pivot, offering a more refined entry with improved risk-to-reward. Look for a strong daily or weekly bullish candle off the retest, with the stop-loss placed just below the wick.
Option 2: Enter Now with Wick as Anchor Aggressive entry at current levels, using the base of the large demand wick as your stop-loss. This approach allows price to develop organically while maintaining a defined risk profile and if there is a retest of the wick then could add more to the position (must be in line with your risk appetite) but just food for some thought.
Option 3: Liquidity Sweep & Reversal Price could sweep the lows of the demand structure, triggering stop-losses and trapping late shorts. A sharp reversal from this move would confirm a classic liquidity grab—ideal for reactive entries once momentum shifts.
This setup is rich with technical nuance and timing precision. Whether you're trading the wick, the sweep, or the structure itself, the key is disciplined execution and respect for volatility.
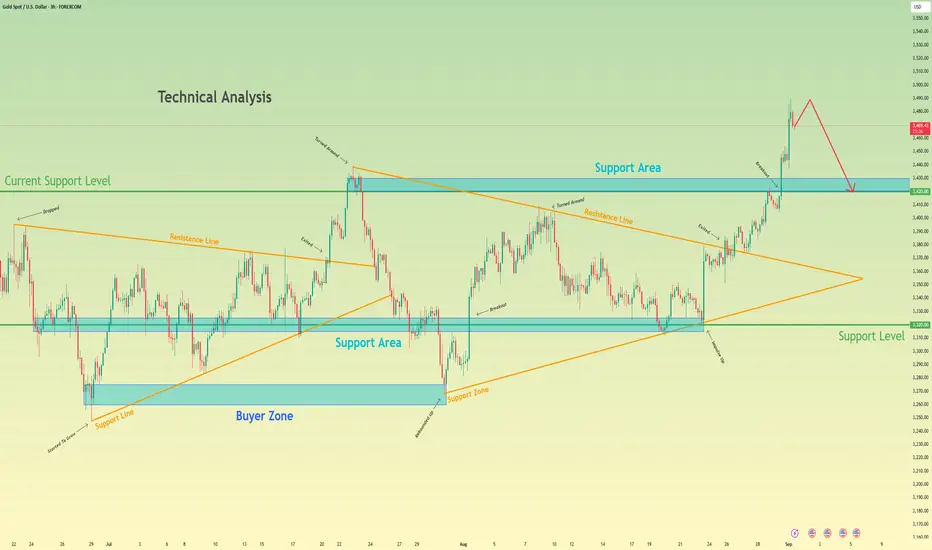
Gold may make correction, after strong upward movementHello traders, I want share with you my opinion about Gold. The prolonged period of consolidation for Gold has decisively resolved to the upside, following a powerful breakout from a multi-week symmetrical wedge. This event signalled a clear shift in market control to buyers, invalidating the prior ranging environment and initiating a new, impulsive bullish phase. The price action for XAU since the breakout has been characterised by a strong, high-momentum rally that has pushed the asset to new highs. Currently, this upward movement appears to be overextended, suggesting that the market may be due for a healthy corrective pull-back. The primary working hypothesis is a short, counter-trend scenario designed to capture this anticipated correction. The expectation is that the current rally will soon find a peak, exhaust itself, and undergo a sharp decline back towards the breakout point. This corrective fall would be a natural part of a healthy uptrend, allowing the market to test the old resistance as new support. Therefore, the TP is logically placed at the 3420 level. This target is highly significant as it corresponds precisely with the current support level and the support area where the breakout originated. Please share this idea with your friends and click Boost 🚀
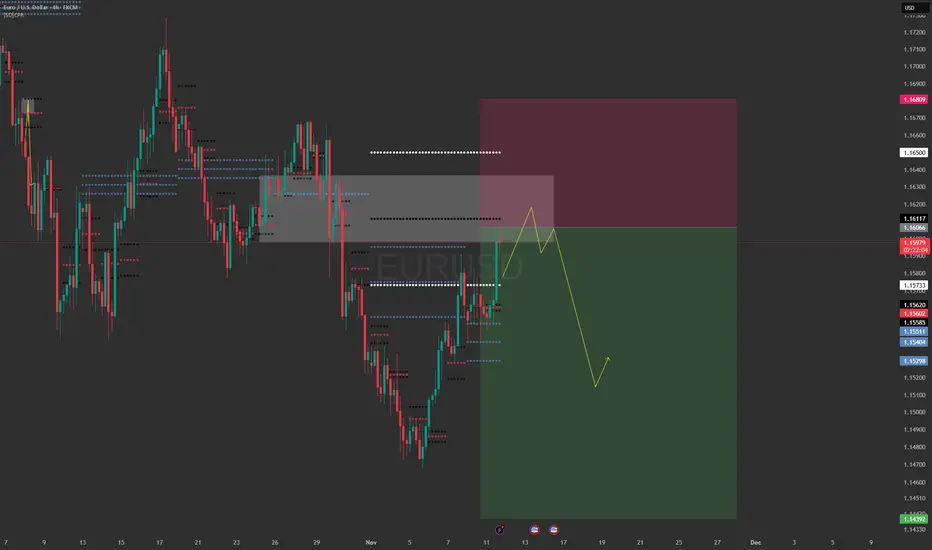
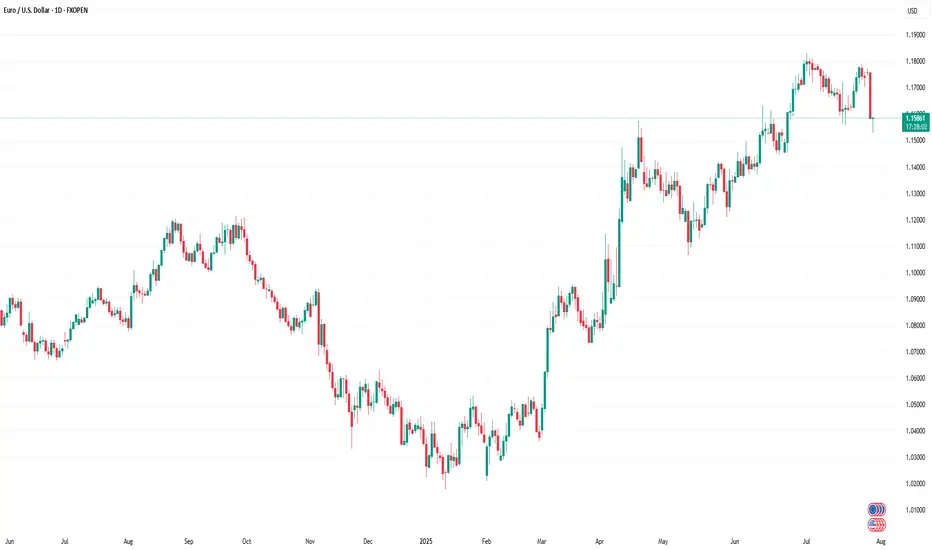
EURUSD Short: Drop from Supply LevelHello, traders! The price auction for EURUSD has been characterized by a period of consolidation, which has formed a large symmetrical triangle. This pattern of contracting volatility was established by a series of key pivot points, with a pivot point high anchoring the 1.1720 supply area and a pivot point low defining the 1.1575 demand area. These actions have set the stage for the current state of market equilibrium, squeezing the price between the supply line and the demand line.
Currently, the auction is at a critical inflection point. Following a bounce from the ascending demand line, the price has rallied across the pattern and is now directly testing the descending supply line. This area represents a significant confluence of resistance, as it aligns with the horizontal 1.1720 - 1.1740 supply zone, a known territory of seller activity.
The primary scenario anticipates that sellers will successfully defend this resistance confluence and reject the current rally. A confirmed failure to break above the supply line would validate the integrity of the triangle pattern and likely initiate a new downward rotation. This would shift the short-term initiative back to the bears. The take-profit for this rotational play is therefore set at 1.1620, targeting the ascending demand line. Manage your risk!

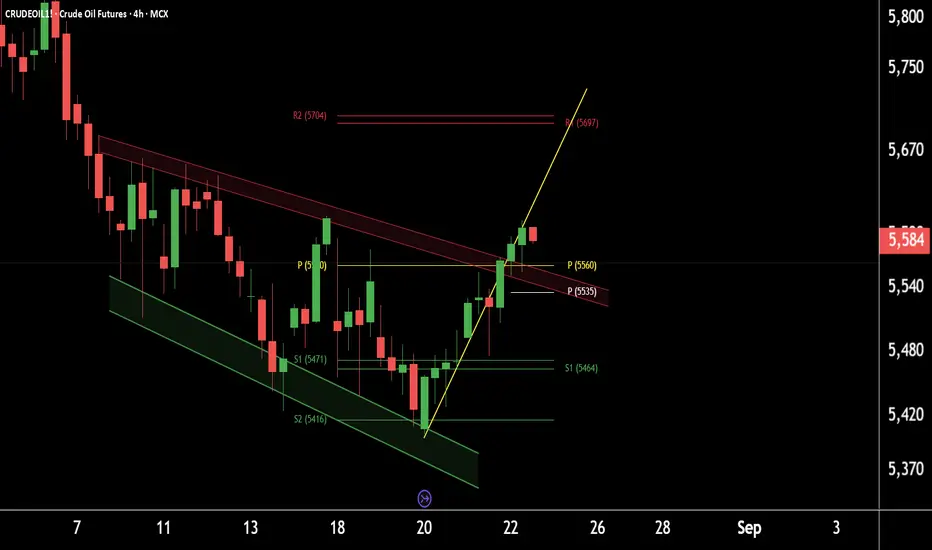
Crude Oil breaks out of falling channel –Watch for higher level.This is the 4-hour timeframe chart of CrudeOil1!.
The price has been moving within a well-defined falling channel and has now given a breakout. A possible retest of the breakout level around 5560 may occur, after which CrudeOil could move towards the falling channel completion target near 5700.
Weekly pivot support is also placed around the 5400–5450 zone and resistance around 5700.
If this level is sustained, we may see higher prices in CrudeOil1!
Thank You !!
How Do Traders Use the Pivot Points Indicator? How Do Traders Use the Pivot Points Indicator?
Pivot points are a popular technical analysis tool for spotting areas where the price is expected to react, i.e. pause or reverse. Calculated using the previous day’s high, low, and close, they’re projected onto the current session to highlight potential support and resistance levels, especially useful for intraday traders.
Alongside stock charts, pivot point levels can be used in a wide variety of markets, including forex, commodities, and cryptocurrencies*. As a versatile indicator, pivot points also come in many different types. This article breaks down the definition of pivot points, the variations traders use, and how they can fit into a broader trading strategy.
A Deeper Look at Pivot Points
A common question in technical analysis is, “What is a pivot point?” Pivot points trading, or pivot point theory, is a popular technical analysis concept used in a range of financial asset classes, including stocks, currencies, cryptocurrencies*, and commodities. The indicator assists traders in gauging overall market trends and determining possible support and resistance barriers.
How to Read Pivot Points
The pivot point indicator is static—it’s an average of the high, low, and close prices from the previous trading day. It includes three levels: pivot point (P), support (S), and resistance (R). If the price is above the pivot point, it is supposed to target resistance barriers. Conversely, if it’s below the pivot, it could move to support levels. Thus, support and resistance levels serve as targets or stop-loss zones. They remain constant throughout the period, enabling traders to plan ahead.
In the EURUSD daily chart below, the price is trading above R2; therefore, market sentiment is assumed to be bullish. R3 indicates the next possible price target. Should a shift below P occur, bearishness arises, and S1 becomes the upcoming support level.
Pivots are widely used with trend indicators such as moving averages and Fibonacci tools. In the chart below, Fibonacci retracements could be used to identify intermediate levels of support and resistance within widely placed pivots.
How to Calculate Pivot Points?
There are four key types of pivots, including standard, Woodie’s, Camarilla, and Fibonacci. While there’s no need to use a pivot points calculator—they’re calculated automatically when implemented on a price chart—it is worth looking at their formulas to understand how they differ from each other.
Note the labels for the following formulas:
P = pivot point
H = high price
L = low price
C = close price
Standard Pivot Points
Traders commonly use standard pivot points. Traditional pivots (P) identify potential levels of support (S) and resistance (R) by averaging the previous trading period's high, low, and close prices.
P = (H + L + C) / 3
S1 = (2 * P) - H
S2 = P - (H - L)
R1 = (2 * P) - L
R2 = P + (H -L)
Although they are popular among traders, they can produce false signals and lead to incorrect trades in ranging markets and during periods of high volatility.
Woodie’s Pivot Points
Woodie's pivots are similar to standard pivots but include a slight modification to the calculation. In Woodie's method, the close price is assigned more weight.
P = (H + L + 2 * C) / 4
R1 = (2 * P) - L
R2 = P + H - L
S1 = (2 * P) - H
S2 = P - H + L
However, their extra sensitivity can make them less reliable during choppy markets or when the price lacks a clear direction.
Camarilla Pivot Points
Camarilla pivots use a set formula to generate eight levels: four support and four resistance. They are based on the previous day’s close and range and multiplied by a certain multiplier. The inner levels (R3 and S3) often act as reversal zones, while R4 and S4 are watched for breakouts. Still, in trending markets, the reversals can fail frequently.
R4 = C + (H - L) x 1.5
R3 = C + (H - L) x 1.25
R2 = C + (H - L) x 1.1666
R1 = C + (H - L) x 1.0833
P = (High + Low + Close) / 3
S1 = C - (H - L) x 1.0833
S2 = C - (H - L) x 1.1666
S3 = C - (H - L) x 1.25
S4 = C - (H - L) x 1.5
Fibonacci Pivot Points
Fibonacci pivot points are based on the Fibonacci sequence, a popular mathematical concept in technical analysis.
They are calculated in the same way as the standard indicator. However, the levels of support and resistance are determined by including the Fibonacci sequence with a close monitoring of the 38.2% and 61.8% retracement levels as the primary price points.
P = (High + Low + Close) / 3
S1 = P - (0.382 * (H - L))
S2 = P - (0.618 * (H - L))
R1 = P + (0.382 * (H - L))
R2 = P + (0.618 * (H - L))
Despite their popularity, Fibonacci pivots can become less reliable when the price reacts to other fundamental drivers.
Trading with the Pivot Points
Although every trader develops their own trading approach, there are common rules of pivot point trading that are expected to improve their effectiveness.
Day Trading
Day trading with pivot points is usually implemented for hourly and shorter intraday timeframes. As pivot levels are updated daily and calculated on the previous day's high, low, and close prices, this allows traders to react promptly to market changes and adjust their strategies. Some traders prefer Camarilla pivots as their calculation takes into account the volatility of the previous trading period to produce pivot levels closer to the current price.
Medium-Term Trading
When looking at a medium-term analysis, weekly pivot levels are added to four-hour and daily charts. These are calculated using the previous week's high, low, and close prices, which remain unchanged until the start of the next week.
Long-Term Trading
For longer-term analysis, traders use monthly pivots on weekly charts. These levels, gathered from the previous month's data, offer a broader picture of market trends and price movements over time.
Pivot Point Trading Strategies
The pivot points indicator is typically used in two ways – breakout and reversal trading.
Breakout Trading Strategy
The breakout approach seeks to take advantage of market momentum by entering trades when prices break above or below significant levels of support and resistance.
- Bullish Breakout. When levels P and R1 are broken, and the price closes above either, it’s more likely a rise will occur.
- Bearish Breakout. When levels P and S1 are broken, and the price closes below either, it’s more likely the price fall will occur.
Strong momentum and high volume are two critical factors needed for a solid price movement in both cases.
Trading Conditions
If a breakout is confirmed, traders enter a trade in the breakout direction. A take-profit target might be placed at the next pivot level. A stop-loss level can be placed beyond the previous level or calculated according to a risk/reward ratio. Traders continuously monitor their trades and adjust their stop-loss levels to lock in potential returns if prices move in their favour.
Reversal Trading Strategy
The reversal strategy seeks to take advantage of a slowdown in market momentum by entering trades when prices stall at significant levels of support or resistance.
- Bullish Reversal. When levels S1 and S2 are not broken and the price stalls above either, a reversal is more likely to occur.
- Bearish Reversal. When levels R1 and R2 are not broken and the price stalls below either, a reversal is expected to happen.
Note: Reversals are always confirmed by another indicator or a chart pattern.
Trading Conditions
If a reversal is confirmed, traders consider entering a trade in its direction. The next level may be a take-profit target, which might be trailed to the next level if the market conditions signal a continuation of a price move. A stop-loss level is typically placed below a swing low or above a swing high, depending on the trade direction.
Pivot Points and Other Indicators
While pivots show where the price may reverse, there’s nothing to say a market won’t trade through these areas. Therefore, traders typically pair them with other technical indicators and patterns.
Candlestick and Chart Patterns
Traders often combine levels with specific reversal candlestick formations, like three black crows/three white soldiers or engulfing patterns, to confirm a change in market movements. For example, a bullish engulfing candle forming at S1 could reinforce the idea of a reversal at that level.
Moving Averages
When a pivot aligns with a major moving average, e.g. the 50-period or 200-period EMA, it strengthens the area. As moving averages act as dynamic support and resistance levels, an overlap can signal a strong area where a reversal might occur.
RSI and Stochastic Oscillator
Momentum indicators like RSI or Stochastic help judge whether the price is likely to bounce or break through a pivot. If it hits support and RSI is oversold, that adds conviction. But if momentum is still strong in one direction, it might get ignored.
Considerations
Even with strong confluence, these combinations can fail. Markets don’t always respect technical alignment, especially around data releases or sharp movements in sentiment. For instance, in stocks, pivot points may be ignored if an earnings release strongly beats analyst estimates. Instead, they are believed to work when treated as one piece of a broader technical framework.
Limitations
Pivot points are widely used, but like any tool, they have flaws. They’re based purely on past price data, so they don’t account for news, sentiment shifts, or broader market context.
- False signals in ranging markets: The price often oscillates around pivot zones in markets without a clear direction, meaning setups might not follow through.
- Less reliable during strong trends: In trending conditions, the price can blow past several levels without reacting.
- No built-in volatility filter: The points don’t adapt to changing volatility, so levels might be too close or too far apart to be useful.
- Lag in real-time shifts: Since pivots are pre-calculated, they don’t adjust mid-session as new data emerges.
Final Thoughts
Pivot points are widely used in stock trading as well as in commodity, cryptocurrency*, and currency markets. While they can be useful tools, their limitations cannot be overlooked. It is essential to conduct a comprehensive analysis and confirm the indicator signals with fundamental and technical analysis tools.
FAQ
What Is a Pivot Point in Trading?
The pivot point meaning refers to a technical analysis tool used to identify potential support and resistance levels. It’s calculated using the previous day’s high, low, and close prices, and helps traders find areas where the price may react during the current session.
What Is the Best Indicator for Pivot Points?
There isn’t one best indicator, but traders often pair pivot points with moving averages, RSI, or candlestick patterns to confirm a potential reversal. The most effective setup usually depends on the strategy and market conditions.
What Are the Pivot Points’ R1, R2, and R3?
R1, R2, and R3 are resistance levels above the central point. They represent increasingly stronger potential resistance zones where the price may stall or reverse.
Which Is Better, Fibonacci or Camarilla?
Fibonacci offers wider levels based on retracement ratios, useful in trending markets. Camarilla focuses on tighter reversal zones, which are mostly used for intraday strategies. Each suits different trading styles; neither is objectively better.
*Important: At FXOpen UK, Cryptocurrency trading via CFDs is only available to our Professional clients. They are not available for trading by Retail clients. To find out more information about how this may affect you, please get in touch with our team.
This article represents the opinion of the Companies operating under the FXOpen brand only. It is not to be construed as an offer, solicitation, or recommendation with respect to products and services provided by the Companies operating under the FXOpen brand, nor is it to be considered financial advice.
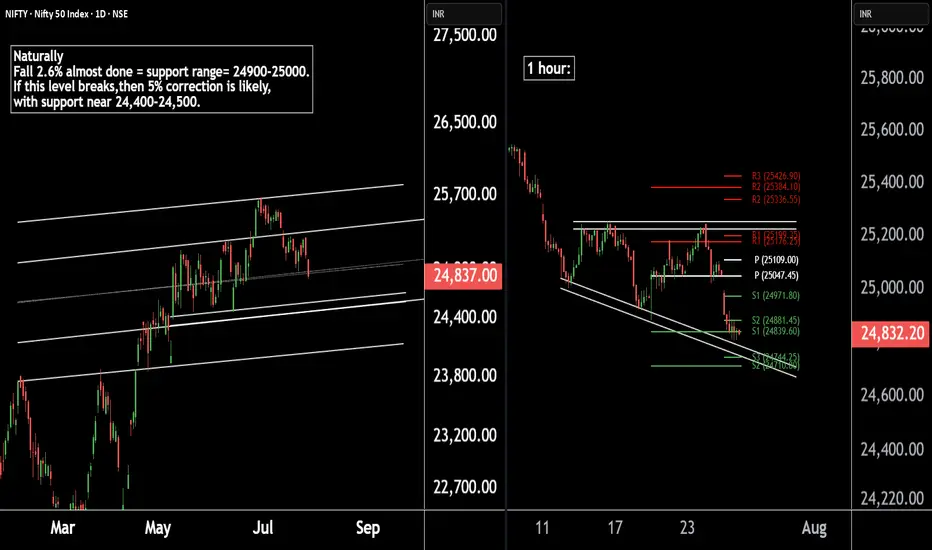
Nifty 50 Update | Technical Levels MappedThere are two chart of Nifty50.
Nifty 50 is trading within a well-defined parallel channel. As part of its natural corrective phase, a potential decline of around 5% cannot be ruled out, with key support anticipated near the 24,400–24,500 zone.
Nifty is forming a broadening wedge pattern on the 1-hour timeframe, with crucial support around 24,740. Additionally, both the weekly and monthly pivot supports are aligned in the 24,740–24,710 zone, reinforcing the significance of this level.
If this level sustain then we may see higher prices in Nifty50.
Thank You !!
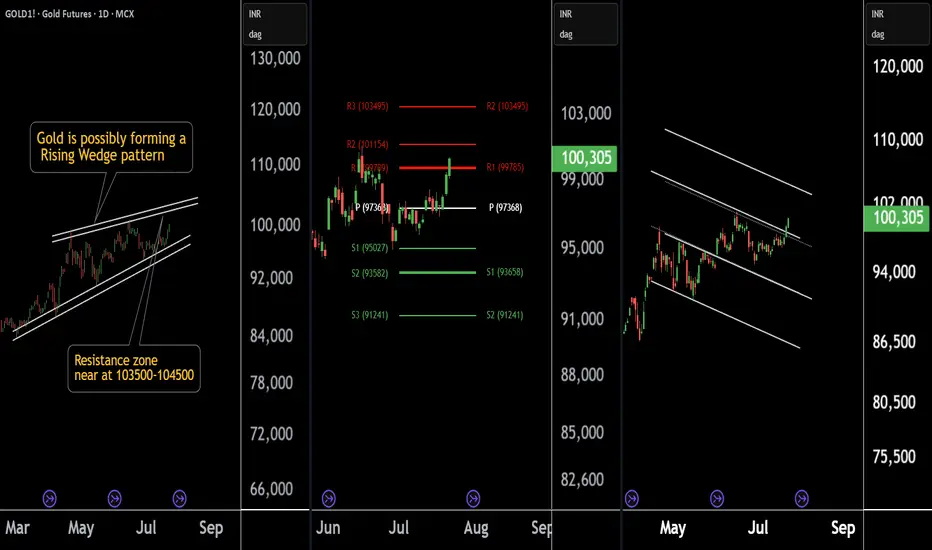
Gold at a Crossroad: Long or Short? Key Levels in FocusThere are three chart of Gold .
Gold1! is forming a Rising Wedge pattern, with resistance positioned between 103500-104000 levels.
Gold1! is facing Pivot Point resistance around the 103500 level, indicating potential supply pressure.
Gold1! is approaching the parallel channel resistance, and the upside move is nearly complete in percentage terms, with resistance around 103800-104000.
if this level sustain then we may see first of all higher prices then again fall in gold1!
Thank You !!
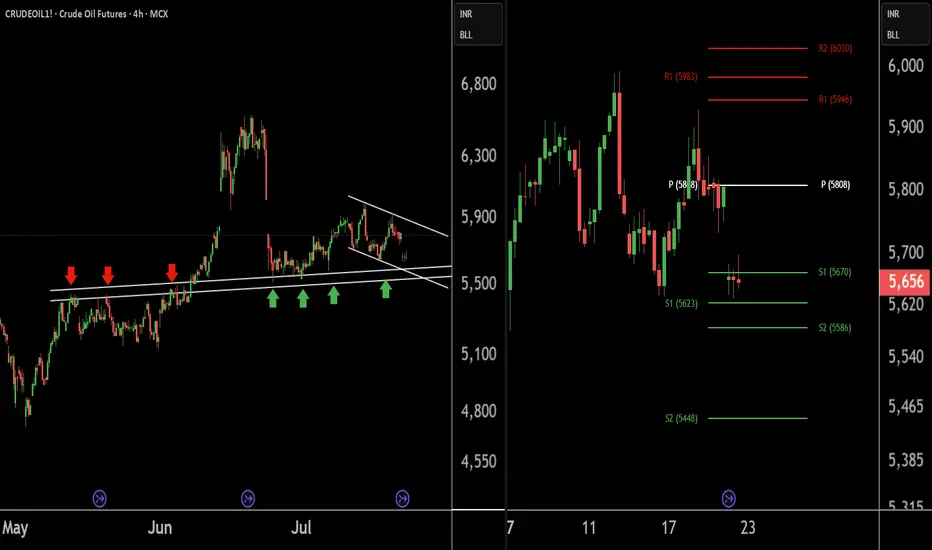
Crude Oil Buying Alert: Strategic Entry Point IdentifiedThere are two charts of Crude Oil on the 4-hour timeframe.
In the first chart, Crude Oil is sustaining near its lower point (LOP), with a support range of 5540-5580.
A-VWAP is also providing support to Crude Oil around the 5580 level.
The Pivot Point is also supporting Crude Oil around the 5580-5620 level.
If this level is sustain then we may see higher prices in Crude Oil.
Thank you !!
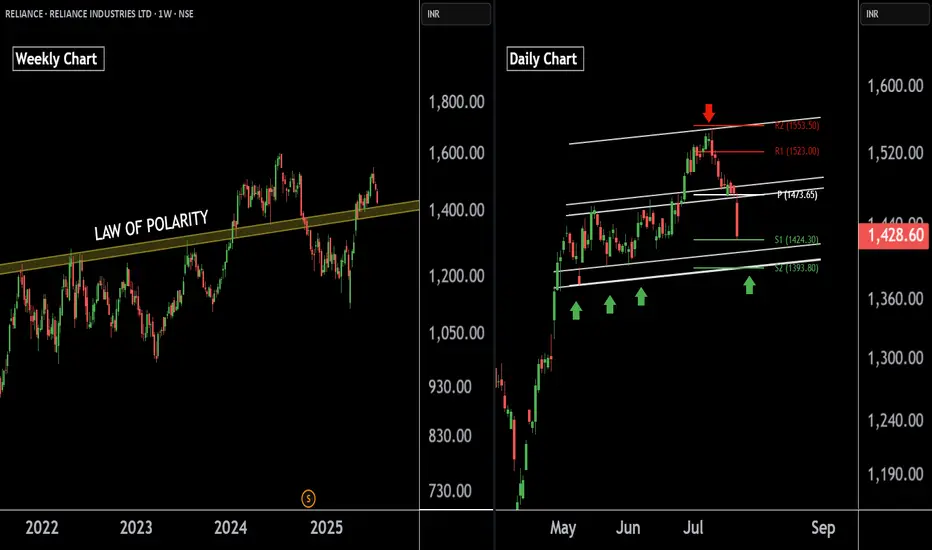
Reliance Industries — Preparing for the Next Bullish Leg !!There are two charts of Reliance Industries — one on the weekly timeframe and the other on the daily timeframe.
On the weekly timeframe:
Reliance industries is trading near (LOP), with a key support zone in the range of 1385–1400.
On the daily timeframe:
Reliance industries is moving in well defined parallel channel with support zone near at 1400-1410.the stock is also taking support at pivot levels S1 and S2, positioned between 1393 and 1422 levels.
If this level is sustain then we may see higher prices in Reliance industries.
Thank You !!
Exide Industries Ready for the Next Bull Run !! Powering Up !!there are two chart of Exide Industries.
In a first chart: EXIDEIND is moving in a well defined parallel channel and currently trading near at support 365-375 range
In the second chart,EXIDEIND is respecting support at both the monthly pivot and the supertrend indicator, with the support zone positioned between ₹365-₹370.
EXIDEIND is currently sustaining below both the monthly and weekly pivot levels at ₹290. As long as the stock does not break above this pivot zone, the momentum is expected to remain weak.
If this level is suatin then ,we may see higher prices in EXIDEIND.
Thank you !!

Copper1! at Best Support !!This is the 2 chart of Copper1! .
Chart 1 Analysis:
The stock is trading near a parallel channel support zone in the 880–890 range. This zone also aligns with the monthly pivot and weekly pivot support around 882–880. Additionally, the percentage fall is nearly complete near 885, further strengthening this level as a potential support zone.
Chart 2 Analysis:
On the monthly Heikin Ashi chart, support is observed near 864, while the weekly Heikin Ashi support lies around 880.6. By connecting key levels, it indicates that Copper may find support in the 880–885 zone.
Thank You !!

ZRX Linear Regression Trend pierces Bollinger Band Buy ZoneI use 3 Primary indicators to determine trade entries and exits
1) Pivot points - 1yr (Thinnest), 2yr (Medium), and 3yr (Thick Lines) are plotted with pivot in yellow, Resistance bands in Red / Pink hues, Support in Blue.
2) Fibonnaci Bollinger Bands - Midline in purple, 25% and 75% in yellow are buy and sell zones
3) Linear Regression - Linear regression dictates price action outside of major fundamental events.
For trades, I nearly always enter buys below the Bollinger midline and more typically like to buy in the bottom 25% of the Bollinger Band. I look for the linear regression channel to be intersecting price action, and usually target a pivot point for exits.
For ZRX Daily chart, we see the Red/Yellow LR channel has pierced the bottom 25% of the Bollinger Band, indicated by the thin yellow Bollinger Band. This is typically a reliable, low-risk entry. Once this occurs, I look for price action to travel through the linear-regression trend line as this indicates to me that sellers are exhausted and there is a solidly established price floor strong enough to push through the linear-regression line.
For ZRX, you can see that this has occurred several times in previous years, with a subsequent rise in price of 2-3 times the original buy zone.
For this trade, I am going long at .26 with a target just below the 3-year pivot of .65, which is solidly in the middle of that 2-3x range. I typically trigger out just below major pivots to get the best chance of trade execution while locking in solid gains.
Stop loss set at .20, which is the recent low.

14-04-25 USDJPY Pivot LevelHi team,
USDJPY pivot levels are set.
Watch out for break or bounce at these levels
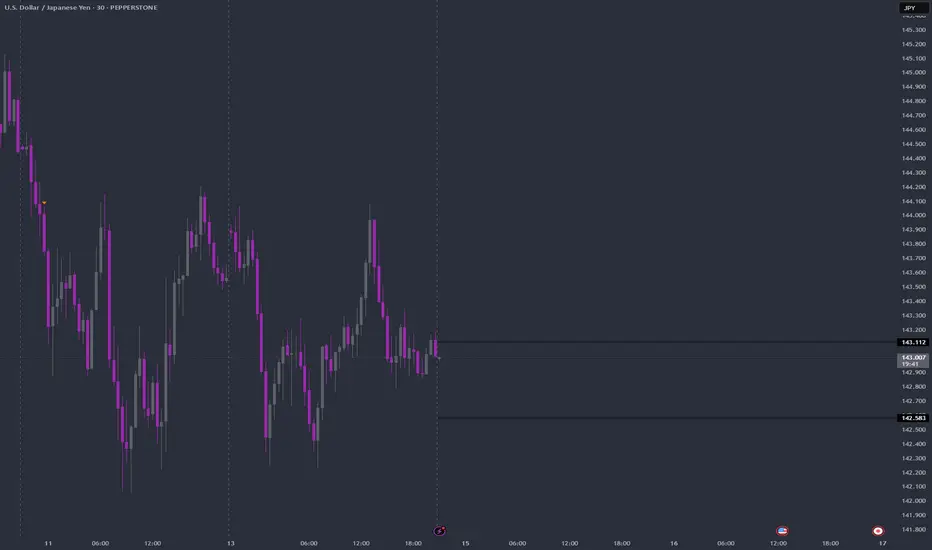
10-4-25 YEN Pivot LevelObserve again the function of pivot levels.
Use in conjunction with good money management plan

SUI Swing: The Art of Patience in TradingSUI has been playing nice with the technicals lately, giving us some really neat swing trade opportunities. Remember that short trade we talked about—from $3 down to around $2? Well, here's why that setup was a winner.
After that initial short trade, SUI bounced off $2 and then traded in a tight range between $2.5 and $2.2 for about two weeks. Then it broke higher to test the monthly open at $2.83—and it hit that level right on the dot. That’s where all the magic happens.
Why This Short Trade Worked
Fibonacci Confluence: When you draw a Fibonacci from the high at $3 to the low at $1.9626, the 0.786 level comes in at about $2.778. This is right near the monthly open, and we know that price tends to reverse between the 0.618 and 0.786 zones.
Trading Range POC: The $2.8 area was our previous point of control, so it adds extra weight as a resistance level.
Anchored VWAP: The VWAP from the high at $3.8999 sits just above the monthly open at around $2.855, giving us another nod that this level is important.
Fib Speed Resistance Fan: Even the speed resistance fan at the 0.618 level lines up with the $2.8 zone.
All these factors lined up to form a solid resistance area. That’s why short entries between $2.778 and $2.855 made sense.
Trade Setup Recap
Short Trade:
Entry Zone: $2.778 to $2.855
Target: The bullish order block at about $2.4745, which also lines up with the 0.618 fib retracement from the low at $2.2358 and the high at $2.8309
Risk-to-Reward: This setup gave us a risk-to-reward of 4:1 or even better, depending on where you set your stop-loss.
There’s also a possible long trade at the bullish order block, but that one’s only for when you see the confirmation.
Wrapping It Up
The takeaway? Confluence is your best friend. Waiting for that high-probability setup can really pay off. Let the trade come to you, don’t force it, and stay calm and focused.
Thanks for reading this SUI analysis. If you liked it, please leave a like and drop a comment. Happy trading!

AAPL: About to shift the trend! (D & H chartts)Daily Chart (Left)
Head and Shoulders (H&S) Pattern: A potential Head and Shoulders pattern is forming on the daily chart, with a neckline around the $221.33 level. If this pattern completes and the price breaks below the neckline, it could indicate a bearish reversal, signaling further downside.
Pivot Point: The pivot point at $228.66 is acting as a near-term resistance level. A break above this level could invalidate the H&S pattern, leading to a continuation of the uptrend.
21-Day EMA: The stock is hovering around the 21-day EMA, suggesting indecision in the market. Staying above this EMA could be positive for bulls, increasing the chances of an upwards breakout of the pivot point.
Hourly Chart (Right)
Cup and Handle Pattern: The hourly chart shows a potential Cup and Handle formation, with resistance at the $228.66 level. A breakout above this resistance could lead to a bullish continuation.
EMA Support: The 21-hour EMA has provided dynamic support, keeping the price within the handle formation. Holding this EMA and breaking the resistance could complete the Cup and Handle pattern, signaling further upside in the short term.
Trading Implications:
AAPL is at a crucial juncture. A break above $228.66 would favor a bullish outlook, while a break below the $221.33 neckline would indicate a bearish reversal. For now, we should watch these key levels closely for potential setups.
For more detailed technical analyses and insights like this, be sure to follow my account. Your support helps me continue providing valuable content to help you make informed trading decisions.
Remember, real trading is reactive, not predictive, so let's stay focused on the key points described above and only trade when there is confirmation.
“To anticipate the market is to gamble. To be patient and react only when the market gives the signal is to speculate.” — Jesse Lauriston Livermore
All the best,
Nathan.
