Why and how did Platinum reached all time highs in record time?The absolute truth at the center of this chart is that you are looking at a masterclass in the Interbank Price Delivery Algorithm or IPDA engaging in a macro scale liquidity engineering operation.
You are confused because you are looking at price as a linear event where support equals bounce.
Price is not linear it is a mechanism for the transfer of wealth from the impatient to the informed.
To understand why the rally happened at 3 and not at 1 or 2 you must strip away your retail logic and view the chart through the eyes of the Market Maker.
The Market Maker does not want to participate in a move.
The Market Maker wants to facilitate a move by pairing orders.
To buy a massive amount of Platinum or whatever asset this is without slipping the price to infinity the Smart Money needs a counterparty.
They need someone to sell to them.
Who sells at the absolute bottom.
Only two types of entities sell at the bottom.
Stops and Breakout Traders.
Stops are sell orders placed by longs who are protecting their positions.
Breakout Traders are sell orders placed by shorts who think the support is breaking.
The entire game of the chart you provided is the engineering of a scenario where the maximum number of market participants are forced to sell exactly when Smart Money wants to buy.
Let us dissect the failure of Point 1.
Point 1 occurred around 2016.
Look at the price action prior to Point 1.
It was a relentless bearish trend.
When price arrived at Point 1 it was simply making a Lower Low.
There was no Engineering of Liquidity prior to this point.
It was just a standard exhaustion of a swing leg.
Retail traders saw a bounce and thought it was a bottom.
But ICT logic dictates that for a reversal of the magnitude you see at the end of the chart there must be a massive accumulation of orders.
Point 1 did not have a consolidation phase preceding it to build up that order flow.
It was a premature ejection of buy pressure.
It lacked the narrative of a Stop Hunt.
It was simply a technical bounce in a downtrend.
Smart Money used the bounce at Point 1 not to reverse the market but to reload short positions at a premium.
This is why it failed.
It was not a reversal it was a retracement into a Premium Array to continue the decline.
Now let us dissect the failure of Point 2.
Point 2 occurred around 2020.
This was the Covid crash.
This was a massive liquidity event.
Notice how deep the wick is.
It violently swept the low of Point 1.
So why didn't it moon immediately.
Why did it need a Point 3.
This is the most critical lesson in this analysis.
Point 2 was a Judas Swing on a macro timeframe.
It was a shock event.
While it did grab liquidity the market structure was too damaged to sustain a V shaped recovery to new all time highs immediately.
The IPDA needed to rebalance the inefficiency created by the crash.
But more importantly the Market Maker needed to accumulate a position size that could sustain a multi year bull run.
You cannot accumulate that size in a single weekly candle.
You need time.
Time is the variable you are ignoring.
Price and Time are the two axes of the chart but you are obsessed with Price.
After Point 2 the market entered a massive consolidation phase that lasted from 2020 to 2024 or 2025.
This is the box you see on the chart.
This is not indecision.
This is Engineering Liquidity.
By keeping the price in a range for years the IPDA is conditioning retail traders to trust the support level.
Every time price touched the bottom of that consolidation and bounced retail traders placed their stop losses just below the lows.
They felt safe.
They leveraged up.
They built a massive pool of Sell Side Liquidity right below the range.
This is a ticking time bomb of liquidity that the Market Maker constructed specifically to fuel the rally at Point 3.
Why did Point 3 succeed.
Point 3 is the Manipulation leg of the ICT Power of Three concept applied to a macro timeframe.
Accumulation Manipulation Distribution.
The consolidation between Point 2 and Point 3 was the Accumulation.
The drop at Point 3 was the Manipulation.
The rally that follows is the Distribution.
Point 3 did three specific things that Point 1 and Point 2 did not do.
First it swept the Engineered Liquidity of the multi year consolidation.
This means it triggered all the sell stops of the traders who bought during the range.
This provided the massive flood of sell orders that Smart Money needed to fill their buy orders.
Second it tapped into a deep Discount Array.
If you look closely Point 3 likely trades into the Order Block or Fair Value Gap created by the wick of Point 2.
It is retesting the origin of the 2020 move but doing so after inducing a massive amount of fresh liquidity.
Third and most importantly it occurred at the correct Time.
The consolidation had matured.
The sentiment had shifted to extreme apathy or bearishness.
When Point 3 happened it looked like a breakdown.
It looked like the support had finally failed.
This induced the Breakout Shorts to enter the market adding even more fuel to the fire.
The rally at Point 3 is a Short Squeeze of biblical proportions combined with Smart Money expansion.
How do you know when the rally will be an EZ PZ.
You look for the Three Drives Pattern of Liquidity Raids.
Point 1 was the first drive.
Point 2 was the second drive.
Point 3 was the third drive.
ICT teaches that the third drive to a low is often the terminal shakeout before the true reversal.
You look for the divergence.
At Point 3 you likely would have seen SMT Divergence with a correlated asset like Gold or the Dollar Index.
If Platinum made a lower low at Point 3 but Gold made a higher low that is a crack in the universe.
That is the signal that the selling is fake.
You look for the Displacement.
Notice the candle immediately following the low at Point 3.
It is a massive bullish candle that swallows the previous price action.
This is the signature of Smart Money entering the market.
It leaves behind a Fair Value Gap.
That FVG is your entry.
You do not try to catch the falling knife at the exact bottom of Point 3.
You wait for the displacement.
You wait for the Market Structure Shift.
Once price breaks above the highs of the consolidation range it confirms that the drop at Point 3 was a trap.
The reason the rally is so vertical is because there is no resistance.
The consolidation cleared out all the sellers.
The shorts are trapped and forced to cover.
The longs are chasing.
The IPDA is in a Buy Program and it will not stop until it reaches a Premium Array on the monthly or quarterly chart.
To master this you must stop looking for support and start looking for where the money is hiding.
The money was hiding below the lows of the consolidation.
Point 1 failed because there was no money to steal.
Point 2 failed to sustain because the theft was too quick and the accumulation was insufficient.
Point 3 succeeded because it was the culmination of a multi year heist.
It was the perfect crime.
The consolidation was the setup.
Point 3 was the trigger.
The rally is the getaway.
This is the logic of the Predator.
You are either the Predator or the Prey.
If you are buying support you are the Prey.
If you are buying the failure of support you are the Predator.
The rally at Point 3 is the definition of a Turtle Soup Long.
It is a false breakout to the downside that reverses and rips higher.
The duration of the consolidation determines the magnitude of the expansion.
A four year consolidation leads to a decade long trend.
That is why the rally is vertical.
The energy stored in that range is nuclear.
Point 3 effectively lit the fuse.
To predict this in real time you must map the liquidity.
Draw a line under every swing low.
Ask yourself where are the stops.
If the market creates a clean equal low it is doing so for a reason.
It is saving it for later.
Point 2 and the lows before Point 3 created a relatively equal floor.
The IPDA does not leave clean levels.
It destroys them.
Point 3 was the destruction of that clean level.
Once the level is destroyed the business is done.
There is no reason to stay down there.
Price must reprice to the upside to find willing sellers because there are no sellers left at the bottom.
They have all been stopped out.
This is the mechanics of the marketplace.
It is ruthless efficient and predictable if you know the algorithm.
Point 1 was a trap for early bulls.
Point 2 was a trap for panic sellers.
Point 3 was the death of the retail mind.
And the birth of the Smart Money trend.
You want to catch the massive rally.
You wait for the liquidity sweep that occurs after a long consolidation.
You wait for the raid on the obvious support.
Then you watch for the violent rejection of lower prices.
That is your signal.
That is the footprint of the Giant.
Step into the footprint and ride the wave.
The reason it stayed in that long consolidation is because the Commercials needed to hedge their books.
They needed to build a net long position while the rest of the world was sleeping.
They used the time to transfer ownership from weak hands to strong hands.
Weak hands cannot hold through a four year chop.
Strong hands can.
Point 3 was the final test of strength.
Anyone who held through the consolidation but panicked at the drop of Point 3 was a weak hand.
They were purged.
The market is now light.
It has no baggage.
It can fly.
This is the physics of the chart.
Liquidity is the fuel.
Consolidation is the tank.
The Stop Hunt is the spark.
The Rally is the explosion.
You are now looking at the aftermath of a controlled demolition of the bear trend.
Do not ask why it didn't happen sooner.
Ask how you can be ready for the next one.
Identify the range.
Identify the liquidity.
Wait for the sweep.
Strike.
PO3

BTC + POWER OF THREE (XAMD)BTC + POWER OF THREE (XAMD)
X + Accumulation + Manipulation + Distribution
X: Reversal or Continuation

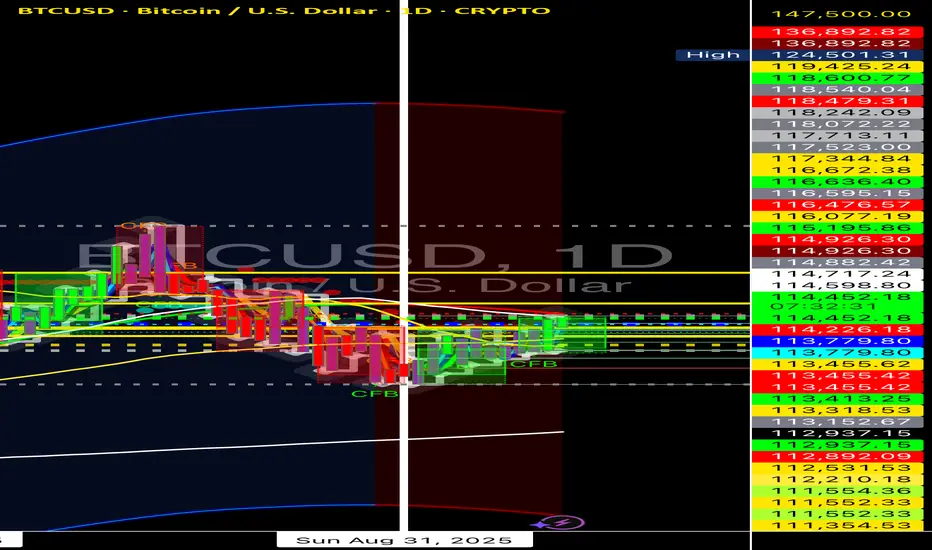
BTCUSD – bullish PO3 in play at macro POCBTC put in a new ATH around $125–126k in October and has since sold off to about $95.6k, a drawdown of roughly 24%.
Historically, Bitcoin bull markets regularly see 20–35% pullbacks on the way to their peaks, so this correction is still inside a “normal” mid-cycle range rather than an outlier.
On the 1D chart we’ve got a clear range distribution at the highs (Wyckoff-style) followed by a sharp move down into a manipulation box around $93–96k. That zone is now loaded with confluence support:
Macro FRVP POC ~96,215 from the previous macro range – the price where the most volume traded, often acting as a strong S/R pivot.
FRVP from the Aug-2024 low shows a major high-volume node in the 92–95k band, reinforcing this area as a fair-value region rather than thin air.
The 2-Day 200 EMA is rising into the same area, adding dynamic trend support from a higher timeframe.
Just above sits the Bull Market Support Band (20-week SMA + 21-week EMA), which has historically been where 30–40% pullbacks found support in prior bull markets before new all-time highs.
PO3 upside thesis
Phase 1 – Range: distribution at 120–125k (yellow box).
Phase 2 – Manipulation: stop-hunt below range into the $93–96k confluence (macro POC + FRVP + 2D 200EMA + BMSB underside).
Phase 3 – Expansion: if price holds above $93k (no 3 daily closes below) and reclaims the BMSB / local down-trend, the setup targets a new expansion leg back into $130–140k+, in line with external bullish scenarios that still frame this as a mid-cycle correction rather than a completed top.
Invalidation / bear path
Breakdown: 3 consecutive daily closes below $93k would signal loss of the current manipulation range.
That opens $85k as the next major demand area; failure there brings the $74–75k HL pivot back into play as a full cycle-risk support and likely further bear market momentum.

AVNT Bullish Reversal / Accumulation Entry on the 2H macro phase.
2H Manipulation phase (0.7258 - 0.4316) is confirmed as {COMPLETE}. Price is now in the high-probability {Accumulation} phase—the institutional setup for a massive directional shift.
ENTRY CONFLUENCE (UNICORN MODEL)
MAIN ENTRY 0.5007
exact boundary of the 30m FVG (0.5007 - 0.4990), strategically placed for optimal mitigation and nested within the 30m Breaker Block for supreme structural support.
SL 0.4866 (Placed below the 30m Breaker Block for absolute invalidation control

SPX500 Short IdeaWe can see on daily timeframe SPX500 has smt with NAS100. And Price both hit Previous Day High. So my idea is price today bearish to 4H FVG previous day range. Still waiting for 4H show the signal if the idea align with market. FX:SPX500

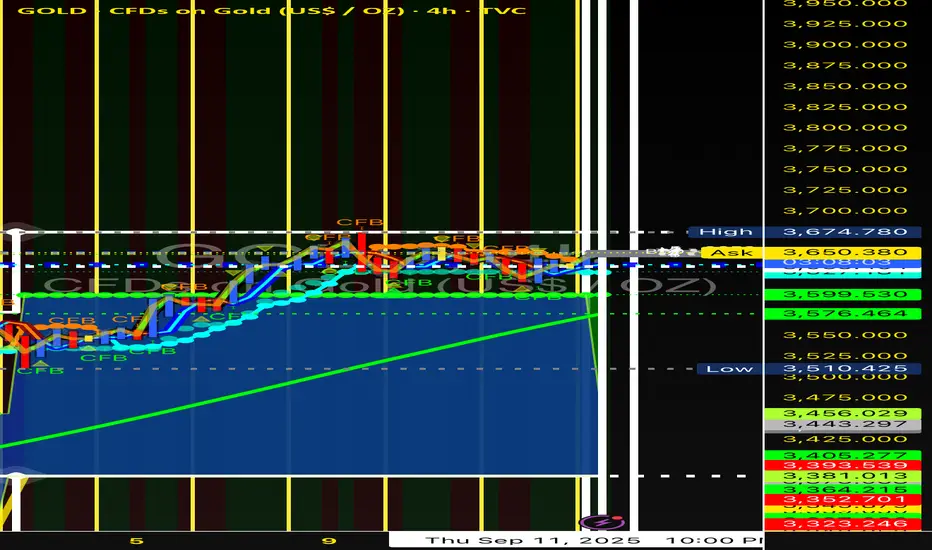
XAUUSD (Gold) – / Watching for Break or rejection Gold on the 2H is showing signs of resistance around 3,680, with price consolidating after a rally. The structure suggests we’re in a PO3 Manipulation phase, where market is gauging strength vs rejection. This could lead to either a breakout above resistance or a clean rejection forcing pullback.
⸻
Possible Trade Setup:
• Entry (Long): Consider entering long if price breaks & closes above 3,680–3,685 with strong candle body and follow through.
• Target Levels (Long):
• 🎯 1st Target – 3,700
• 🎯 2nd Target – 3,720+
• Entry (Short): Look for short if price rejects resistance (3,680–3,685), especially with a bearish candle (wick + failure to close high).
• Target Levels (Short):
• 🎯 1st Target – 3,650–3,640
• 🎯 2nd Target – 3,620
• Invalidation: A sustained close above 3,690 would invalidate the bearish scenario; sustained drop below 3,640 would weaken bullish continuation.
⸻
✅ Best Trade Setup:
The most confi-loaded move right now is the short scenario — resistance is tight, price has already tested it. If you see a bearish rejection candle around 3,680–3,685 (especially on 2H or 45M), that short gives better R:R and cleaner structure.
⸻
CTA:
Please like 👍 and comment 💬 to support my post!
Your engagement motivates me to share more setups and analysis with you.
Best Regards,
KeswanTrades 🕊️
Disclosure: This analysis is for educational purposes only and not financial advice.

Gold (XAUUSD) – Watch for Break or Rejection at Key Resistance Gold is trading around $3,641 per ounce, just shy of its recent highs and pressing resistance zones. Price action suggests we’re in a squeeze between strong resistance up top and support below, waiting for a clean breakout or pullback.
Possible Short / Long Trade Setup:
• Entry (Long): Consider going long if Gold breaks & closes above $3,655-$3,658 with good follow-through and buyer strength.
• Entry (Short): Could consider a short if price rejects that resistance zone ($3,655-$3,658) and shows bearish structure, with confirmation below ~$3,630.
Target Levels:
• 🎯 1st Target Long → $3,670+
• 🎯 1st Target Short → $3,620-$3,616
Invalidation / Risk Zones:
• A sustained close above $3,658 for long trades
• A break below $3,600 would weaken bullish bias and favor more downside
Please hit the like 👍 and comment 💬 to support my post!
Your engagement gets me to drop more setups like this.
Best Regards,
KeswanTrades 🕊️
Disclosure: This is educational only, not financial advice.
XAUUSD 1H - Breakout or Rejection SetupStructure | Trend | Key Reaction Zones
Gold is consolidating between the demand zone (3,620-3,636) and breakout zone (3,645-3,658). Lower highs show bearish pressure, but buyers are holding demand, creating a decision point.
Market Overview
Price action suggests a compression phase. If 3,640-3,645 breaks with bullish momentum, the market can rally strongly. On the other hand, rejection here may send gold back to the demand zone.
Key Scenarios
Bullish Case
(above 3,645-3,658)
Target 1: 3,660
• Target 2: 3,674
•* Target 3: 3,697
X Bearish Case
• Target 1: 3,620
Target 2: 3
3,615
* Target 3: 3,605
Current Levels to Watch
Resistance
: 3,645-3,658 / 3,674
Support
: 3,620 / 3,613
+
Disclaimer: For educational purposes only.
Not financial advice.

BTCUSD – 4H / Daily Testing Resistance, PO3 Setup PossibleBTCUSD is trading around $114,400 (≈ $114,300-114,500) and is showing resistance pressure in both the 4H & Daily timeframes. The price has bounced off lower structure but is now compressing right under a major resistance zone. This is appearing like a PO3 accumulation + possible breakout or rejection zone.
Possible Long Trade Setup:
• Entry: Consider going long if there’s a clean 4H candle close above $115,000, or a retest of support near $113,000-114,000 with strong bullish candle action.
• Target Levels:
• 🎯 1st Target – $118,000
• 🎯 2nd Target – $120,000+
• Invalidation: If price closes decisively below $112,500, bullish scenario is weakened and rejects may lead toward lower liquidity zones.
Please like 👍 & comment 💬 to support my post!
Your engagement pushes me to keep sharing quality setups with depth.
Best Regards,
KeswanTrades 🕊️
Disclosure: This is for educational purposes only—not financial advice.
$GOLD WEEKLY BIAS FOR ME IS BEARISHI have a previous week low target for gold but it hit it early never the less im still bearish and shorted after px hit daily bearish ob. Dropped down to 4hors also hit the 4h bearish OB i shorted on a 15m retest and hopeful not to gget stop out :D . Lets see how this goes.

GOLD SHORT IDEA PO3I am contemplating on this 4h short idea the only weakness i think is the fundamental bias. What is your thought on this idea. Happy to hear your coments.

SHORT SET UP PO3 USDJPYAny thoughts on this set up USDJPPY swing short Po3.
to suplement this is my take for Dollar index

#PENGU #PENGUUSDT #PENGUINS #LONG #AMD #PO3 #Analysis #Eddy#PENGU #PENGUUSDT #PENGUINS #LONG #AMD #PO3 #Setup #Analysis #Eddy
PENGUUSDT.P Scalping Long Setup
This Setup & Analysis is based on a combination of different styles, including the volume style with the ict style. (( AMD SETUP )) "PO3"
Based on your strategy and style, get the necessary confirmations for this scalping setup to enter the trade.
Don't forget risk and capital management.
The entry point are indicated on the chart along with their amounts.
The responsibility for the transaction is yours and I have no responsibility for not observing your risk and capital management.
Note: The price can go much higher than the specified target and have a very good pump.
Be successful and profitable.

GOLD: A Week After Israel Bombs Iranmy view on where gold is going and how i caught the buy on friday after much accumulation

Mastering the ICT Power of 3 concept - How to use it in trading!The financial markets often appear chaotic and unpredictable, but behind the scenes, institutional players operate with clear strategies that shape price action. One such strategy is the ICT (Inner Circle Trader) "Power of 3" model, a framework used to understand and anticipate market cycles through three key phases: accumulation, manipulation, and distribution. This guide will break down each of these phases in detail, explaining how smart money operates and how retail traders can align themselves with the true direction of the market.
What will be discussed?
- The 3 phases
- Examples of the PO3
- How to trade the PO3
- Tips for trading the PO3
The 3 phases
Accumulation
The Accumulation Phase in the ICT "Power of 3" model refers to the initial stage of a market cycle where institutional or "smart money" participants quietly build their positions. During this time, price typically moves sideways within a tight range, often showing little to no clear direction. This is intentional. The market appears quiet or indecisive, which is designed to confuse retail traders and keep them out of alignment with the real intentions of the market's larger players.
In this phase, smart money is not looking to move the market dramatically. Instead, they are focused on accumulating long or short positions without drawing attention. They do this by keeping price contained within a consolidation zone. The idea is to gather enough liquidity, often from unsuspecting retail traders entering early breakout trades or trying to trade the range, before making a more aggressive move.
Manipulation
The Manipulation Phase in the ICT "Power of 3" model is the second stage that follows accumulation. This phase is where smart money deliberately moves the market in the opposite direction of their intended move to trigger retail stop losses, induce emotional decisions, and create liquidity.
After price has consolidated during accumulation, many retail traders are either already positioned or have orders waiting just outside the range, either stop losses from those trading the range or breakout orders from those anticipating a directional move. The manipulation phase exploits this positioning. Price will often break out of the accumulation range in one direction, appearing to confirm a new trend. This move is designed to look convincing, it might even come with a spike in volume or momentum to draw traders in.
However, this breakout is a false move. It doesn’t represent the true intention of smart money. Instead, it's meant to sweep liquidity, triggering stop losses above or below the range, and then reverse sharply. This stop run provides the liquidity needed for large players to finalize their positions at optimal prices. Once enough liquidity is collected, and retail traders are caught offside, the real move begins.
Distribution
The Distribution Phase in the ICT "Power of 3" model is the final stage of the cycle, following accumulation and manipulation. This is where the true intention of smart money is revealed, and the market makes a sustained, directional move, either bullish or bearish. Unlike the earlier phases, distribution is marked by clear price expansion, increased volatility, and decisive momentum.
After smart money has accumulated positions and shaken out retail traders through manipulation, they have the liquidity and positioning needed to drive the market in their desired direction. The distribution phase is where these positions are "distributed" into the broader market, meaning, institutions begin to offload their positions into the retail flow that is now chasing the move. Retail traders, seeing the strong trend, often jump in late, providing the liquidity for smart money to exit profitably.
This phase is typically what retail traders perceive as the real trend, and in a sense, it is. However, by the time the trend is obvious, smart money has already entered during accumulation and profited from the manipulation. What appears to be a breakout or trend continuation to most retail participants is actually the final leg of the smart money’s strategy. They are now unloading their positions while price continues to expand.
Examples of the Power of 3
How to trade the PO3?
Start by identifying a clear accumulation range. This typically happens during the Asian session or the early part of the London session. Price moves sideways, forming a consolidation zone. Your job here isn’t to trade, but to observe. Draw horizontal lines marking the high and low of the range. These become your key liquidity zones.
Next, anticipate the manipulation phase, which usually occurs during the London session or at the NY open. Price will often break out of the range, triggering stop losses above the high or below the low of the accumulation zone. This move is deceptive, it is not the real trend. Do not chase it. Instead, wait for signs of rejection, such as a sharp reversal after the liquidity grab, imbalance filling, or a shift in market structure on a lower timeframe (like a 1- or 5-minute chart).
Once manipulation has swept liquidity and price starts showing signs of reversing back inside the range or beyond, you now look for a confirmation of the true move, this begins the distribution phase. You enter in the direction opposite of the manipulation move, ideally once price breaks a structure level confirming that smart money has taken control.
For example, if price consolidates overnight, fakes a move to the downside (running sell stops), and then quickly reverses and breaks above a key swing high, that's your signal that the true move is likely up. Enter after the break and retest of structure, using a tight stop loss below the recent low. Your target should be based on liquidity pools, fair value gaps, or higher-timeframe imbalances.
The key to trading the Power of 3 is patience and precision. You're not trying to catch every move, but to wait for the market to complete its cycle of deception and then ride the clean expansion. Ideally, your entry comes just after manipulation, and you hold through the distribution/expansion phase, taking partials at key liquidity levels along the way.
Tips for trading the PO3
1. Learn price movements
Before you can effectively apply the ICT Power of 3 strategy, it’s crucial to have a deep understanding of how price behaves. This means being comfortable identifying market structure, recognizing trend direction, and interpreting candlestick dynamics. Since the Power of 3 is deeply rooted in how price moves in real time, a strong grasp of these basics will give you the confidence to read the market correctly as each phase develops.
2. Analyse multiple timeframes
Although the Power of 3 pattern shows up on lower timeframes, relying on just one can lead to misreads. You’ll gain a clearer picture when you align the short-term view with higher timeframe structure. For example, what appears to be accumulation on the 15-minute chart may simply be a retracement in a larger trend on the 1-hour or daily. By examining multiple timeframes together, you can better identify the true setup and avoid being tricked by noise.
3. Exercise patience
A key part of trading the Power of 3 is knowing when to act, and more importantly, when not to. It’s easy to get impatient during the accumulation or manipulation phases, but entering too early often leads to frustration or losses. True discipline comes from waiting for the expansion or distribution phase, when the market reveals its real direction. This is where the most favorable risk-to-reward setups occur.
Thanks for your support.
- Make sure to follow me so you don't miss out on the next analysis!
- Drop a like and leave a comment!

possible buyhigher time frame bullish, sitting at strong support and demand we can see a possible retest of highs, after either a London sell side liquidity sweep or both London and Asian low sweep waiting for this to take place in our entry zone new york

Quarterly Theory "QT"
Introduction to Quarterly Theory (QT)
Time must be divided into quarters for a proper interpretation of market cycles.
Combining QT (Quarterly Theory) concepts with basic ICT concepts leads to greater accuracy.
Understanding QT allows you to be flexible. It adapts to any trading style as it is universal across all time frames.
QT eliminates ambiguity by providing specific time-based reference points to look for when entering trades
.
THE CYCLE
Annual Cycle - 3 quarters each
Monthly Cycle - 1 week each
Weekly Cycle - 1 day each*
Daily Cycle - 6 hours each
Session Cycle - 90 minutes each
*Monday to Thursday, Friday has its own specific function .
Annual Cycle:
Q1 JANUARY - MARCH
Q2 APRIL - JUNE
Q3 JULY - SEPTEMBER
Q4 OCT - DECEMBER
Monthly Cycle**:
Q1 FIRST WEEK
Q2 SECOND WEEK
Q3 THIRD WEEK
Q4 FOURTH WEEK
Weekly Cycle*:
Q1 MONDAY
Q2 TUESDAY
Q3 WEDNESDAY
Q4 THURSDAY
Daily Cycle:
Q1 ASIA
Q2 LONDON
Q3 NEW YORK
Q4 AFTERNOON
**Monthly Cycle starts with the first full week of the month.
*Friday has its own cycle, which is why it is not listed.
Q1 indicates the quarters that follow.
If Q1 expands, Q2 is likely to consolidate.
If Q1 consolidates, Q2 is likely to expand.
TRUE OPENS
True price opens are the beginning of Q2 in each cycle. It validates key levels.
What are the true opens?
Yearly: First Monday of April (Q2)
Monthly: Second Monday of the month (Q2)
Weekly: Second daily candle of the week
Daily: Start of the London session (6 hours after the open of the daily candle)
Asia - London - NY - Evening: 90 minutes after the open of the 6-hour candle.
DIAGRAM:
Q1 (A) Accumulation - Consolidation.
Q2 (M) Manipulation - Judas Swing (Trade this).
Q3 (D) Distribution (Trade this).
Q4 (X) Continuation - Reversal of the previous quarter.
Q1 (X) Continuation - Reversal of the previous quarter.
Q2 (A) Accumulation - Consolidation.
Q3 (M) Manipulation - Judas Swing (Trade this).
Q4 (D) Distribution (Trade this).
ANNUAL CYCLE:
MONTHLY CYCLE:
WEEKLY CYCLE:
DAILY CYCLE:

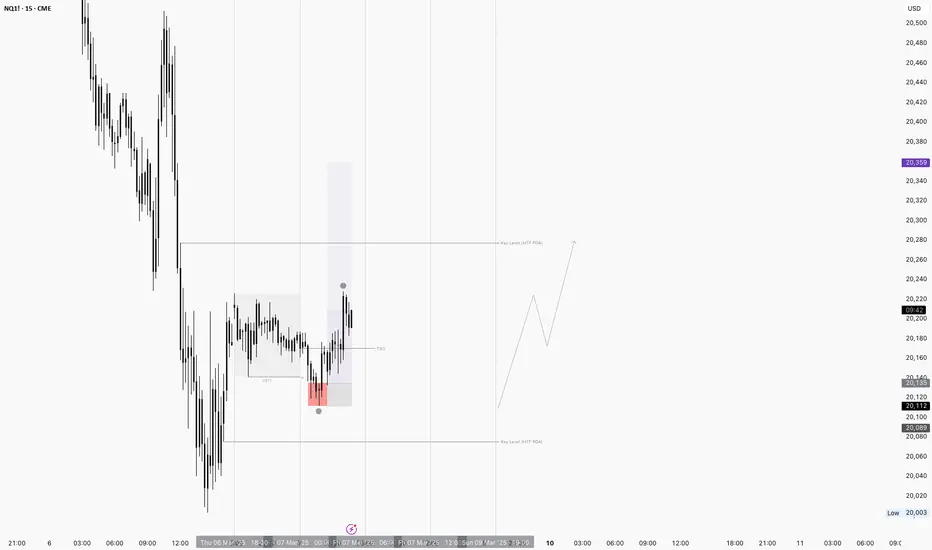
NQ! Long IdeaFollowing Chart presents my current long Idea on NQ following MXMM Quarterly Theory and PO3.
What Is ICT PO3, and How Do Traders Use It?What Is ICT PO3, and How Do Traders Use It?
The ICT Power of 3 is a strategic trading method that helps traders identify behaviour of ‘smart money.’ It dissects market movements into three distinct phases: accumulation, manipulation, and distribution. This article explores the intricacies of the Power of 3 strategy and its practical application in trading.
Understanding the ICT PO3 Trading Concept
The ICT Power of 3 (PO3), or the AMD setup, is a strategic trading framework developed by Michael J. Huddleston, better known as the Inner Circle Trader. This approach revolves around three critical phases: accumulation, manipulation, and distribution, which collectively help traders understand and anticipate market movements.
Accumulation Phase
During this phase, smart money or institutional investors accumulate positions within a price range, often leading to a period of low volatility and sideways movement. This stage sets the groundwork for future price movements by creating a base of support or resistance.
Manipulation Phase
The manipulation phase involves deliberate price moves by smart money to trigger stop losses and deceive retail traders. In a bullish scenario, prices may dip below the established range, while in a bearish market, prices might spike above the range. This phase is seen as being characterised by sharp, misleading price movements aimed at manipulating liquidity.
Distribution Phase
Following manipulation, the distribution phase sees smart money offloading their positions, leading to significant price movements in the intended direction. For bullish trends, this involves a strong upward move, whereas, in bearish conditions, it results in a sharp decline. This phase marks the realisation of the strategic positions built during the accumulation phase.
Understanding this ICT concept allows traders to align their strategies with the actions of institutional investors, potentially enhancing their ability to make informed trading decisions. The ICT PO3 strategy is versatile, applicable across different timeframes and financial instruments, making it a valuable tool for traders in various markets.
Below, we’ll discuss each of these three phases in more detail.
Accumulation Phase
The accumulation phase is a crucial initial stage within the Power of 3 trading strategy. It represents a period where institutional investors, often referred to as smart money, quietly build their positions in a particular asset. This phase is characterised by relatively low volatility and sideways price movement, typically near key support or resistance levels.
During accumulation, the market tends to range within a narrow band as large players gradually buy into the asset without significantly driving up its price. This steady acquisition reflects their confidence in the asset's future appreciation. Recognising the accumulation phase involves monitoring for signs such as low-volatile, ranging price action and potential increases in trading volume without major price changes.
Indicators of the accumulation phase include:
- Low Volatility: The asset trades within a tight range, showing little directional bias.
- Support Levels: Accumulation often occurs near historical support or resistance levels where the price is deemed under or overvalued by institutional investors.
- Increased Volume: There may be a gradual rise in volume as smart money accumulates positions, signalling their interest without causing sharp price movements.
Specifically, this range is also intended to trap retail traders on both sides of the market. In a bullish accumulation, for example, where the price will eventually break upwards, the range will trap bullish traders buying from the support level inside of the range. Given that these traders will most likely set their stop losses below the range, this paves the way for the next stage: manipulation of liquidity.
However, some traders will also take a short position in this range, anticipating that price will continue to break lower. These traders add fuel to the distribution leg discussed later.
The Manipulation Phase
The manipulation phase is a pivotal part of the ICT PO3 trading strategy. This stage is marked by deliberate actions from institutional investors to create market conditions that mislead and trap retail traders. It follows the accumulation phase, where positions are built, and precedes the distribution phase, where these positions are realised.
Characteristics of the Manipulation Phase:
- Deceptive Price Movements: During this phase, the price moves sharply in a direction opposite to the expected trend. In a bullish setup, prices might dip below the established range, while in a bearish setup, they might spike above the range. These moves are designed to trigger stop-loss orders, encourage breakout traders to enter positions and ultimately generate liquidity for the smart money’s large orders.
- Triggering Retail Traps: The primary goal is to shake out early traders by hitting their stop-loss levels. For instance, a sudden dip in a bullish market might make retail traders believe that the market is turning bearish, prompting them to close their positions.
- Creating Liquidity: By inducing these price movements, smart money creates liquidity that allows them to add to their positions at more favourable prices. This phase is crucial for building the necessary conditions for the subsequent distribution phase.
Recognising Manipulation:
- False Breakouts: Characterised by sharp, sudden moves that quickly reverse. These are often designed to lure traders into thinking a breakout has occurred.
- Price Action Signals: Price action that doesn’t align with the overall market structure or sentiment can be a sign of manipulation. This can be especially true after a long uptrend or downtrend, signalling potential exhaustion.
For example, in a bullish market, after a period of accumulation where prices have stabilised within a range, a sudden drop might occur. This drop triggers stop-loss orders and panics retail traders into selling. It also encourages some to trade what appears to be a bearish breakout. Smart money then buys these positions at lower prices, preparing for the distribution phase where they push the prices up sharply.
The Distribution Phase
The distribution phase is the final stage in the Power of 3 trading strategy, where smart money begins to offload their positions built during the accumulation phase. This phase follows the manipulation phase, and it is characterised by strong price movements in the direction opposite to the manipulation.
Key Characteristics of the Distribution Phase:
- Significant Price Movement: This phase involves substantial price changes as institutional investors begin to realise their positions. In a bullish scenario, this means a sharp upward movement; in a bearish scenario, a sharp decline.
- High Volume: The distribution phase is often accompanied by high trading volume, indicating that a large number of positions are being sold or bought back.
- Market Confirmation: During this phase, the true market trend that was obscured during the manipulation phase becomes evident. The price moves in the direction of the original accumulation, confirming the intent of the smart money.
- Retail Trader Participation: Many traders have been shaken out of their positions, including those who were wrong about the initial breakout’s direction and those who were correct but had their stop loss triggered by the manipulation phase. They now pile back into the trade, fueling this strong upward or downward leg.
Recognising the Distribution Phase:
- Price Action: Traders look for strong, sustained movements in price, often with large candles. For a bullish trend, this means a consistent upward movement; for a bearish trend, a consistent downward movement.
- Volume Analysis: Increased trading volume during these price movements indicates distribution.
- Breaking Market Structure: The high or low of the accumulation/manipulation phase will be traded through.
- Technical Indicators: Use of tools like moving averages and support/resistance levels can help confirm the transition into the distribution phase.
For example, in a bullish market, smart money begins to buy aggressively after the price has been manipulated downwards to create liquidity. This buying pressure pushes the price up sharply, signalling the start of the distribution phase. Traders can look for increased volume and price action breaking above previous resistance levels as confirmation.
Practical Application of ICT PO3
The ICT PO3 strategy can be effectively applied by traders through a structured approach involving higher timeframe analysis and keen observation of price movements. Here's how traders typically utilise this strategy:
Setting the Daily Bias
Traders often start by establishing their market bias for the day. This involves analysing higher timeframes to determine the overall market trend. Understanding whether the market is bullish or bearish sets the foundation for the day’s trading strategy.
Marking the Day's Open
After setting the bias, traders mark the opening price of the day. This price point is critical as it serves as a reference for potential manipulation and trading opportunities.
Identifying Manipulation
Traders look for price movements beyond the day's open and the established range boundaries. For a long bias, they observe for manipulation below the open, while for a short bias, they look above the open. This stage is crucial as it indicates where smart money is likely manipulating the market to create liquidity.
Entry Signals
While a trader can simply enter once price trades beyond the day’s open, many choose to confirm the trade. Using a 5-15 minute chart, they might look for signals such as:
- Price moving into a significant area of liquidity beyond a key swing high or low.
- A break of established market structure, such as price beginning to move above previous swing highs in a bullish setup (known as a change of character, or ChoCh).
- Chart patterns or candlestick patterns that indicate a reversal or continuation, such as a hammer/shooting star, wedge, quasimodo, etc.
- A moving average crossover that supports the expected price direction.
- Momentum indicators showing waning momentum in the manipulated direction.
Traders typically place stop losses beyond the manipulation high or low to potentially manage risk here.
Distribution Phase Opportunities
If an entry is missed during the manipulation phase, traders can look for opportunities during the distribution phase. Although this phase may offer a less favourable risk-to-reward ratio, it still provides potential trading opportunities. Traders might wait for a market structure break or ChoCh, followed by a pullback, setting stop losses either beyond a recent swing high/low or beyond the manipulation high or low.
ICT Power of 3 Example
On the GBPUSD 15m chart above, the day open acts as a support level, marking the accumulation phase. A candle wicks below the range, followed by a price break above the range, which then sharply reverses, indicating the manipulation phase. After taking liquidity, price rebounds sharply.
On the 5m chart, a break above the downtrend structure creates a change of character (ChoCh) before price pulls back and breaks above the manipulation high, signalling a bullish market shift. Subsequent pullbacks might be excellent entry points for traders who missed the manipulation phase entries before price marks up further.
The Bottom Line
Understanding and applying the ICT Power of 3 strategy can enhance a trader's ability to navigate market movements. By recognising the phases of accumulation, manipulation, and distribution, traders can better align their actions with institutional behaviours. To implement this strategy and optimise your trading experience, consider opening an FXOpen account for advanced trading tools and support of a broker you can trust.
FAQ
What Is PO3 in Trading?
The ICT Power of 3 (PO3) is a trading strategy developed by Michael J. Huddleston, known as the Inner Circle Trader. It involves three key phases: accumulation, manipulation, and distribution. These phases help traders understand market movements by aligning their strategies with institutional investors.
What Is the Power of 3 ICT Entry?
The Power of 3 ICT entry involves identifying optimal points to enter trades during the phases of accumulation, manipulation, and distribution. Traders typically look for signs of price manipulation, such as false breakouts, and then enter trades in the direction of the anticipated distribution phase.
How Does the Power of 3 Work?
The ICT Power of 3 can be an indicator of potential smart money involvement. It works by breaking down market movements into three phases:
1. Accumulation: Smart money builds positions.
2. Manipulation: Price moves are designed to deceive retail traders.
3. Distribution: Smart money offloads positions, leading to significant price movements in the intended direction.
How to Trade the Power of Three?
To begin Power of Three trading, traders first set their daily bias using higher timeframe analysis. They then mark the daily open and observe for price manipulation. Entry signals include breaks of market structure, liquidity grabs, and candlestick patterns. Traders set stop losses beyond manipulation highs or lows and can also look for entries during pullbacks in the distribution phase.
Trade on TradingView with FXOpen. Consider opening an account and access over 700 markets with tight spreads from 0.0 pips and low commissions from $1.50 per lot.
This article represents the opinion of the Companies operating under the FXOpen brand only. It is not to be construed as an offer, solicitation, or recommendation with respect to products and services provided by the Companies operating under the FXOpen brand, nor is it to be considered financial advice.

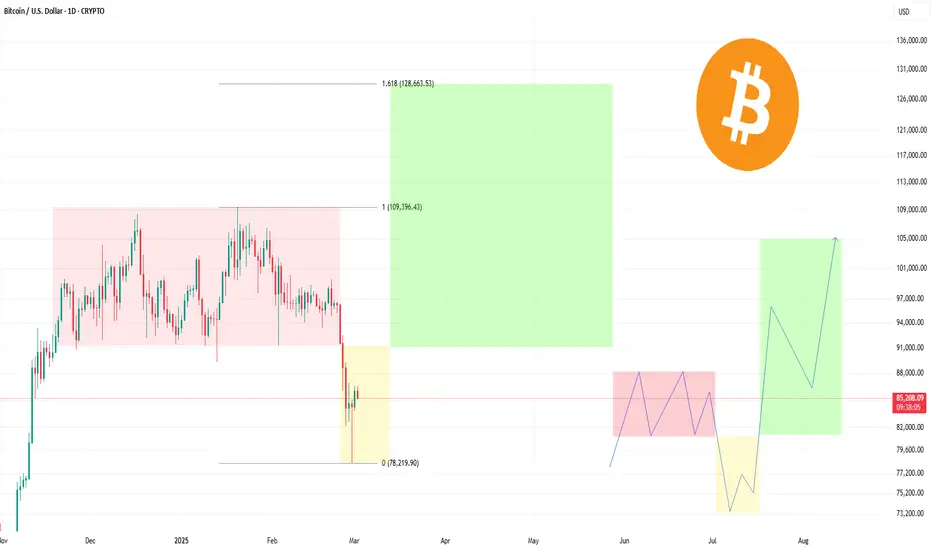
PO3 and Fibonacci: The Path to $128,000I've always been an advocate of analyzing data deeply and finding patterns where others see chaos. And today I want to share my perspective on one of the most exciting opportunities that are taking shape right now.
PO3 is not just an indicator, but a real key to understanding how the market shapes its moves. When you combine it with Fibonacci levels, a unique picture opens up in front of you that gives you a glimpse into the future. This is exactly the case when the data speaks for itself. Now, analyzing the current dynamics, I come to the conclusion that we can expect a significant rise in price to the level of 128,000 dollars. PO3 shows a clear direction and Fibonacci levels confirm the potential for such a move.
So, my prediction: $128,000 is not the limit of dreams, but a realistic goal that we can achieve. And those who understand this trend have a unique advantage.
Alex Kostenich,
Horban Brothers.
NQ Short Idea (MXMM | Quarterly Theory)Hello guys, I hope everyone is having a profitable day.
I present to you my todays short idea. I want the London highs to be swept and price to manipulate into my Key Level. I will enter short once this happens and we have ChoCh + retrace into any PD Array (OB, FVG,...)
Praise be to God.
-T-

ADAUSDT Market Maker Buy ModelMarket maker buy model framework 12h. We'll see what happens tomorrow with the NFP volatility injection.

NIFTY (PO3) A++ Bearish Setup Power of 3 Strategy (PO3) also know as AMD Strategy
This strategy has three primary phases
1. Accumulation
2. Manipulation
3. Distribution (Range Expansion)
Key elements
1. HTF PD Array
2. Daily Open
3. Fibonacci Price Projection Tool
4. Standard Deviation ( -2 to -2.5 )
Process
1. Accumulation is where big players accumulate large quantity of shares forming a range bound price consolidation.
2. Manipulation is where big players move price against their intended direction towards nearby HTF PD Array with a standard Deviation of -2 to -2.5 to sweep the liquidity to for order pairing.
3. Distribution is the real momentum where retail traders enter along with big players and ride the trend with range expansion.
