Forget the Textbook: A 30-Year Reality CheckA Big Policy Moment
A central bank (BOJ) just pushed interest rates to levels not seen in 30 years.
That’s not a routine tweak — that’s a regime shift.
Textbooks might suggest a clean, logical market response.
Reality? Markets got emotional. Fast.
Selling Got Loud
Instead of an orderly adjustment, selling pressure exploded.
Not just “price going down,” but effort going through the roof.
That’s where Volume Delta comes in — the net difference between buying and selling volume. It tells us who is pressing the gas pedal.
And in this case, sellers floored it.
When an Indicator Starts Yelling
Now here’s the interesting part.
Bollinger Bands weren’t applied to price…
They were applied to Volume Delta itself.
Result?
Volume Delta plunged far below its lower Bollinger Band.
That’s not normal selling.
That’s everyone trying to get out at the same time.
Does that mean price must reverse?
Nope. But it does suggest selling is becoming inefficient.
No Safety Net Below
Here’s the catch.
There are no meaningful UFO supports (UnFilled Orders) below current price.
No obvious institutional “safety net.”
Instead, only two old technical floors remain:
0.0063330
0.0062415
Think of them as floors, not trampolines. Price may react… or punch straight through.
Reaction Beats Guessing
This is where patience matters.
Extreme selling doesn’t mean “buy now.”
It means watch closely.
At those levels, traders are looking for:
Selling pressure slowing down
Price stabilizing
Daily closes showing acceptance or rejection
No assumptions. Only reactions.
Don’t Forget the Ceiling
Even if price bounces, there’s a ceiling waiting above.
A clear sell-side UFO resistance sits near 0.0065640.
That’s leftover supply — the kind that often stops rallies in their tracks.
So any upside move?
Treat it as corrective until structure says otherwise.
Contract Specs
This analysis uses both standard and micro futures to illustrate scalable risk. Japanese Yen Futures (6J) have a tick size of 0.0000005 with a $6.25 tick value and currently require roughly ~$2,800 in margin per contract, while Micro JPY/USD Futures (MJY) use a 0.000001 tick size with a $1.25 tick value and margin closer to ~$280. Margin requirements vary by market conditions and broker policies, and micro contracts can be especially useful when volatility expands following major macro events.
The Big Takeaway
Historic policy decisions don’t end stories — they start messy chapters.
Extreme Volume Delta shows stress, not certainty.
Structure decides what comes next.
When markets digest big shocks, the edge doesn’t come from predicting —
It comes from staying disciplined while everyone else reacts.
Want More Depth?
If you’d like to go deeper into the building blocks of trading, check out our From Mystery to Mastery trilogy, three cornerstone articles that complement this one:
🔗 From Mystery to Mastery: Trading Essentials
🔗 From Mystery to Mastery: Futures Explained
🔗 From Mystery to Mastery: Options Explained
When charting futures, the data provided could be delayed. Traders working with the ticker symbols discussed in this idea may prefer to use CME Group real-time data plan on TradingView: www.tradingview.com - This consideration is particularly important for shorter-term traders, whereas it may be less critical for those focused on longer-term trading strategies.
General Disclaimer:
The trade ideas presented herein are solely for illustrative purposes forming a part of a case study intended to demonstrate key principles in risk management within the context of the specific market scenarios discussed. These ideas are not to be interpreted as investment recommendations or financial advice. They do not endorse or promote any specific trading strategies, financial products, or services. The information provided is based on data believed to be reliable; however, its accuracy or completeness cannot be guaranteed. Trading in financial markets involves risks, including the potential loss of principal. Each individual should conduct their own research and consult with professional financial advisors before making any investment decisions. The author or publisher of this content bears no responsibility for any actions taken based on the information provided or for any resultant financial or other losses.
Policy

Bearish divergence, bigger number not always better for housingFull disclosure I got Ai to compose this because I'm dyslexic and a scatter brain.
and this is a duplicate because I tried to delete it once I found out it scaled bad on mobile, and trading views delete function MIA! ( within the cool down ) go figure.
I definitely have a bias to btc and maybe a long position on the JPY. Have a read have a look.
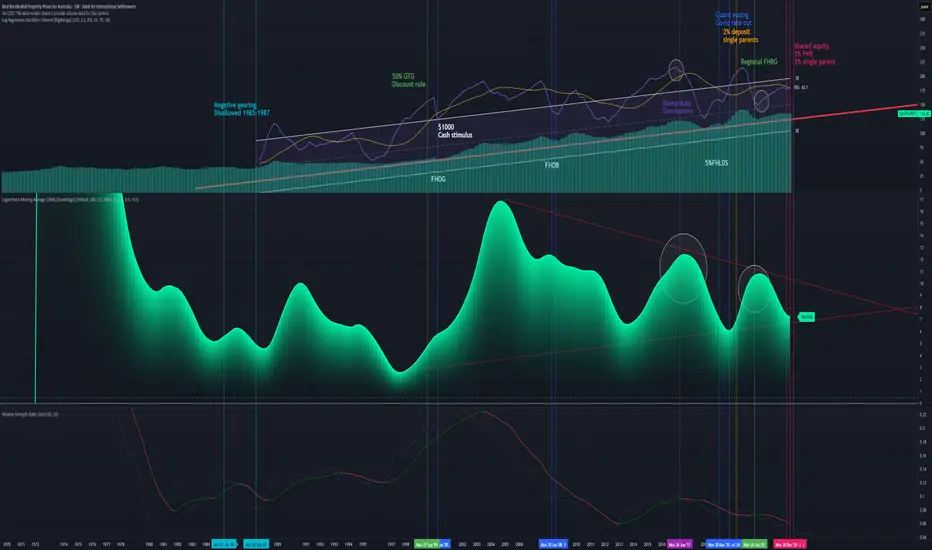
I have loosely marked some economic data on here showing Policy might not be working well enough because wages didn't keep up with CPI causing a real value losses after 2022.
I have supplied the ratio chart for gold as a indicator at the top.
Structural Policy Drivers (The Cause of the Bull Trend)
These points explain why the long-term trend line (the logarithmic regression) slopes upward:
1. The Foundation of Investment (1999): The introduction of the 50% Capital Gains Tax (CGT) Discount in September 1999 was the single most powerful structural stimulus. It transformed property investment (combined with Negative Gearing) into the primary wealth-creation strategy, ensuring sustained investor demand.
2. GFC Policy Proof (2008-2009): The market's low point during the GFC was immediately arrested by the First Home Owners Boost (FHOB) and broad cash payments (October 2008). This showed that the government would deploy massive, rapid stimulus to prevent a structural price fall, reinforcing investor confidence.
3. The Liquidity Flood (March 2020): The RBA's emergency COVID Rate Cuts and Quantitative Easing (QE) injected unprecedented liquidity, creating the conditions for the most recent Nominal Higher High.
II. The Bearish Divergence Signal (The Warning)
These points explain why the recent peak is weak and unsustainable:
4. Technical Exhaustion: The Bearish Divergence observed between the Nominal HPI Price (making a \text{Higher High} in 2022) and the RSI/Momentum (making a \text{Lower High}) signals that the momentum required to sustain the uptrend is exhausted.
5. The Illusion of Value: The Nominal Higher High is highly misleading. When adjusted:
Purchasing Value: The Price-to-Income Ratio reached a \text{record high} (\sim 8.0 times income), meaning the price peak was actually a Lower Low in affordability.
Real Value: When measured in Ounces of Gold, the HPI peaked at a massive Lower Low (\sim 206 ounces in 2024 vs. \sim 874 ounces in 2004), demonstrating the fragility of AUD-denominated property wealth.
III. The Policy Constraint (The System Strain)
These points explain the high risk and fragility of the current market:
6. Diminishing Returns: The market required the extreme, combined stimulus of near-zero rates (RBA) and low-deposit guarantees (5% FHB schemes}) to reach its 2022 peak. The Bearish Divergence confirms this level of effort produced a historically weak momentum result, indicating policy inefficiency.
7. The Investor Exit Trigger: The current high interest rates and the {Lower Low in Purchasing Value} are highly likely to encourage a rotation of capital. A sell-off of just 5\% of investment equity (\approx \$104 Billion) could overwhelm {FHB} demand and force a Nominal Price Correction a {Lower Low}) by late 2026 / mid-2027.
8. The "Double Whammy" Risk: Recent low-deposit buyers face extreme risk: their equity is thin (vulnerable to price drops) while their debt servicing remains stretched, as large wage increases are structurally unlikely (due to the RBA's mandate to curb inflation).
🛑 INVESTMENT PROPERTY HEDGE: The Exit Strategy
This strategy is for owners of non-owner-occupied property facing the convergence of the {AU} Housing {Bearish Divergence} and the Global {JPY} Unwind.
✅ Core Hedges: Replacing Inefficient Investment Equity
The goal is to move capital from a low-momentum, illiquid, highly-taxed, AUD-denominated asset (investment property) into a high-liquidity, real-value store.
1. Physical Gold & Silver (The Devaluation Defense):
WHY: Gold is the essential hedge against the currency risk. Our analysis shows that your property's value has collapsed when measured in Gold {Lower Low} on the {House Price-to-Gold Ratio}). Converting illiquid property equity into physical metals protects wealth from the {AUD} devaluation caused by both domestic policy strain and global policy shocks.
Investment Action: This should be prioritized for preserving the real wealth that may be lost if Nominal {QAUR628BIS} corrects.
2. Defensive Japanese Yen {JPY}) Exposure:
WHY: This is the most direct hedge against the global liquidity shock. The {JPY} is the "funding currency" for the global risk trade. When the carry trade unwinds, investors must buy {JPY} to repay their debt, causing a sharp appreciation. This {JPY} strength would directly offset losses incurred by the domestic housing slowdown.
Investment Action: Provides protection against the {2026-2027} global market crash that the {JPY} unwind is predicted to trigger.
3. Bitcoin (The Non-Sovereign Liquidity Drain):
WHY: Bitcoin provides the fastest, most tax-efficient (long-term {CGT} relief applies) exit route for capital leaving a strained domestic financial system. It is the perfect liquid asset to absorb the {\$104B} of equity that a 5\% investor sell-off would create.
Investment Action: A strategic allocation here hedges against both {AUD} devaluation and the systemic policy risks you've identified.
❌ Liabilities to AVOID: The System's Vulnerabilities
1. Australian Bank Stocks {CBA, Westpac, etc.}):
WHY NOT: Their fate is tied to your property's mortgage risk. The {Bearish Divergence} on the (QAUR628BIS) directly increases their credit risk. The {JPY} unwind will also hurt them by disrupting global financial stability and reducing lending capacity. They are a concentrated liability.
2. Leveraged US Stock Indices {S\&P 500/Nasdaq}):
WHY NOT: The {US} market is a primary target of the {JPY} carry trade unwind. Leveraged investors will be forced to sell these high-performing assets to close their debt positions, leading to a non-fundamental, sharp correction. The risk of sudden {JPY}-driven liquidation is too high.
Thanks for reading I made this for my Father who recently had to ( forced hand) purchase another home (above what he lived for "reasons") convinced cash and the property are safe and cannot afford to lose more money.
Leave a comment for him.
Or add to the conversation share your own views.
U.S. Federal Reserve Policy and Interest RatesThe Backbone of Global Economic Stability.
Introduction
The United States Federal Reserve (commonly known as the Fed) stands as one of the most influential institutions in the global financial system. Its policies, particularly regarding interest rates, have far-reaching consequences — not only for the U.S. economy but also for financial markets, currencies, trade flows, and economic stability across the world. The Fed’s ability to adjust interest rates and implement monetary policies allows it to control inflation, influence employment levels, and stabilize economic growth.
In this essay, we will explore in detail the evolution, mechanisms, tools, and impacts of the Federal Reserve’s policy decisions, with a special focus on interest rates — their role, rationale, and implications for both domestic and international economies.
1. The Role and Structure of the U.S. Federal Reserve
The Federal Reserve System was established in 1913 through the Federal Reserve Act, in response to recurring financial panics and instability in the U.S. banking system. Its primary mission is to promote a stable monetary and financial environment.
The Fed operates through three key entities:
The Board of Governors – Located in Washington, D.C., consisting of seven members appointed by the President and confirmed by the Senate.
Twelve Regional Federal Reserve Banks – These regional banks represent different districts and carry out the Fed’s policies locally.
The Federal Open Market Committee (FOMC) – Comprising the Board of Governors and five Reserve Bank presidents, this committee is the primary decision-making body for setting interest rates and implementing monetary policy.
The Fed’s dual mandate is to achieve:
Maximum employment, and
Stable prices (low and predictable inflation).
In addition, the Fed seeks to moderate long-term interest rates and maintain the stability of the financial system.
2. The Tools of Federal Reserve Monetary Policy
To achieve its goals, the Federal Reserve uses several key tools:
a. Open Market Operations (OMO)
This is the primary tool for controlling short-term interest rates. The Fed buys or sells government securities (like U.S. Treasury bonds) in the open market.
Buying securities increases money supply, lowers interest rates, and stimulates economic activity.
Selling securities decreases money supply, raises interest rates, and curbs inflationary pressure.
b. The Discount Rate
This is the interest rate the Fed charges commercial banks for short-term loans through its discount window. Lowering this rate encourages banks to borrow more and lend to businesses and consumers, while increasing it discourages lending and cools the economy.
c. Reserve Requirements
This refers to the percentage of deposits that banks must hold as reserves. Lowering reserve requirements increases available funds for lending, boosting liquidity and credit growth. Raising them does the opposite, restricting credit.
d. Interest on Reserve Balances (IORB)
The Fed pays interest on reserves that banks hold at the central bank. Adjusting this rate influences how much banks lend versus how much they keep in reserves, indirectly impacting money supply.
e. Quantitative Easing (QE) and Tightening (QT)
In extraordinary circumstances, such as the 2008 financial crisis or the 2020 pandemic, the Fed uses QE to purchase long-term securities, injecting liquidity into the economy. Conversely, Quantitative Tightening (QT) involves selling assets or allowing them to mature to reduce liquidity and combat inflation.
3. Interest Rate Policy: The Core of Monetary Control
Interest rates lie at the heart of the Federal Reserve’s monetary policy. The Federal Funds Rate — the rate at which banks lend reserves to each other overnight — is the most critical benchmark.
When the Fed changes the target range for this rate, it indirectly affects:
Consumer borrowing costs (credit cards, mortgages, auto loans),
Business investment decisions,
Government borrowing costs, and
The valuation of financial assets globally.
a. When the Fed Raises Interest Rates
Inflation Control: Higher rates make borrowing more expensive, slowing spending and investment, thereby cooling inflation.
Currency Appreciation: The U.S. dollar strengthens as higher rates attract foreign investors seeking better returns.
Stock Market Impact: Equity prices often fall due to higher discount rates and reduced profit expectations.
Global Ripples: Emerging markets may face capital outflows as investors shift to U.S. assets.
b. When the Fed Lowers Interest Rates
Stimulating Growth: Cheaper credit encourages consumption, business expansion, and investment.
Weakening of Dollar: A lower yield reduces demand for the U.S. dollar, making exports more competitive.
Boost to Financial Markets: Lower discount rates increase asset valuations, benefiting equity and bond markets.
Support During Crises: Rate cuts are often used during recessions to stimulate economic recovery.
4. Historical Perspective: Major Fed Rate Cycles
a. The Volcker Era (Late 1970s–1980s)
Inflation had surged due to oil shocks and loose monetary policy. Chairman Paul Volcker implemented drastic rate hikes, pushing the federal funds rate above 20% in 1981. This aggressive stance broke the back of inflation but triggered a short-term recession.
b. The Greenspan Era (1987–2006)
Under Alan Greenspan, the Fed emphasized gradualism and market-friendly communication. It managed crises like the 1987 stock market crash, the dot-com bubble, and early 2000s recessions through strategic rate adjustments.
c. The Bernanke and Yellen Years (2006–2018)
The 2008 Global Financial Crisis marked a shift to unconventional tools. The Fed slashed rates to near zero and launched Quantitative Easing to revive the economy. Later, under Janet Yellen, gradual normalization began.
d. The Powell Era (2018–Present)
Jerome Powell has faced extraordinary challenges: trade tensions, the COVID-19 pandemic, and post-pandemic inflation. After slashing rates to zero in 2020, the Fed initiated its most aggressive tightening cycle in decades starting in 2022 to combat inflation exceeding 9%, raising rates to over 5% by 2023.
5. Impact of Fed Interest Rate Decisions on the U.S. Economy
a. Inflation Control
Rising rates slow consumer and corporate spending, helping control inflation by cooling demand. Conversely, rate cuts stimulate demand and can raise inflation expectations.
b. Employment and Wages
As borrowing costs rise, companies may delay hiring or expansion. High rates can increase unemployment in the short run, but the Fed’s goal is to maintain long-term price stability, which supports sustainable employment.
c. Housing Market
Mortgage rates move closely with the Fed’s actions. A rate hike can significantly slow housing demand, reduce affordability, and depress home prices.
d. Business Investment
When borrowing becomes costly, companies cut capital expenditure. Sectors such as manufacturing, technology, and real estate often feel the strongest impact.
e. Consumer Behavior
Interest rate changes directly affect credit cards, auto loans, and savings yields, influencing household spending patterns and savings rates.
6. Global Implications of U.S. Interest Rate Policy
The Federal Reserve’s decisions ripple through the global economy because the U.S. dollar is the world’s dominant reserve currency.
a. Capital Flows
When U.S. rates rise, capital often flows from emerging markets to the U.S. in search of higher returns. This can weaken developing economies’ currencies and strain their debt servicing.
b. Exchange Rate Volatility
Higher U.S. yields strengthen the dollar, making imports cheaper but hurting exports. For other countries, a strong dollar raises the cost of dollar-denominated debt.
c. Commodity Prices
Commodities like oil and gold are priced in dollars. A stronger dollar typically depresses commodity prices, affecting global trade balances.
d. Global Stock Markets
U.S. rate hikes often lead to a decline in global equity valuations as risk-free yields become more attractive compared to stocks.
7. Challenges in Monetary Policy Implementation
Despite its tools and experience, the Fed faces several challenges:
a. Balancing Inflation and Growth
The dual mandate creates trade-offs. Tightening to control inflation may harm employment, while loosening to support jobs risks fueling inflation.
b. Time Lags
Monetary policy operates with delays — it can take months for rate changes to influence inflation, employment, and GDP.
c. Global Linkages
The interconnected global economy means domestic policy changes can trigger unintended international consequences, such as currency depreciation or capital flight in other nations.
d. Market Expectations
The Fed’s credibility and communication are vital. Miscommunication or unexpected decisions can cause financial volatility.
8. The Role of Forward Guidance and Communication
In modern monetary policy, communication is as powerful as action. Through forward guidance, the Fed provides information about its future policy intentions to shape market expectations.
For instance, during periods of uncertainty, clear communication can stabilize bond markets and prevent panic. Conversely, unexpected policy shifts — often referred to as “Fed shocks” — can cause sharp asset price movements.
9. The Future of Fed Policy and Interest Rates
The future of Federal Reserve policy will likely be shaped by new economic realities:
Digital Currency and Technology: The rise of digital payments and discussions on a Central Bank Digital Currency (CBDC) could redefine how monetary policy is transmitted.
Climate Risk and Sustainability: The Fed is beginning to factor climate-related risks into its analysis, recognizing their long-term economic impact.
Geopolitical Uncertainty: Global tensions, trade wars, and supply chain disruptions can complicate inflation dynamics and policy effectiveness.
Data-Driven Policy: The increasing use of real-time data and AI-driven forecasting tools will make policy more responsive and precise.
In coming years, the Fed must navigate between promoting growth and preventing inflation resurgence — a balancing act made harder by evolving global economic dynamics.
Conclusion
The U.S. Federal Reserve’s policy and interest rate decisions lie at the center of global economic stability. Through meticulous management of the federal funds rate and other instruments, the Fed influences inflation, employment, and investment patterns across the world.
While its actions are designed primarily for the U.S. economy, the ripple effects extend to every major financial center and emerging market. In an era of globalization, digital transformation, and persistent uncertainty, the Fed’s challenge is to maintain credibility, transparency, and flexibility.
Ultimately, effective Federal Reserve policy ensures not only the health of the American economy but also the broader balance of the global financial system — a responsibility that underscores its position as one of the most powerful economic institutions in the world.

False Break at 3700:Retreating Toward 3680-3670Currently, the highest price of gold has reached around 3699, and it is only one step away from the 3700 mark! I have to say that against the backdrop of significantly increased market expectations for interest rate cuts, the resonance of technical and news factors has pushed up gold prices. The current bullish momentum is strong, and there has been almost no obvious pullback during the rise. At this stage, most of these are tricks played by big funds, and it is actually difficult for retail investors to participate in long transactions. Therefore, at this stage, I will not rush to chase the rise in gold prices.
From an intraday perspective, gold still has the potential to hit the 3700-3710 area, so my latest trading plan is to continue shorting gold near this area. With gold bulls so strong, why I am still optimistic about a gold pullback. The main reason is that the current market is facing a critical time window. The Federal Reserve will announce its interest rate decision tomorrow, but I think the Federal Reserve may announce a 25 basis point interest rate cut in a step-by-step manner, rather than the 50 basis points expected by the market. If the rate falls far short of market expectations, gold could experience a significant pullback or even a crash. However, the sharp rise in gold prices near the Fed's rate decision suggests it may be an attempt to reserve room for further declines. In addition, based on the current trading volume, the small trading volume may not be able to support the continued upward trend of gold. It is for this reason that while I avoid chasing high gold prices, I also always remain optimistic about gold shorts.
Therefore, at this stage, I would consider shorting gold in batches based on market price performance. By effectively raising the average entry price, we can reap the first bite of the pie after gold prices fall.
However, we must note that short-term support for gold currently lies in the 3680-3670 area, with strong structural support below that at 3660-3650. Therefore, in order to lock in profits in time, these two support areas will be our primary target areas for short trading.

POLICYBAZAAR (POLICYBZR) Trade UpdateTrade Overview: A strong bullish momentum is evident, with TP1 already achieved at 1709.20. The remaining targets are well within reach, given the current trend.
Key Levels:
Entry: 1677.05
Stop Loss (SL): 1651.05
Take Profit Targets:
TP2: 1761.20
TP3: 1813.20
TP4: 1845.30
Technical Insight: The price is holding above the critical support levels, with the GREEN trend line from the Risological Indicator signaling continued upward movement. Traders are advised to trail the stop loss to lock in profits as the trade progresses.
Keep monitoring for trend continuity!

GOLD REACHES NEW HEIGHTS AMID RISING SAFE-HAVEN DEMANDUS economic data
Positive news came from the jobless claims, which dropped to 241,000, much lower than expected and down from the revised 260,000 from the previous week. US retail sales also did better than predicted, rising by 0.4% from the month before, compared to an expected 0.3% increase. Nonetheless, positive retail sales and strong jobless claims are unlikely to alter the course of the Fed's monetary policy.
ECB rate cut
ECB cuts rates as expected and upcoming months will be crucial as the ECB evaluates economic conditions and decides on its future monetary policy approach.
US dollar index-
The US dollar index showed a minor decline due to profit booking. A break above 104 would confirm a continuation of the bullish trend.
Based on the CME FedWatch Tool, the likelihood of a 25 basis point rate cut in November has risen to 92.2%, up from 89.50% just a week ago.

USDJPY Analysis: Potential Bullish Bias for the Upcoming Week!USDJPY Analysis: Potential Bullish Bias for the Upcoming Week (Sept 23-29, 2024)
As we look ahead to the coming week, USDJPY appears poised for a potential slightly bullish bias. This outlook is based on a confluence of fundamental factors and current market conditions that favor USD strength relative to the Japanese yen. Below is a breakdown of key drivers supporting this outlook, along with insights that could influence price action.
1. Federal Reserve's Hawkish Stance
One of the key drivers for a potential bullish bias in USDJPY next week is the persistent hawkish tone from the Federal Reserve. Although the Fed opted to pause rate hikes in September, policymakers have indicated that they are open to further tightening if inflationary pressures persist. Recent inflation data in the U.S. showed a slight uptick in the Consumer Price Index (CPI), suggesting that the Fed may still consider additional rate hikes in 2024. Higher U.S. interest rates would continue to bolster the U.S. dollar, driving demand for USDJPY as traders seek yield differentials.
2. Bank of Japan's Dovish Policy
In stark contrast to the Fed, the Bank of Japan (BoJ) remains committed to its ultra-loose monetary policy, including negative interest rates and yield curve control. The BoJ's dovish approach continues to weigh on the Japanese yen, especially in an environment where other major central banks are tightening monetary policy. While some market participants expect the BoJ to consider policy changes in the future, there have been no concrete signals indicating a shift in the near term. This widening policy divergence between the Fed and BoJ is a key factor supporting a bullish outlook for USDJPY.
3. Safe Haven Demand Waning
The yen is traditionally viewed as a safe-haven asset, particularly during periods of global market volatility. However, recent market stability, coupled with optimism surrounding global growth prospects, has reduced demand for the yen as a haven. As risk sentiment improves, investors are more likely to allocate capital into higher-yielding assets, which could further weaken the yen.
Moreover, geopolitical tensions that previously supported yen demand have eased slightly, making USDJPY more likely to drift higher in a low-risk environment.
4. U.S. Treasury Yields Rising
Another factor contributing to the bullish bias in USDJPY is the rise in U.S. Treasury yields. Higher yields on U.S. government bonds make the dollar more attractive to foreign investors, adding upward pressure to USDJPY. The correlation between USDJPY and U.S. Treasury yields is well-documented, and as yields rise, so too does the currency pair. Traders will be closely monitoring U.S. economic data next week, including durable goods orders and GDP figures, to gauge the potential for further yield increases.
5. Technical Analysis: Key Support and Resistance Levels
From a technical perspective, USDJPY is trading within a well-defined range, but with a slight bullish bias as long as it holds above key support at the 147.50 level. A break above the psychological 150.00 level could open the door to further upside, with resistance seen at 151.50. On the downside, failure to hold above 147.50 could lead to a test of lower levels around 146.00. Momentum indicators, including the Relative Strength Index (RSI), are currently neutral but leaning slightly toward overbought territory, suggesting room for further gains before a pullback.
6. U.S. Economic Data Next Week
Next week, market participants will pay close attention to several high-impact economic reports out of the U.S., including the Durable Goods Orders on Tuesday and GDP Growth on Thursday. Positive readings on these metrics could fuel further gains in USDJPY, reinforcing the bullish bias. Conversely, any disappointing data could dampen USD strength and lead to some consolidation in the pair.
Conclusion
Given the combination of hawkish signals from the Fed, the BoJ's ongoing dovish stance, rising U.S. Treasury yields, and waning safe-haven demand, USDJPY appears to have a slightly bullish bias heading into next week. Traders should watch for any shifts in risk sentiment or unexpected economic data that could alter this outlook. The key levels to watch are 147.50 for support and 150.00 for resistance.
Keywords: USDJPY forecast, USDJPY bullish, USDJPY analysis, Bank of Japan policy, Federal Reserve rate hikes, U.S. Treasury yields, Japanese yen, safe-haven demand, forex trading, USDJPY technical analysis, USDJPY key levels, USDJPY next week, trading USDJPY.

USD/JPY Forecast: Bullish Bias Expected – Key Factors to Watch.USD/JPY Forecast: Bullish Bias Expected – Key Factors to Watch (20/09/2024)
As we analyze the USD/JPY pair on 20/09/2024, the outlook appears to be slightly bullish for this week and next. Several key drivers are pushing the U.S. dollar higher against the Japanese yen, creating an attractive opportunity for traders. In this article, we’ll break down the fundamental factors behind this forecast and highlight the elements influencing USD/JPY price action in the coming days.
1. US Dollar Strength Bolsters USD/JPY
The strength of the U.S. dollar is a critical factor contributing to the bullish bias in USD/JPY. With the Federal Reserve signaling a commitment to maintaining high interest rates for an extended period, the greenback remains in demand. Fed officials have recently emphasized their concerns about persistent inflation, leading markets to believe that U.S. interest rates will stay elevated for longer than previously expected.
This hawkish monetary stance, coupled with strong economic data, has made the U.S. dollar more attractive to investors. As a result, USD/JPY has been moving higher, with the strong dollar likely to continue exerting upward pressure on the pair.
Key SEO keywords: USD/JPY forecast, US dollar strength, Federal Reserve policy, interest rate hike, USD/JPY price action.
2. Dovish Bank of Japan Keeps the Yen Weak
On the other side of the equation, the Japanese yen remains under pressure due to the Bank of Japan’s (BoJ) ultra-loose monetary policy. The BoJ has shown no signs of tightening monetary policy in the near term, despite global inflationary trends. Japan’s central bank continues to prioritize economic support, maintaining low interest rates while avoiding any drastic policy shifts.
This dovish stance contrasts sharply with the Federal Reserve’s hawkish policy, widening the interest rate differential between the U.S. and Japan. This is a major driver of USD/JPY’s bullish outlook, as investors gravitate towards the higher-yielding U.S. dollar over the lower-yielding yen.
Key SEO keywords: Bank of Japan policy, Japanese yen weakness, dovish BoJ, USD/JPY interest rate differential, yen depreciation.
3. Interest Rate Differentials Favor USD/JPY Upside
One of the most important factors pushing USD/JPY higher is the widening interest rate differential between the U.S. and Japan. While U.S. Treasury yields remain attractive, the yield on Japanese government bonds remains low due to the BoJ’s dovish policy stance. This gap in yields makes the U.S. dollar more appealing for investors seeking better returns.
The widening interest rate gap is a key bullish signal for USD/JPY, as capital continues to flow into U.S. dollar-denominated assets. As long as the Federal Reserve maintains its hawkish tone, and the BoJ remains accommodative, this dynamic will likely support the bullish bias for USD/JPY.
Key SEO keywords: Interest rate differentials, U.S. Treasury yields, Japanese bond yields, USD/JPY bullish outlook, capital flows into USD.
4. Japanese Economic Weakness Adding Pressure on the Yen
Another factor supporting the bullish bias for USD/JPY is the ongoing weakness in the Japanese economy. Japan has struggled with slow economic growth and weak inflation, further justifying the BoJ’s cautious approach to monetary policy. Domestic consumption remains low, and Japan’s economic recovery has been uneven.
As a result, the Japanese yen continues to face downside pressure, while the U.S. dollar benefits from stronger economic fundamentals. This divergence between the U.S. and Japanese economies adds to the case for a stronger USD/JPY in the coming weeks.
Key SEO keywords: Japanese economic weakness, low inflation in Japan, weak yen, Bank of Japan policy, USD/JPY forecast.
5. USD/JPY Technical Analysis Suggests Further Upside Potential
From a technical standpoint, USD/JPY is showing signs of further upside. The pair has been testing key resistance levels, and if these levels are broken, we could see a more significant bullish move. The recent price action has shown strength, with USD/JPY consistently finding support at higher lows.
Traders should watch for a potential breakout above these resistance zones, as it could signal further gains for USD/JPY. With strong fundamentals supporting the pair, the technical outlook aligns with the overall bullish bias.
Key SEO keywords: USD/JPY technical analysis, key resistance levels, USD/JPY price action, bullish trend, support and resistance.
Conclusion: Bullish Bias Expected for USD/JPY
In conclusion, several fundamental and technical factors support a slightly bullish bias for USD/JPY over the next couple of weeks. The ongoing strength of the U.S. dollar, the dovish stance of the Bank of Japan, favorable interest rate differentials, and Japan’s economic challenges all point towards further upside potential for USD/JPY.
Traders and investors should closely monitor these key drivers as they make their trading decisions. As always, staying updated on central bank policies, economic data, and technical signals will be crucial in navigating the USD/JPY price action during this period.
Key SEO keywords: USD/JPY forecast, bullish bias, USD/JPY key drivers, US dollar strength, Bank of Japan policy, interest rate differential, USD/JPY technical analysis.

USDJPY: Slight Bullish Bias This Week? (19/09/2024)As of September 19, 2024, traders are closely monitoring the USDJPY pair for potential bullish momentum. Several fundamental factors and market conditions indicate that the pair might see a slight upward bias this week. Let’s dive into the key drivers affecting the USDJPY price action.
1. Diverging Central Bank Policies
One of the primary influences on USDJPY is the monetary policy divergence between the Federal Reserve (Fed) and the Bank of Japan (BoJ).
- Federal Reserve’s Stance: As we move into the week, the market expects the Fed to maintain a hawkish stance or at least keep interest rates elevated. Although there’s some speculation about a possible pause in future rate hikes, the Fed's priority remains controlling inflation. This higher interest rate environment in the US makes the US dollar more attractive, pushing USDJPY upwards.
- Bank of Japan’s Ultra-Loose Policy: In contrast, the BoJ continues its ultra-loose monetary policy, aiming to stimulate Japan’s sluggish economy. Despite rising inflation in Japan, the BoJ has shown little inclination to raise rates aggressively. This Interest rate differential between the US and Japan tends to weaken the yen, giving a bullish outlook for USDJPY.
2. Risk Sentiment in Global Markets
Risk sentiment plays a crucial role in the movement of USDJPY. When global markets are in a risk-off mode, investors tend to flock to safe-haven assets like the Japanese yen, strengthening it. However, recent global economic data and financial news have maintained a somewhat stable risk appetite, leaning towards a risk-on environment.
- US Economic Data: Recent reports from the US, such as better-than-expected retail sales and strong labor market data, continue to support the narrative of economic resilience. This fuels demand for the dollar and supports USDJPY’s bullish momentum.
- Global Geopolitical Risks: While geopolitical tensions in regions like Europe and the Middle East may inject some volatility, there hasn’t been a major shift toward a risk-off sentiment that would heavily favor the yen. For now, dollar strength seems to dominate.
3. Japanese Economic Conditions
Japan’s economy continues to struggle with low growth despite rising inflation. The BoJ’s consistent approach to stimulus, combined with the government's push for wage growth, has not yet translated into significant yen strength. Additionally, trade deficits in Japan, exacerbated by higher import costs, have weighed on the yen’s valuation.
Without a major shift in BoJ policy or a significant improvement in Japan's economic performance, the yen will likely remain under pressure, keeping USDJPY on a slightly bullish path.
4. US Bond Yields
US Treasury yields are another major factor driving the USDJPY. Higher US bond yields, often seen in response to tighter monetary policy and strong economic data, make the dollar more attractive to foreign investors. The upward trajectory of bond yields has been a persistent theme, reinforcing dollar strength. If this trend continues through the week, we can expect additional support for USDJPY.
5. Technical Indicators
Looking at the technical analysis for USDJPY, the pair has been trading near key resistance levels in recent sessions. If the pair breaks above these resistance zones, we could see further bullish momentum.
- Key Support and Resistance Levels: The 145.00 level has been a psychological support level for USDJPY, while 148.50 serves as resistance. Should the pair break beyond this resistance, it could trigger more buying pressure, pushing USDJPY higher.
Conclusion: USDJPY’s Slight Bullish Bias
In conclusion, the USDJPY pair is expected to exhibit a slight bullish bias this week, primarily driven by:
- Monetary policy divergence between the Fed and BoJ.
- Favorable US economic data and rising Treasury yields.
- Limited economic growth in Japan, with persistent trade deficits.
- Stable global risk sentiment supporting the dollar over the yen.
Traders should keep an eye on US bond yields, Fed comments, and any sudden shifts in risk sentiment or geopolitical events, as these could influence USDJPY’s trajectory throughout the week.
---
Keywords:
- USDJPY forecast
- USDJPY bullish bias
- USDJPY analysis September 2024
- USDJPY technical analysis
- USDJPY key drivers
- USDJPY trading strategy
- USDJPY and Federal Reserve policy
- USDJPY support and resistance levels
- USDJPY risk sentiment
- USDJPY bond yields impact

USDT.D Analysis: $ Dominance Dips, Opening Doors for Crypto?Hey traders,
Let's dive into Tether Dominance CRYPTOCAP:USDT.D and see what it might mean for the crypto market.
Channel Cracked:
USDT.D used to chill in a monthly channel for a while. But recently, it decided to break free, potentially paving the way for a continued decline in dollar dominance, reaching the next weekly resistance level.
RSI Bouncing Back (Maybe):
The Relative Strength Index (RSI) just stepped out of the oversold zone. This could signal a potential price bounce or a period of consolidation (think of it as the market taking a breather).
Crypto on the Rise?
As long as dollar dominance keeps falling, more money might flow into cryptocurrencies, potentially pushing their prices up.
Bitcoin's Buddies:
If this dollar decline happens alongside Bitcoin price fluctuations and a dip in its own dominance, we could see altcoins surge in an epic way!
The US Dollar Factor:
One big question mark: how will US policies affect the dollar's value and, in turn, crypto prices? Only time will tell.
Time to Take Profits?
If the RSI exits the oversold zone, it might be a good time to consider closing out your long positions (selling your crypto) or taking some profits off the table.
Remember:
This analysis is for educational purposes only, not financial advice. Do your own research and use proper risk management before making any trades.

USDJPY: Thoughts and AnalysisToday's focus: USDJPY
Pattern – Ascending Triangle Pattern
Support – 146.50 - 144.75
Resistance – 147.92
Thanks for checking out today's update. Today, we have run over USDJPY, breaking down the overall price picture, levels, and patterns and incorporating moving average and RSI into the analysis.
The USDSJPY continues to be locked up in a bullish continuation pattern. If we see a break above this pattern, we are interested in how buyers handle being back into a supply and resistance area. An area that stopped the last main rally. On top of that, the RSI is also showing lower highs as price has made higher highs. This could be a sign of divergence, but we will continue to watch if buyers can make a higher breakout.
If we see a break lower, we will look to 146.50 and 144.75 as potential support areas.
Heads up: BOJ policy rate and policy statement are due on Friday.
Have a great day and good trading.

Navigating The American Debt Ceiling DramaSome people create their own storms. And then get upset when it starts to rain. US Debt Ceiling drama is akin to a soap opera that never ends.
Debt ceiling issue is not new. Why bother now? Political polarisation in the US has got to unprecedented levels. The showmanship could tip over into a political nightmare. It could send economic shockwaves with impact deeply felt both within US and well beyond its shores.
Many politicians seemingly are so pulled away from reality that their fantasies aren’t working. Wishing away a problem out of its existence is not a solution.
The Debt Ceiling is here. US defaulting on its debt is highly unlikely. Scarily though, the probability of that occurrence is non-zero.
This paper looks at recent financial history surrounding prior debt ceiling episodes. Crucially, it delves into investor behaviour and their corresponding investment decisions across various asset classes.
When uncertainty looms large, straddles and spreads arguably deliver optimal hedging and investment outcomes.
A SHORT HISTORY OF DEBT CEILING. WHAT IS IT? HAS IT BEEN BREACHED BEFORE?
The US debt ceiling is a maximum cap set by the Congress on the debt level that can be issued by the US Treasury to fund US Government spending.
The ceiling was first introduced in 1917 to give US Treasury more flexibility to borrow money to fund first world war.
When the US government spends more money than it brings in through taxes and revenues, the US Treasury issues bonds to make up the deficit. The net treasury bond issuance is the US national debt.
Last year, the US Government spent USD 6.27 trillion while only collecting USD 4.9 trillion in revenue. This resulted in a deficit of “only” USD 1.38 trillion which had to be financed through US treasury bond issuance.
This deficit was not an exception. In fact, that’s the norm. The US Government can afford to and has been a profligate borrower. It has run a deficit each year since 2001. In fact, it has had budget surplus ONLY five (5) times in the last fifty (50) years.
If that wasn’t enough, the deficit ballooned drastically from under USD 1 trillion in 2019 to more than USD 3.1 trillion in 2020 and USD 2.7 trillion in 2021 thanks to massive pandemic stimulus programs and tax deferrals.
This pushed the total US national debt to a staggering USD 31.46 trillion, higher than the debt ceiling of USD 31.4 trillion.
The limit was breached! So, what happened when the ceiling was broken?
Not that much actually. When the ceiling is broken into, the US Congress must pass legislation to raise or suspend the ceiling. Congress has raised the ceiling not once but 78 times since 1970.
The decision is usually cross-partisan as the ceiling has been raised under both Republicans and Democrats. It was last raised in 2021 by USD 2.5 trillion to its current level.
Where consensus over raising the ceiling cannot be reached, Congress can also choose to suspend the ceiling as a temporary measure. This was last done from 2019 to 2021.
Since January, the Treasury has had to rely on the Treasury General Account and extraordinary measures to keep the country functioning.
Cash balance at the Treasury remains precariously low. Its operating balance stood close to nearly USD 1 trillion last April but now hovers around USD 200 billion.
Such reckless borrowing! Yet US continues to remain profligate. How?
Global investors have confidence in the US Government's ability to service its debt. Despite the increasing debt, the US Government continues to pay investors interest on its bonds without a miss.
Strong economic growth and its role as a global economic powerhouse assuages investor concerns over a potential default.
Additionally, where Treasury does not have adequate operating cash flow, it leans on a credit line from the Federal Reserve (“Fed”). The dollar’s strength and reserve status contribute to the US Government’s creditworthiness and vice-versa.
The Fed is also the largest holder of US government debt. It holds USD 6.1 trillion as of September 2022 (20% of the overall debt). The share of government debt held by the Fed surged to current levels from just above 10% during the pandemic due to massive purchases of treasury bills by the Fed as an emergency stimulus measure.
GROWING US DEBT IS BECOMING A SOURCE OF CONCERN
US debt has ballooned during the pandemic. It is deeply concerning for multiple reasons. Key among them is the risk of default. Although debt has increased significantly, GDP growth during this period has been tepid due to pandemic restrictions stifling economic activity.
As such the ratio of national debt to GDP, a measure of the US’s ability to pay back its loan has also skyrocketed. This increases the risk that the US Government may fail to service its debt.
A US Government default would lead to surging yields on treasury bonds and crashing stock prices. It would also call into question its creditworthiness limiting future borrowing potential.
A default will also have far-reaching economic consequences threatening dollar hegemony which is already being challenged on multiple fronts.
Another concern is the rising cost of servicing the debt. Servicing the debt is the single largest government expense. Interest payments on debt this year are expected to reach USD 357.1 billion or 6.8% of all government expenditure.
Additionally, with the Fed having raised interest rates with no stated intention of pivoting in 2023, the interest rate on US public debt, which is currently at historical lows, will also rise.
DEBT CEILING BREACH AGAIN. SO WHAT? LOOKING BACK IN TIME FOR ANSWERS.
There has been more than one occasion when political disagreements resulted in Congress delaying the raising of the debt limit.
In 2011, political disagreements pushed the government to the brink of default. The ceiling was raised just two (2) days before the estimated default deadline (the “X-date”).
Despite the raise, S&P lowered its credit rating for the United States from AAA to AA+ reflecting the effects that political disagreements were having on the country’s creditworthiness.
This played out again in 2013 due to same political disagreements. Thankfully, for investors, the effects of the 2013 crisis on financial markets were not as severe.
Flash back. Equity markets initially dropped after the debt ceiling was reached and investors worried that the disagreements would not be resolved in time. In July 2011, markets started to recover as both parties started to work on deficit reduction proposals.
Then on July 25th, just eight (8) days before the borrowing authority of the US would be exhausted, Credit Default Swaps on US debt spiked and the CDS curve inverted as participants feared that a deal would not be reached in time. This led equities sharply lower.
On August 2nd, a bill raising the ceiling was rushed through both the House and the Senate. Following this S&P lowered US credit rating from AAA to AA+ citing uncontrolled debt growth. Equity prices continued to drop even after the passage of the bill.
Commodities showed similar price behaviour heading into the passage of the bill. However, unlike stocks, gold and silver prices rallied after August 2nd.
The USD weakened against other currencies before the passing of the bill but recovered after August 2nd.
Treasury yields trended lower but spiked during key events during this period. Short-term treasury yields remained highly volatile. Following crisis resolution, yields plunged sharply.
US DEBT CEILING CRISIS AGAIN. WHAT NOW IN 2023?
The US reached its debt ceiling again in January 2023 and yet another debt crisis. 2013 is repeating itself again as lawmakers disagree over whether to raise the ceiling further or bring the budget under control.
The Congressional Budget Office (CBO), a non-partisan organization, has estimated that the US could be at a risk of default as early as June 1st.
Republicans disagree with the Biden administration. They seek budget cuts to reduce annual deficits while Democrats want the ceiling to be raised without any conditions tied to it.
This crisis is exacerbated by rising political polarisation in the US. Not just metamorphically, the Republicans and Democrats are at each other’s throat.
A study by the Carnegie Endowment for International Peace found that no established democracy in the recent past has been as polarised as the US is today. This raises the risk that Congress gets into a stalemate.
Moreover, the house is only in session for 12 days in May. After the law is passed in Congress it must also pass through the Senate and the President. The availability of all three overlap on just seven (7) days, the last of which is the 17th of May. This means that lawmakers have just 3 days (from May 12th) to reconcile their differences before the US is put at risk of default.
POSITIONING INVESTMENT PORTFOLIOS IN DEBT CRISIS WITH X-DATE IN SIGHT
What’s X-date? It refers to the date on which the US Government would have exhausted all its options except debt default.
The X-date could arrive as early as June 1st. There is a small chance that it could arrive in late July or early August. The US Government collects tax receipts in mid-June. If the US Treasury can stretch until then it will have enough cash to last another six weeks before knocking against the debt ceiling again.
The current crisis has been brewing. Equity markets remain sanguine. But near-term treasury yields have started panicking. Short term yields have spiked. The difference in yield on Treasury Bills that mature before the likely X-date (23/May) & after it (13/June) has shot up.
Muted equity markets create compelling opportunity for short sellers. In the same vein, it also presents buying opportunities when debt ceiling is eventually lifted.
When up or down is near impossible to predict, an astutely crafted straddle or time spread can save the day.
DISCLAIMER
This case study is for educational purposes only and does not constitute investment recommendations or advice. Nor are they used to promote any specific products, or services.
Trading or investment ideas cited here are for illustration only, as an integral part of a case study to demonstrate the fundamental concepts in risk management or trading under the market scenarios being discussed. Please read the FULL DISCLAIMER the link to which is provided in our profile description.

The ‘free lunch’ in currency hedging?Since 2012, WisdomTree has been a leader in helping investors understand the impact that currency risk can have on their portfolios. When investors allocate funds internationally, there are two sources of return: the local asset return and the return from changes in foreign exchange (FX) rates. This can be problematic during periods in which foreign currencies are depreciating against the investor’s home currency, leading to underperformance.
Historically, the default allocation of a majority of investors has been to keep the equity and currency exposure combined. However, this doesn’t have to be the case and it is possible to uncouple those risks.
Currencies, a significant source of risk and tracking difference
A globally diversified equity portfolio, like the MSCI World point of view, is a bundle of equity and currency risk. 68% of the MSCI World is invested in US equities and, therefore, denominated in US dollars. 6% is invested in Japanese equities and, therefore, denominated in Japanese yen and so on. The exposure to currency can add to or detract from the performance of the equities themselves. This means that the performance of the MSCI World (unhedged) is quite different for an investor with the US dollar as the base currency compared to an investor with the euro as the base currency.
Every year, the difference in performance between the MSCI World hedged or unhedged is significant for both euro and pound-based investors. For euro-based investors, the difference in performance driven by the currency exposure oscillated between -9.41% and +10.1%. For a British pound investor, the difference is between -5.9% and +20.4%.This embedded currency exposure also tends to increase the risk in the portfolio.
Because the currency risk sits on top of the equity risk when investing in global equities, taking currency risk or not taking currency risk has to be a conscious investment decision.
Currency hedging as a tactical endeavour
Foreign exchange rates change over time. Many factors contribute to those deviations:
interest rate expectations
inflation differentials
public policy
growth forecast
balance of payments
Over the short to medium term, currencies can move quite dramatically against each other leading to potential losses or gains for investors invested in unhedged foreign equities. For investors with strong conviction on the direction of foreign currencies relative to their domestic currency, it is therefore possible to tactically currency hedge, or not, their portfolio to try to benefit from those moves.
Currency hedging for the long run
Whilst in the short and medium term foreign exchange rates fluctuate, over the very long term, currencies tend to fluctuate around a long-term equilibrium. This phenomenon is often called ‘long term mean reversion’. This means that for long term investors in global equities, the performance impact of currencies should offset itself over long periods of time. In other words, the performance of currency hedged and unhedged investments should be similar.
However, from a risk point of view, this is not the case. As discussed previously, the long-term volatility of the unhedged investment tends to be higher than that of the currency hedged investment. A reduction of risk with zero long term expected returns sounds like a ‘free lunch’ which is why investors could look at currency hedged investments in foreign equities as their default long term investment policy.
For example, a portfolio manager with a base currency of euro and a holding of 1 million US dollars of US equities can hedge the US dollar currency risk by selling a 1 million US dollar forward contract against euro for settlement in a month’s time at today’s rate.
Operationally, this process can be quite cumbersome, in particular for a portfolio with multiple currencies and/or with hard to access currencies. The MSCI World comprises 13 currencies which means that investors would need to trade 12 FX forwards every time they want to hedge the currency exposure and then they would need to roll those 12 forwards on a regular basis.
This is why WisdomTree has been launching currency hedged share classes for its strategies, providing turnkey solutions for their investors and their currency hedging need.

Europe is treading a fine line between growth and inflationEuropean equities have ushered in 2023 with a strong rebound, up 7.72%1. Exchange-traded fund (ETF) flows into the European region have risen by US$13bn, in sharp contrast to the US that has seen US$9bn of outflows year-to-date (YTD)as of 27 February 2023.
The confluence of China re-opening its economy and prudent management of resources during the energy crisis, alongside better valuations, helped European equities flourish. Essentially, the worst impact from the energy crisis that was priced in for Europe did not end up materialising, thereby improving sentiment.
Resilient Q4 2022 earnings season but outlook remains cautious
Europe is seeing better earnings growth for Q4 2022, up 8.81%3. The deep value parts of the market – financials, energy, utilities, consumer staples, and healthcare – continue to contribute to positive earnings growth. At the same time, China’s reopening has benefitted cyclical sectors across consumer discretionary and communications which posted the strongest earnings growth up 49% and 38% respectively4.
At 8% of sales, Europe has the second-highest exposure to China after Asia-Pacific (ex-Japan). It therefore would make sense to position for a better China macro-outlook in the sectors with the highest revenue exposure to China – semiconductors, materials, consumer durables, energy, and automobiles. We also know Chinese consumers saved one-third of their income last year, depositing 17.8 trillion yuan ($2.6 trillion) into banks, and investors are pinning their hopes on those savings finding their way into Europe’s luxury goods market.
Another factor favouring European equities has been European buyback activity which has increased to a record level, with a net buyback spend reaching around 220bn thereby creating an additional yield of around 2%5. This has helped Europe’s total yield (that is, buyback + dividends) outpace that of the US for the first time in 30 years.
Headwinds persist from further tightening by European Central Bank (ECB)
Euro-area Purchasing Manager’s Indices (PMI) continued their rebound in February reaching a nine-month high of 51, helped by easing headwinds from the energy crisis and resilient consumer spending amidst fading inflation. Headline inflation in the Euro-area for January dipped to 8.6%, showing further evidence that price pressures are easing6. However, core inflation in the Euro-area rose to 5.6%5 from 5.2% in December, highlighting that underlying price pressures continue to remain sticky. The more resilient economic data of late is likely to keep the ECB on a more hawkish monetary path. As monetary policy works with approximately a 10 - 12 month lag, we are yet to see the full impact of the recent spate of tightening.
Euro-area M1 growth is down to 0.6%, marking the second weakest reading on record pointing to weaker growth ahead. Furthermore, the Q1 results of the ECB Bank Lending Survey showed Euro-area credit conditions tightening at the fastest pace since 2009. In the Euro-area, moves in M1 growth tends to lead economic momentum by six months. This suggests that tighter monetary policy is leading to reduced credit availability for the real economy.
Tailwinds from looser fiscal policy to aid the Euro-area recovery
Prior to the Ukraine war, the Euro-area was characterised by relatively tight fiscal policy. However, the shock of the energy crisis drove a shift in fiscal policy. Governments are loosening their fiscal purse strings again, offering significant support to both consumers and businesses amidst the recent energy shock. Government expenditure, as a share of GDP, surged to almost 60% as COVID-19 hit (from just over 45% prior to the virus) and it is now rising again higher than before the pandemic7. The Eurozone budget deficit is now widening and heading towards 4% of GDP. Eurozone government expenditure as a share of GDP in 2022, through Q3, was 3% higher than the average from 2017 to 2019, with revenues up less than 1%. The think tank, Bruegel, estimates that EU economies have set aside €680bn to date to protect consumers from the energy crisis, which comes in addition to the EU Recovery Funds (€750bn from 2021 to 2027) which are now flowing. This is close to 10% of GDP, which excludes the cost of COVID-19 support.
The European economy remains caught between tailwinds – loose fiscal policy, easing energy prices, strong labour market, the re-opening of the Chinese economy – and headwinds of a weakening credit cycle in response to tighter monetary policy. Amidst this macro backdrop we expect investors to be more selective as the existing tailwinds should help Europe endure a milder than expected recession.

Brace for volatility as inflation meets recession2023 has been ushered in with a rebound in pockets of equity underperformance from 2022. Markets are coming to terms with the fact that stickier inflation and more resilient economic data globally are likely to keep central banks busy this year. Owing to which the spectre of interest rates staying higher for longer appears to be the dominant theme for the first half of 2023. Global money market curves are re-pricing higher to reflect the tighter monetary scenario.
For the Federal Reserve (Fed), markets have priced in a 5.5% terminal rate, somewhat higher than was suggested by the median dot plot back in December. While in Europe, 160Bps of additional rate hikes are being priced for the European Central Bank (ECB) with terminal rate forecasts approaching 4%. The speculative frenzy witnessed since the start of 2023, indicates that equity markets are discounting the fact that the global economy has not faced such an aggressive pace of tightening in more than a decade and the ramifications, although lagged, will eventually be felt across risk assets.
Preference for international vs US equities
Exchange-traded fund (ETF) flows since the start of 2023 resonate investors’ preferences to diversify their portfolios with a higher allocation to international markets versus the US. Since the start of 2023, international equity market ETFs have received the lion’s share of inflows, amounting to US$20.6bn in sharp contrast to US equity ETFs that suffered US$9.3bn in outflows.
Looking back over the past decade, US companies outpaced international stocks owing to two main drivers of equity price appreciation: earnings and valuation. Earnings remain the key driver for equity markets over the long term. If we try to think about what lies ahead, we can see that earnings revision estimates are displaying a marked turnaround for China, Japan, and Emerging Markets (EM), whilst the US and Europe are poised to see further earnings contractions.
China’s recovery remains the important swing factor that could enable its economy, alongside EM and Japan, to outperform global equities in 2023. At 8% of sales, Europe has the second highest exposure after Asia-Pacific (ex-Japan) to China. Yet it’s important to bear in mind that European companies earn twice the amount of revenue from the US than from China. So, a soft landing in the US will be vital for Europe to continue its cyclical rally.
US valuations remain high vs international developed and EM equities
US equity market valuations from a price-to-earnings (P/E) ratio remain high globally, whilst Japan continues to trade at a steep 29% discount to its 15-year average. Amidst the recent rally, European valuations at a 13.7x P/E ratio remain at a 14% discount to its 15-year average. That being said, three months ago European equity valuations were trading at a 35% discount to its 15-year average. After travelling half the distance to their long-term average, European valuations might have to contend with the headwinds of tighter monetary policy.
Evident from the chart above, international markets ex-US continue to boast of favourable valuations allowing for a higher margin of safety, which is why we expect investor positioning to tilt in favour of international markets ex-US over the course of 2023.
The battle between Energy and Technology stocks
The Energy sector is coming off a strong year, as tight supplies and rising demand drove energy prices higher in 2022. While these dynamics have failed to play out so far in 2023, owing to the speculative frenzy in riskier parts of the market, we expect earnings results for energy companies, and their stock performance across the spectrum (including oil, gas, refining and services), to maintain momentum in 2023. Whilst investment in oil and gas production has been rising, it will still take multiple years for global supply to meet demand, which continues to support the narrative of higher energy prices.
Refining capacity continues to look tight this year, given the reduced capacity and long lead time required to bring new capacity online. We expect this to support another strong year for the profitability of refining operators. At the same time, energy service companies should also benefit as spending on exploration and production continues to gather steam. The biggest risk to the sector remains if demand for energy falters in the face of a severe recession. However, as we expect most economies to face a modest recession, this risk is less likely for the Energy sector.
Meanwhile, higher interest rates were the key driver of the underperformance of the Technology sector last year. We continue to see weakness in the Technology sector amidst rising risks of peak globalisation, weaker earnings, and the potential for more regulation. Despite the recent layoff announcements by technology firms, they still appear inflated, with employee growth in recent years 20% too high relative to real sales growth. The COVID-19 pandemic had accelerated the demand in software and technology spending with the rise of remote work and social distancing. However, companies today are more likely to cut their technology spending to offset the higher costs of energy, travel, wages, and other factors. The key risk, in our view, remains that valuations have come down, and if rates do begin to peak, selective technology companies could benefit from the growth generated by their cost-cutting initiatives.
Value vs Growth in 2023
Value stocks tend to be positively correlated with higher inflation. In 2022, high inflation was a result of rising commodity prices, labour shortages, and fiscal stimulus provided by Western economies, whilst Growth stocks were penalised for their lofty valuations. Value-based stocks flourished on commodity supply constraints and cheaper valuations amidst a rising rate environment. Much of this is now priced into Value stocks. Most Value stocks’ earnings growth and valuation re-ratings rely on higher commodity prices or interest rates or a factor outside of their control. Owing to this, we still believe there are opportunities where constrained supply in the absence of falling demand will continue to support higher prices.
There are significant prospects in Europe and Asia where discounts remain wide and sizeable valuation gaps exist across sectors. Europe’s energy sector accounted for two-thirds of Europe’s EPS (earnings per share) growth in 2022. The continuing trend of capital discipline, resilient earnings, and high shareholder returns should keep attracting flows into the sector in 2023. We expect Value stocks to be in better shape to withstand the global economic slowdown. Historically, the Value factor has demonstrated resilience during periods of interest rate volatility.
Conclusion
There is considerable uncertainty about how 2023 will unfold. As the key focus moves from inflation to a recession in 2023, it opens up the possibility of several outcomes for central banks and interest rates. Keeping this in mind, 2023 may well be a tale of two halves, with higher interest rates in the first half, followed by lower rates in the second half as a global recession takes centre stage.

DXY GAME ON!! SPIKE COMING FOR THE DOLLAR?Last week's surprising jobs report sticky inflation, and persistent and frothy financial conditions may force the Federal Reserve members into a more hawkish position, forcing them to keep the heat on interest rates and the money supply.
Many market participants were looking for a pause in rate hikes as soon as next month and possibly a pivot to lowering rates shortly after. This new data is going against what the Fed was trying to accomplish in this rate hike cycle, which is
to keep inflation within mandated guidelines, and to tame loose financial conditions, dashing the hopes for a pivot in policy anytime soon and pushing that pivot out for far longer than some were expecting. This will put upward pressure on bond yields and a dollar so heavily shorted causing the pivot crowd to close out some of their short positions as the Fed puts the screws to the money supply and inflation. This classic cup and handle setup illustrates the effect the Fed Policy may have on the dollar.

DXY monthly ConsolidationNothing goes up forever. We also have the US mid-term elections starting so there is an air of uncertainty around the markets.
If the status quo remains politically, the Fed's monetarism will continue and the DXY should go higher.
If things change after the mid-term elections, monetary policy may also change. We have to wait and see.
Currently, the only people winning are the ones who don't have a directional bias.

POLICYBZR PB Infotech best buying levelNSE:POLICYBZR Policy Bazaar is now trade at best buying level. We can expect a pull back from current levels.
As per my analysis, best entry level is 385-380, Can hold till target of 425 & 456.
Stop loss will be only 365.
Note: This is my personal analysis, only for learning.
Thanks.

EURJPY Sell Idea Hello traders.
EURJPY formed a double top at multiyear High levels.
However, during evening of yesterday, some big players closed their positions and as a result the market direction was occured due to the surpass of sellers.
I think that the psychology of this pair is mainly short and any spike can be considered as a sell opportunity either if it touches the trend line again or if it touches the upper resistance zone.
My long term target is approx. 137 zone which is a OB and strong demand zone.
But there are plenty intermediate take profit levels on other support areas.
Today's Lagarde's speech will be of importance about the future of this pair.

USDJPYLong:
- USD strength/Yen weakness (QT in US/QE in Japan)
- Global USD shortage (foreign governments need USD = Bullish)
Price Target(s): 160.00
** If 160 is broken, 180.00 next level to watch **

Energy CorrectionOver the first half of 2022, energy was a bright spot in markets. NYMEX and Brent crude oil futures rose 40.62% and 40.24%, respectively. The oil futures closed well below the March highs on June 30, with prices north of $100 per barrel. NYMEX natural gas futures moved 45.42% higher over the first half of 2022. The price was at the $5.424 per MMBtu level on June 30 and was over $6 in mid-June.
Meanwhile, thermal coal for delivery in Rotterdam, the Netherlands, was at the $370 per ton level on June 30, 215.16% higher over the first six months of 2022. The nearby August contract was higher at $391 per ton at the end of last week.
A correction takes crude oil futures below the $100 level
Crude oil takes an elevator lower during corrections- Nothing new
The four reasons oil will find a bottom and turn higher
Natural gas remains highly volatile as the peak season approaches
Follow those trends until they bend
Fossil fuel continues to power the world, and while oil has corrected, oil, gas, and coal remain at the highest prices in years. The XLE, a highly liquid ETF that holds shares of the leading US energy producers, refiners, and related companies, moved from $55.50 at the end of 2021 to $71.51 on June 30, a 28.8% gain. At $68.59 on July 15, the XLE continues to outperform the rest of the stock market in 2022 despite the 4.08% loss over the first half of July but still over 23.5% higher in 2022. The most diversified stock market index, the S&P 500, fell 20.58% over the first half of 2022, settling at 3,785.38 on June 30. The index was at the 3,863.16 level at the end of last week, significantly below the closing level of 4,766.18 on December 31, 2021.
Crude oil prices corrected over the past weeks, but while the short-term trend has turned bearish, the landscape could support higher prices over the coming weeks and months.
A correction takes crude oil futures below the $100 level
Crude oil futures tend to take the stairs higher during bullish trends and an elevator lower during corrections. The spike to the March fourteen-year high in WTI and Brent futures was an exception to the rule as Russia’s invasion of Ukraine shocked the oil market and the world.
The chart highlights the correction in the NYMEX crude oil futures market that took the price to a low of $90.56 last week, the lowest price since February 2022. NYMEX WTI futures for August delivery were at the $97.59 level on Friday, July 15.
Brent futures have been trading at a premium to the WTI futures because they reflect the price of oil production from Europe, Russia, North Africa, and the Middle East. Brent futures also fell to the lowest price since February 2022 last week when they reached $94.50 per barrel. The nearby September contract settled at the $101.16 level on July 15.
Crude oil takes an elevator lower during corrections- Nothing new
As we learned in early 2020, when the pandemic took NYMEX crude oil futures to a record low below zero and Brent futures to the lowest price of this century at $16 per barrel, declines in crude oil often defy logic, reason, and rational analysis. Over the past decades, there are more than a few examples of drops that take prices far below analysts’ expectations before rebounding.
The latest correction took the continuous NYMEX contract from $130.50 in early March to $90.56 last week, a 30.6% drop. Brent futures fell from $139.13 to $94.50, or over 32% over the same period. WIT and Brent futures have made lower highs and lower lows over the past four months.
The four reasons oil will find a bottom and turn higher
Four factors could cause crude oil prices to eventually find a bottom and return to a bullish trend:
The war in Ukraine continues to rage with Europe and the US tightening the sanctions noose around Russia’s neck. Russian retaliation could cause embargos that create severe crude oil shortages, lifting prices.
One of the factors weighing on oil prices is the Chinese economic weakness caused by the COVID-19 lockdowns. When they end, the demand from the world’s second-leading economy and the most populous country could soar, running the oil bear into a charging bull.
The US government continues to look elsewhere for oil production as policies address climate change. According to the US Energy Administration, the US Strategic Petroleum Reserve has declined to the 485.1-million-barrel level as of July 8, the lowest level since 1985. The administration continues to withdraw one million barrels each day from the SPR. Eventually, the US will need to replace its reserves.
There are few incentives for US and European oil companies to increase production in the current environment. OPEC and Russia have no interest in addressing climate change. The world continues to depend on fossil fuels, and alternative and renewable energy domination are decades away. With oil production and pricing controlled by Riyadh and Moscow, higher prices are likely after the current correction.
While the oil price is correcting lower, the reasons for a bottom and a return to higher prices remain compelling in mid-July 2022.
Natural gas remains highly volatile as the peak season approaches
In June 2020, US natural gas futures fell to a twenty-five-year low of $1.44 per MMBtu.
The chart shows the rally in the US natural gas futures market that took the price of the continuous contract over 6.7 times higher by June 2022, when it reached the highest price since 2008 at $9.664 per MMBtu. Since then, the price corrected as it was around the $7 level on July 15. The last time natural gas futures were at this price in July was fourteen years ago in 2008.
We are in the heart of the summer, which is the peak cooling season. However, the test for the bullish price action in natural gas will come in October 2022 through February 2023, when the peak heating season arrives.
Meanwhile, US natural gas has become a far more international market over the past years, as US LNG travels the world on ocean vessels to locations where prices are much higher. The war in Russia creates natural gas shortages in Western Europe.
The chart shows that UK natural gas never traded above the 2005 117 high until 2021. At the 200.290 level at the end of last week, the price was nearly double the previous record high after rising to the 800 level in March 2022.
The US will struggle to fill Europe’s natural gas void created by Russian retaliation.
As of the week ending on July 8, US natural gas inventories stood at 9.6% below the previous year’s level and 11.9% under the five-year average. US energy policy has weighed on natural gas output at a time when Europe is looking to the US to fill the gap created by the war in Ukraine. Natural gas shortages are likely in Europe this coming winter season.
Follow those trends until they bend
The short-term trend in crude oil has turned bearish, with the prices on either side of the $100 per barrel level. I expect lots of two-way price action in the oil and gas markets over the coming weeks and months. While natural gas remains a bucking bronco with wide price swings, crude oil is now in a bearish correction.
Follow those trends until they bend as they are the best barometers of the path of least resistance of prices. Trends reflect the market’s sentiment. When sellers are more aggressive than buyers, prices move lower. When buyers dominate sellers, they move to the upside. As of Friday, July 15, the sellers were in the driver’s seat in the oil market. Time will tell how long they remain in control and how low they will push the price of the world’s leading energy commodity.
--
Trading advice given in this communication, if any, is based on information taken from trades and statistical services and other sources that we believe are reliable. The author does not guarantee that such information is accurate or complete and it should not be relied upon as such. Trading advice reflects the author’s good faith judgment at a specific time and is subject to change without notice. There is no guarantee that the advice the author provides will result in profitable trades. There is risk of loss in all futures and options trading. Any investment involves substantial risks, including, but not limited to, pricing volatility , inadequate liquidity, and the potential complete loss of principal. This article does not in any way constitute an offer or solicitation of an offer to buy or sell any investment, security, or commodity discussed herein, or any security in any jurisdiction in which such an offer would be unlawful under the securities laws of such jurisdiction.

EURUSD 22' Medium Forecast (Fibonacci Analysis) I predict EU will fall due to USD strength on/near June 14-15 (FOMC) meeting. Then, the Euro will strengthen on the wake/post ECB meeting at the end of July (26).

The Euro Is Heading for Parity Against the DollarThe US dollar and the euro are the world’s reserve currencies. Political and economic stability and free convertibility are the requirements for reserve currency status. Central banks and governments worldwide gold the US and European currencies as reserve assets.
The exchange rate between the US dollar and the euro is multifactorial. Interest rate differentials, political trends, and other issues determine the value of each foreign exchange instrument versus the other. The euro has been around since January 1, 1999, and euro notes and coins were only available two decades ago, in 2002. The euro currency opened for trading in the futures market in April 2001 at an exchange rate of $0.8760 versus the US dollar.
The euro first rose above parity with the US currency in July 2002. The last time it was below was in December 2002, but the recent exchange rate price action and the factors determining currency values could send the euro back to levels not seen in two decades.
New highs in the dollar index- Approaching the test of the 2020 high
The US dollar index has a 57.6% exposure to the euro currency. Since January 2021, the dollar index has been on a bullish path, making higher lows and higher highs.
As the chart highlights, the dollar index futures contract moved from a low of 89.165 in early January 2021 to the most recent high of 103.950 on April 28, 2022, a 16.6% rise. The index is approaching a critical technical resistance level.
The long-term chart shows the upside target stands at the March 2020 103.960 high, the highest level for the index since 2022. A break above that level will make the next upside target the July 2001 121.290 high. A move towards that level would push the euro below parity against the US dollar for the first time in two decades.
Lower lows in the euro versus the US dollar foreign exchange relationship
A bearish trend in the euro versus the US dollar currency relationship is nothing new.
The chart shows the euro reached an all-time high against the dollar in July 2008 at $1.6038. Since then, it has been all downhill for the European currency. The euro reached a low of $1.03405 in January 2017. After a recovery took the euro to above the $1.25 level in February 2018, the downtrend resumed, and it was approaching the early 2017 low on April 29 at below the $1.075272 level. A move below the $1.03405 level makes the target the critical psychological parity level.
Herding cats- The European economic challenge
The European Union is a collection of countries with diverse cultures. Moreover, economic policy is a blend of different orientations to monetary and fiscal policies.
Southern Europe has depended on tourism and has had a far looser approach to economic management than the austerity of the north. The north has been the industrial powerhouse, providing financial stability for the Union.
Greece, Italy, Spain, and Portugal are far different economies than Germany, France, the Netherlands, and Belgium. Policy agreement between the Union members has been like herding feral cats over the past two decades. The north has bailed out the south routinely, causing stress on relationships within the Union and pressure on the euro currency.
Cultural differences have been the borders since the establishment of the European Union and continue to be a factor that impacts the euro’s value.
War on the border- An aggressive Russia is bad news for the euro
In early 2022, the European Union is facing its most challenging test since its birth. Russia’s invasion of Ukraine launched the first major war in Europe since WW II. Russian aggression is a challenge to NATO countries, particularly those bordering the former Soviet Empire. Over the coming years, European military budgets will need to dramatically increase to provide safety and deterrence against the Russian aggressor. As military spending rises, it is likely to pressure the euro currency as the Union faces new threats that transcend the costs of the cultural divide between the northern and southern countries. The threat will likely unify the north and south, but the price tag for unification will be staggering.
Rising US rates are another nail in the euro’s coffin- Parity is only the first stop – The trend is your friend
In currencies, exchange rates are highly sensitive to interest rate differentials. The US dollar and euro are the world’s reserve currencies. The US central bank has shifted its monetary policy path to a more hawkish approach with inflation. raging.
The March consumer and producer price indices rose by 8.5% and 11.2%, respectively. The US Fed ended its quantitative easing in March 2022 and will quickly shift to quantitative tightening, allowing debt securities to roll off its swollen balance sheet at maturities. The FOMC will increase the short-term Fed Funds rate by at least 50 basis points at this week’s May 4 meeting. US short-term interest rates are going nowhere but higher.
Meanwhile, the US 30-Year Treasury bond futures have been a falling knife, pushing interest rates higher further out along the yield curve.
The chart shows the decline in the long bond futures since the March 2020 high. The most recent 138-14 low on April 20, 2021, took the bellwether government bond futures to the lowest level since November 2018. Critical technical support stands at the October 2018 136-16 low. Below there, the next target is the 2013 127-23 low.
A falling bond market and higher interest rates make the dollar more attractive than the euro. Europe cannot afford to increase interest rates and keep pace with the US dollar interest hikes because of its economic and geopolitical landscapes. Therefore, the dollar’s bullish trend will likely continue over the coming weeks and months.
Bull and bear markets rarely move in straight lines. Currency markets tend to experience far lower volatility than stocks, bonds, commodities, and other asset classes as governments manage price moves with intervention to provide stability. However, technical and fundamental factors support the path to parity for the dollar and euro currencies. In 2000, the euro reached $0.8901 against the dollar, the long-term technical target.
A stronger dollar and weak euro will have significant ramifications for markets across all asset classes, but the currency markets are a mirage as they trade in a vacuum. A trip to the supermarket, gas pump, or purchasing any goods or services in dollars reveals that the US currency has lost substantial purchasing power over the past year. The dollar may be strong against the euro, and it looks set to continue the current path, but all fiat currencies are losing power. As one strategist said the dollar is “the cleanest shirt in the dirty laundry.”
--
Trading advice given in this communication, if any, is based on information taken from trades and statistical services and other sources that we believe are reliable. The author does not guarantee that such information is accurate or complete and it should not be relied upon as such. Trading advice reflects the author’s good faith judgment at a specific time and is subject to change without notice. There is no guarantee that the advice the author provides will result in profitable trades. There is risk of loss in all futures and options trading. Any investment involves substantial risks, including, but not limited to, pricing volatility , inadequate liquidity, and the potential complete loss of principal. This article does not in any way constitute an offer or solicitation of an offer to buy or sell any investment, security, or commodity discussed herein, or any security in any jurisdiction in which such an offer would be unlawful under the securities laws of such jurisdiction.
