US01MY : An important chartThis chart is actually quite important. I take a look at it all the time.
It would be quite interesting when it starts to fall, ever so slightly at first, just below the EFFR.
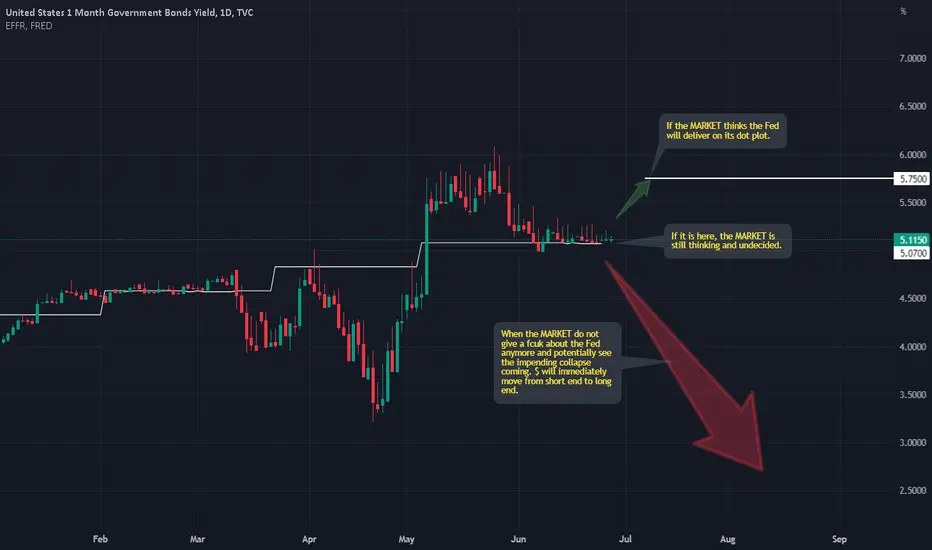
We also need to understand which arrow is the BIGGER one. The green or the RED. This can easily answer which is the bigger

Navigating The American Debt Ceiling DramaSome people create their own storms. And then get upset when it starts to rain. US Debt Ceiling drama is akin to a soap opera that never ends.
Debt ceiling issue is not new. Why bother now? Political polarisation in the US has got to unprecedented levels. The showmanship could tip over into a polit

30day tbill above 5.5% next target 6 % as the forecast So this is the only place that is safe . As the cycles move from inflationary to deflationary

US01M - U.S. 1 Month Treasury - Long IdeaUS01M - U.S. 1 Month Treasury Bonds
Long Idea, With Potential Upside Targets On Chart.
Enjoy!
(If this plays out, expect Equities and Crypto to get rekt'ed in the next 2-3 weeks.)

How to improve your trading by looking at interest rates: Part 4Hey everyone! 👋
This month, we wanted to explore the topic of interest rates; what they are, why they are important, and how you can use interest rate information in your trading. This is a topic that new traders typically gloss over when starting out, so we hope this is a helpful and actionable se

US Treasury yield curve with Fed Funds and RRP rateNo prediction. This is a study of the US Treasury yield curve in relation to the Fed Funds and RRP rate.

All the Treasury Yields Together (2002 - Present)US10Y - US02Y , "Ten minus two" yield curve is what everyone talks about but I think if you look at all the yields together it's a much clearer story.
Only have data going back to 2002 :(
Light Gray Areas Indicate Recessions
PS there are a few uncommonly used government yields that I've hidden to m

All the Treasury Yield Curves going back to 2002US10Y - US02Y, "Ten minus two" yield curve is what everyone talks about but I think if you look at all the yield curves together it's a much clearer story.
Only have data going back to 2002 :(
Light Gray Areas Indicate Recessions
PS there are a few uncommonly used government yields that I've hidden


See all ideas
A graphical representation of the interest rates on debt for a range of maturities.
Frequently Asked Questions
The current yield rate is 4.601% — it's decreased by −1.71% over the past week.
The current yield of United States 1 Month Government Bonds is 4.601%, whereas at the moment of issuance it was 1.761%, which means 161.27% change. Over the week the yield has decrased by −1.71%, the month performance has showed a −4.19% decrease, and it has fallen by −14.64% over the year.
Maturity date is when a debt comes due and all principal and/or interest must be repaid to creditors. For example, the United States 1 Month Government Bonds maturity date is Dec 10, 2024.
You can buy United States 1 Month Government Bonds through brokers — choose the one that suits your needs and go ahead. You can also purchase bonds directly from the issuing organization. Closely track the price dynamics and market news before making any decision.
A bond is a debt security issued by a corporation or a government. By buying bonds, investors loan the issuer money in return for an interest rate. By issuing bonds, the state receives funds that can then be injected into the economy, and corporations raise funds for new research or other operational activities. The alphanumeric code of government bonds represents the abbreviated name of the issuing state, as well as its time to maturity. For example, United States 1 Month Government Bonds is the US government bonds with the maturity of 1 month.
Bonds can be of various maturities, e.g. short-term (less than three years), medium-term (four to 10 years), or long-term ones (more than 10 years). So United States 1 Month Government Bonds are short-term bonds — they have the maturity of 1 month.