POPCATUSDT - Descending Trendline, Breakout or Another Breakdown📊 Technical Analysis
💵 Coin: $POPCAT #POPCAT
⏳ Time Frame: 3D
📉 Pattern: Descending Trendline
🎯 Bias: Waiting for Breakout Confirmation
---
📌 Pattern Overview – Descending Trendline
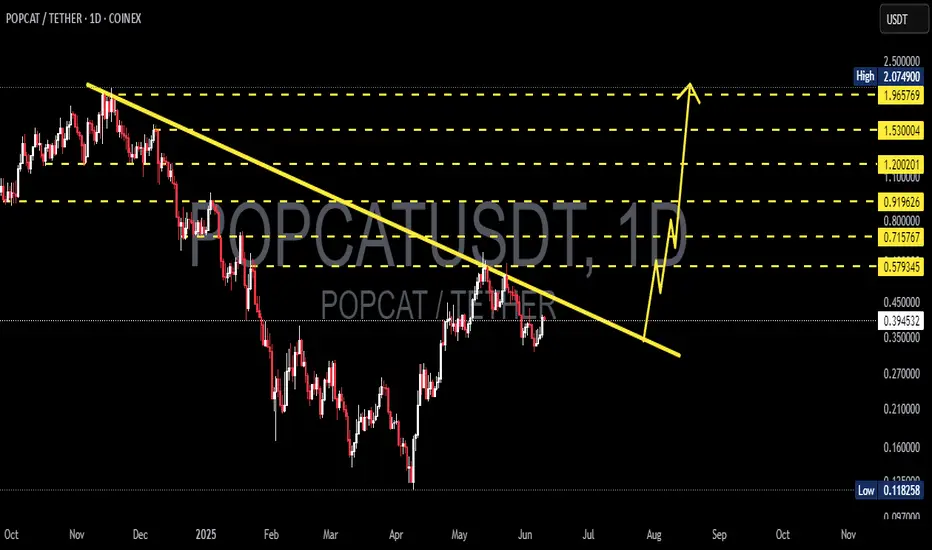
🔻 POPCAT is still trading below a long-term Descending Trendline, which has acted as strong resistance for several months. This trendline indicates that sellers remain in control, with every rally continuing to face selling pressure.
⚠️ Price is now approaching the apex of the trendline, a zone that often lea
POPCATUSDT
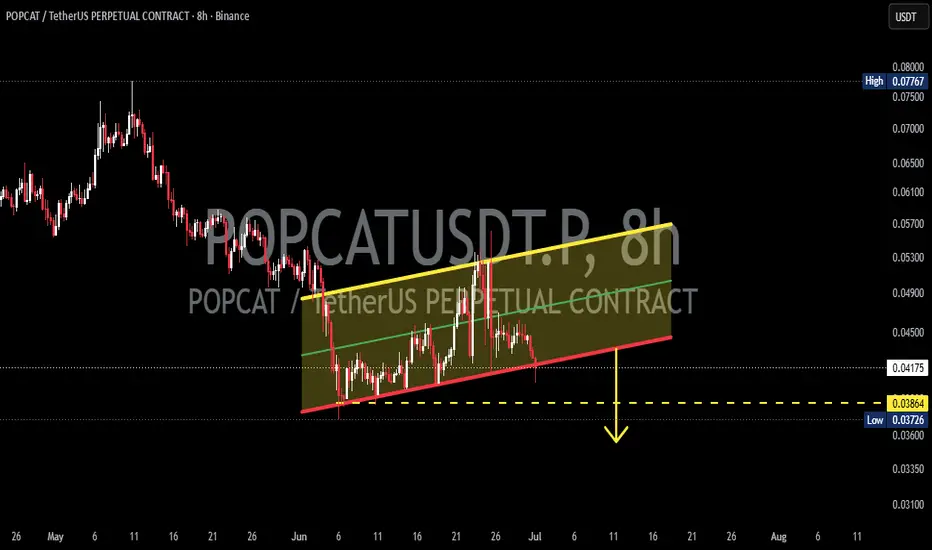
POPCATUSDT - Bear Flag, Major Breakdown or Strong Rebound?On the 8H timeframe, POPCATUSDT remains in an overall bearish trend. After experiencing a sharp decline (Flagpole), the price has been moving gradually higher, forming a Bear Flag—a classic bearish continuation pattern developing inside an ascending parallel channel. 📉
At the moment, the price has returned to test the lower trendline of the channel. This area represents a critical decision zone that will determine whether the Bear Flag confirms or fails. ⚠️
As long as the price remains below t
POPCAT/USDT — Massive Breakout Loading?On this 3D timeframe chart, POPCAT appears to be recovering after experiencing a long-term downtrend from its previous peak levels. 📉➡️📈
Interestingly, price is now approaching a major descending trendline resistance that has been suppressing bullish momentum for several months. ⚠️🟡
This yellow descending trendline is the key level that could determine the next major market direction. If a breakout happens with strong volume confirmation, the potential for a medium-to-long-term trend reversal
POPCATUSDT: Symmetrical Triangle formation — Reversal Incoming?POPCAT is currently forming a symmetrical triangle on the 4H timeframe after a prolonged downtrend, indicating a phase of price compression and equilibrium between buyers and sellers.
Key points:
- Converging trendlines forming a clear symmetrical triangle
- Price making higher lows and lower highs, signaling tightening volatility
- Structure forming after a strong downtrend (potential accumulation zone)
- Price interacting with key value area on the volume profile
Trade idea:
- Bullish
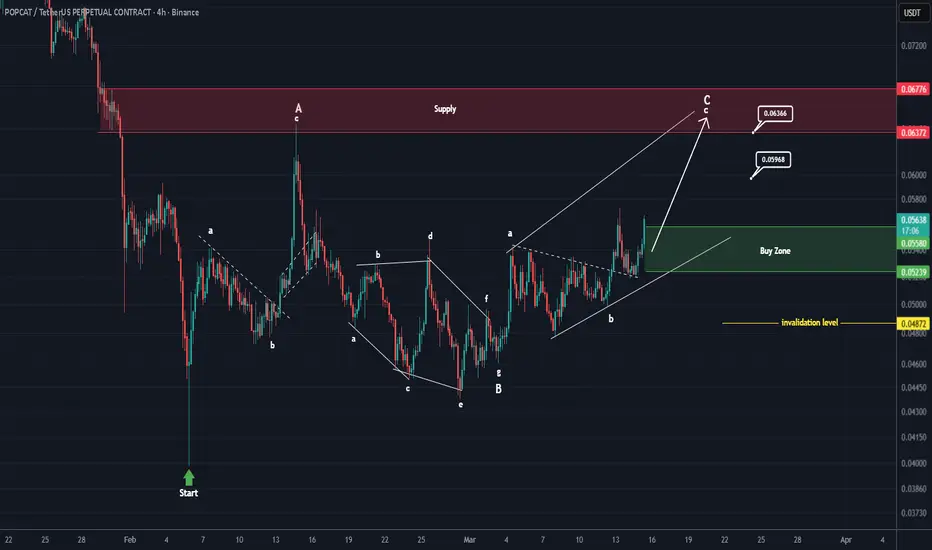
POPCAT is one of the bullish meme coins (4H)One of the bullish meme coins these days is POPCAT. It seems whales are paying special attention to this meme coin.
From the point where we placed the green arrow on the chart, POPCAT has entered a bullish phase. Waves A and B are complete, with Wave A forming a zigzag and Wave B forming a diamond-shaped diagonal (diamentric).
Wave C appears to be either a zigzag or an expanding pattern, and we are currently in the third part of Wave C, which is a bullish wave.
During pullbacks, we try to ent
POPCAT/USDT Setup IdeaCurrent Market View
Price appears to be attempting a breakout of the channel into a new upward trend channel (marked in white/grey).
On the hourly chart, momentum oscillators (RSI, MACD) show early signs of shift: RSI is climbing from oversold/neutral area; MACD lines are converging.
The 4-hour and daily charts suggest the downtrend is still in place, but the breakout attempt may signal a reversal if sustained.
Proposed Entry & Exit Levels
Entry Zone (Buy Setup)
Entry: around $0.102 – $
POPCAT/USDT — Descending Triangle: Ready for a Major Move?1. Current Market Condition
POPCAT/USDT is sitting at a very critical level. After a prolonged downtrend since late 2024, the price has formed a clear descending triangle, with consistent lower highs pressing from above while the 0.22–0.30 support zone continues to act as a strong demand area.
This setup signals compressed volatility — price is being squeezed toward the apex of the triangle, usually leading to a significant breakout in either direction.
---
2. Key Technical Levels
Major Su
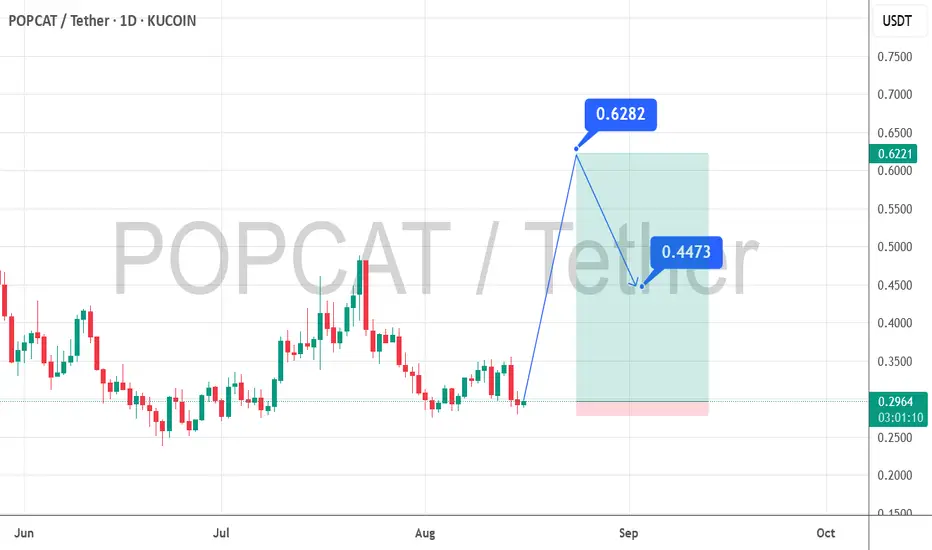
POPCATUSDT 100% Gains? After a period of consolidation, POPCAT is beginning to show signs of a bullish reversal. Indicators such as MACD and RSI are turning positive, and trading volume is on the rise — a classic setup for a breakout. If the price successfully breaks above the key resistance at $0.38, the next target could be around $0.63, representing a potential 100% gain from current levels.
Recent candlestick patterns also suggest strong buying pressure on the 4-hour and daily timeframes. With confirmation above r
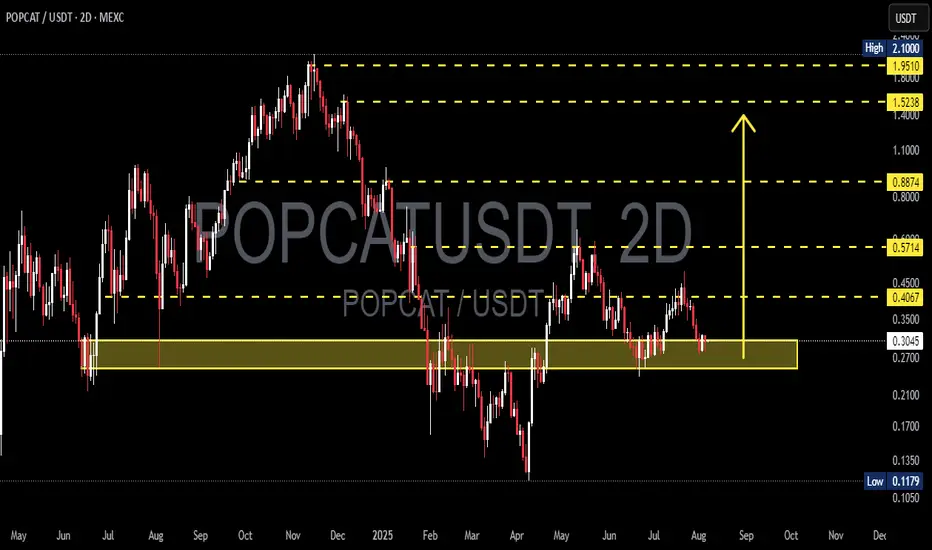
POPCAT/USDT – Testing Demand Zone: Reversal or Breakdown?POPCAT/USDT is currently retesting one of the most crucial demand zones in its mid-term price structure, located between $0.2700 – $0.3037. This area has historically acted as a strong support level and has triggered significant rebounds in the past. The market's reaction here will be key in determining whether POPCAT is ready for a bullish reversal or heading for a deeper correction.
---
🔍 Market Structure & Price Action
The price has entered a sideways consolidation phase after a steady dec
POPCATUSDT – Breakout Confirmation or False Signal?On the daily chart of POPCATUSDT, the price has recently broken out of a descending trendline that has been acting as resistance since December 2024. This breakout signals a potential trend reversal from bearish to bullish.
Currently, the price is in a retest phase, revisiting the breakout zone, which also aligns with a strong support and Fibonacci retracement area:
Support zone: $0.34 – $0.38
Fibonacci 0.618: $0.3490 (major technical support)
Fibonacci 0.5: $0.3759 (typical retest level aft
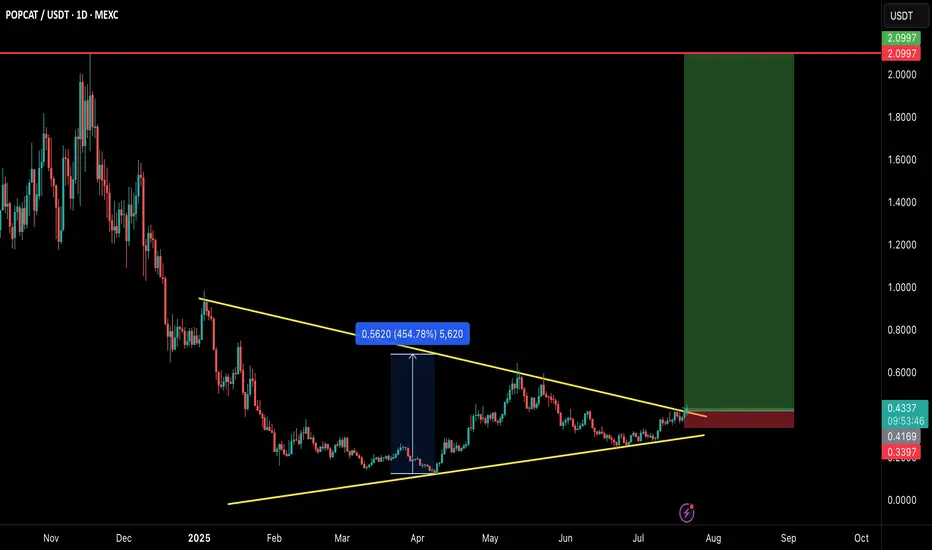
POPCAT/USDT – MEGA BREAKOUT INCOMING!POPCAT is breaking out of a large symmetrical triangle structure that has been developing for several months. This is a textbook bullish reversal setup with explosive potential — and the chart says it all! 👇
🧠 Technical Breakdown:
✅ Clean symmetrical triangle breakout on daily timeframe
🔥 Strong base formation followed by volume breakout
💹 Consolidated above trendline for weeks — breakout looks real
🛒 Entry Zone:
CMP ($0.43) or buy in dips toward $0.40–$0.42
🎯 Targets:
TP1: $0.65
TP2: $1.10
T
$POPCAT - Chance of Seeing $1 in Q3
Haven’t posted much about Solana coins lately, but they’re starting to show signs of life again.
$POPCAT had a clear entry right at the weekly FVG below 33c. From here, it either retests the Monthly Open or begins a slow grind higher.
It performed exceptionally well last year, so there’s a good chance to offload some around the $1 mark if momentum picks up. BYBIT:POPCATUSDT
POPCAT/USDT — Major Reversal in Play? Strong Bounce
📌 Quick Summary:
Altcoins are starting to show signs of life, and POPCAT/USDT is now sitting at a critical price structure. After a long and painful downtrend since November 2024, the price is consolidating near a powerful support zone — potentially signaling the start of a reversal phase. Is this the calm before a major breakout? Let’s dive into the technical setup.
🔍 Pattern & Market Structure:
🟨 Descending Triangle Pattern – with Signs of Accumulation:
A clear descending triangle has fo
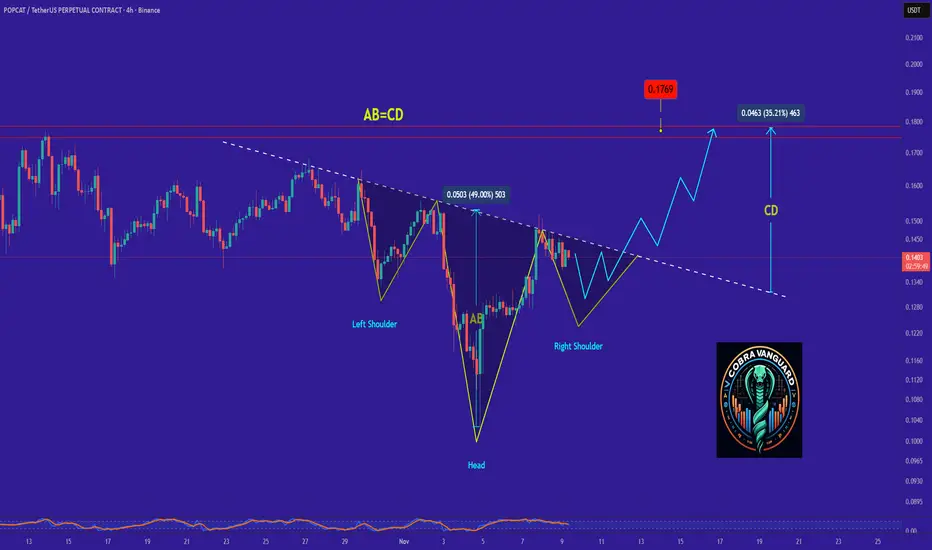
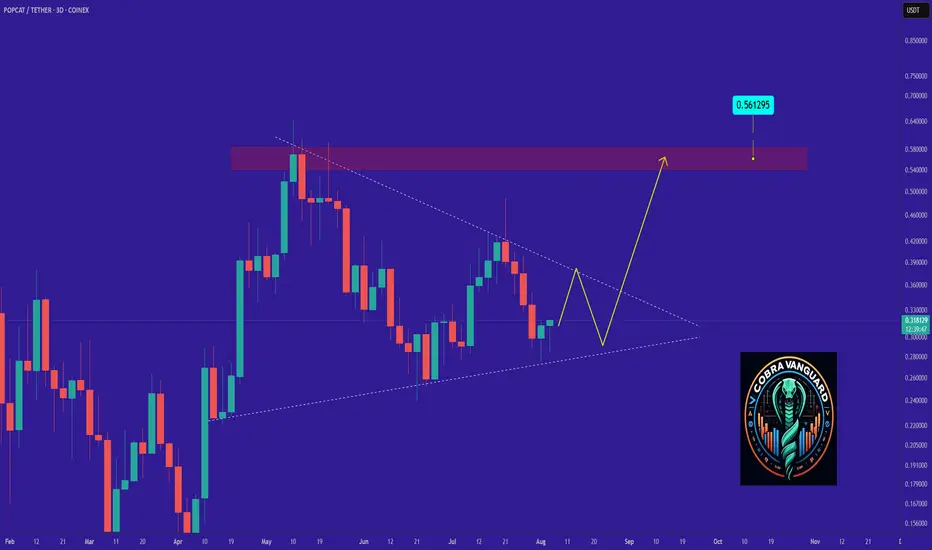
POPCAT It will grow soon...The price has formed a Triangle on the 4h time frame, and if it breaks out, it can drive the price up to around $0.65.
Give me some energy !!
✨We spend hours finding potential opportunities and writing useful ideas, we would be happy if you support us.
Best regards CobraVanguard.💚
_ _ _ _ __ _ _ _ _ _ _ _ _ _ _ _ _ _ _ _ _ _ _ _ _ _ _ _ _ _ _ _
✅Thank you, and for more ideas, hit ❤️Like❤️ and 🌟Follow🌟!
⚠️Things can change...
The markets are always changing and even with all these signals, the
POPCATUSDT: The Meme Coin Ready to Pounce!
📊 Live Market Snapshot (May 12, 2025)
- Current Price: $0.62(+18.40% today!)
- Volume: $30.56M (Massive interest!)
- Key Levels:
- Support: $0.52 (Today's low)
- Resistance: $0.80 (Next psychological level)
- All-Time High: $1.40
💎 Why POPCAT is Trending
1. Explosive Growth: Up 18% in single day
2. Meme Coin Rally: Leading the meme sector
3. Technical Breakout: Cleared key resistance at $0.60
🎯 Trading Strategy
- Entry Zones:
- Aggressive: Current price ($0.55
$POPCAT - Market Outlook BYBIT:POPCATUSDT | 1d
I'm noticing a potential weakening in dominance, which could pave the way for altcoins to rally toward their nearest inflection points if the trend continues.
For $POPCAT, I project an upward move to the $0.64–$0.76 resistance zone, where a price reaction is anticipated.
If the $0.30–$0.40 range is defended as support or undergoes a bullish retest with confirmation, I expect a breakout above $1 upon a subsequent challenge of this level.
Immediate support: $0.45 to $0.4
POPCAT Breakout Alert – Fresh Rally Incoming?🚀 POPCAT Breakout Alert – 60% Potential Incoming?! 👀🔥
Hey Traders! If you're all about high-conviction plays and real alpha, smash that 👍 and tap Follow for more setups that actually deliver! 💹💯
POPCAT has just broken out cleanly from its ascending triangle pattern on the 4H timeframe 🔥. This follows a strong consolidation phase after its last explosive move of 61% gains—and it’s looking primed for a fresh leg up! 📈
Key Levels:
💥 Entry: $0.416 and add more in dip
🎯 Targets:
1️⃣ $0.48
2️⃣ $0