The first PRZ worked as wellaccording to my last analysis about FTM, the first PRZ worked as well.
I bought some FTM for holding.
Potentialreversalzone

DXY will fall from Potential Reversal zone ?DXY will fall from Potential Reversal zone ?
#DXY (Dollar Index): Important Decision Ahead
Many dollar pairs are standing on key levels today.
With a coming CPI report, the market participants
are waiting for the trigger to either push the Greenback higher
or to finally start shorting it.
⚠️DXY is testing a historical resistance at the moment. Bearish movement will initiate only fasle bull breakout of Potential Reversal zone.
That will be a decent confirmation. target will be 92.5 firstly
For bullish scenario, consider a daily candle close above the underlined daily resistance
as the confirmation for a further bullish continuation.

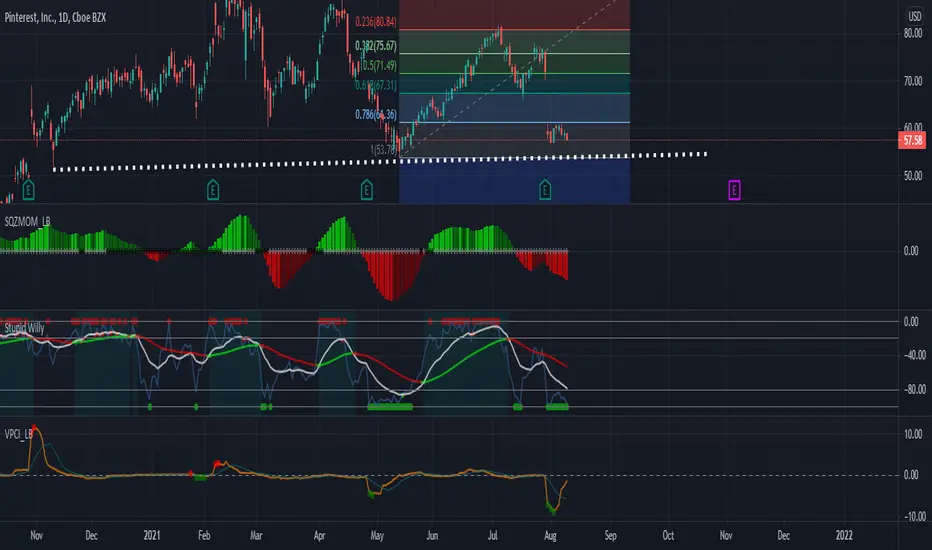
PINS Potential Dip BuyPINS recently has shown the first indication of a reversal at its historical support which was by the VPCI indicator. Although I think this is a great entry, I want greater confirmation from the Squeeze indictor(a reduction in selling momentum) because without this confirmation it may potentially break below support. If PINS bounces off of support following bullish signs regarding the momentum then it allows for a great swing. Keep in mind that PINS gapped down which usually lead towards a new form of support, but it is always best to wait for confirmation.
Bullish Signals
-VPCI
-Near historical support
Still Bullish on CAT(Update)I think it is a great time to purchase CAT. CAT has retraced to the 0.38 Fib support and has held that support for a pretty good amount of time. Due to this extended period of low volatility, we can assume that a big play is about to occur. I also observed that the squeeze indicator for the weekly is signifying that of low volatility(grey crosses) which adds onto our analysis. Not only are we resting at support but we have gotten buy indications by the Oscillator. My price target for this is a squeeze to 238.
Bullish Signals
-Fibonacci Support
-Squeeze indicator
-Oscillator
Price Target
-238

we wait for BTC ( Bitcoin) bear break out and sellBTCUSD is approaching a major daily resistance cluster.
40,000 - 42,000 is a potential reversal zone.
To catch a swing move from that,
wait for a bearish breakout from the channel is formed on 4H.
We need at least a 4H candle close below its support to confirm a breakout.
Goals will be target 1: 36kx and target 2: 30kx.

NATURAL GAS Weekly Bearish Pattern Greetings Folks,
NATURAL GAS has made a very strong bull run in the past few months, the current price is forming an AB=CD pattern (Bearish) on this Weekly Chart.
Of Course, we have to say that the price might go higher.
However, we need to take note that it is a strong opportunity to sell (PRZ)
Watch out for rejection at this level to finding good risk-reward for trend reversal entries as well.
All the details are on the chart.
Have a nice week. Good Luck.!!


Week 6: ZSH2021 Price is in the sell areaFollowing up last week analysis, the price will be visiting Supply area prior going down.
My personal Sell Order will be at $1,417 (it depends on the price action in the next 2-3 H4 candles, I may short it early too).
The stop loss will be at $1,438 (New Higher High) and our Take Profit will be quite low (at least $1,275).
The simple sign will be at $1,417 area, if the body size of the candles are not prominently bullish; and there is a formation of Lower High (LH); I will go at whole-nine-yard to short the market. Just kidding, money management is still important, perhaps 10% to 20% equity to short this opportunity.


USD Beginning to Shows Signs of Trend Change- Price was in a strong downtrend since the start of November to beginning of January
- New year came along, Dollar has been consolidating/accumulating just slightly higher than the lows of the downtrend.
- Bears have made multiple attempts at breaking the lows of the range but have not succeeded thus far.
- If we do bounce from the bottom again, pay attention the midrange as it's tending to have strong downward pressure at that level.
During natural market movement, we will always see price ebb and flow. Even if price seems to be trending for a long time, there will be a period of time where that trend will end and price will revert to fair value before continuing the trend move or reversing completely. To spot this we look for exhaustion. This will usually be signalled by a break of the trend. Price will, more times than not, begin to accumulate, especially if it has trended for a significant period of time. There will however be instances where price will just create a new high outside of the trend, retrace back and then continue making new higher highs and higher lows. In this example we see a very nice period of consolidation/accumulation. During this phase we are simply just ranging, we will be looking for longs at the bottom and shorts at the top until we actually do break out to either side. Bias is to break the upside but we will prepare for either.

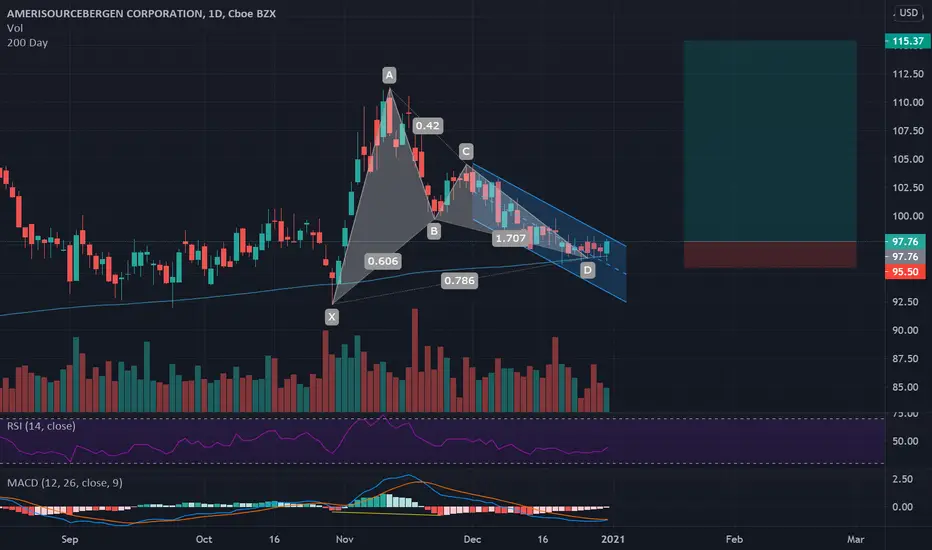
$ABC Descending Channel and GartleyBuilding for a breakout of a descending channel, at the 200 MA, Hidden Bullish Divergence Daily MACD, and a Gartley Pattern reversing almost exactly at .786. Target is the same distance of X-A added to the entry of the .786.
Entry at Current Price: $97.76
Stop: $95.50 (below most recent low and 200MA)
End Price Target: $115.30
Vodafone ( UK ) Potential Area of Demand 28 October 2020Vodafone ( UK )
Potential Area of Demand
28 October 2020
LSE:VOD

Tesco PLC. UK Groceries & General Retailer. 02 October 202002 October 2020
Tesco PLC. Price Could be Approaching
Potential Weekly Area of Demand.
One to Watch, For Long Bias.
Tesco PLC, is a British
Multinational groceries
and general merchandise retailer.
LSE:TSCO

Vistry Group PLC ( UK ) Potential Area of Demand 28 October 2020Vistry Group PLC ( UK )
Potential Area of Demand
28 October 2020.
The First Demand Level was tested in 2016.
The Second Potential Demand Level is a Fresh Level
Probably a better level.
LSE:VTY

GBP/CAD Potential BuyPrice has previously shown this to be a relevant zone giving strong impulses to the upside.

Are We finally ending Minor Wave 1 TodayThe data has been all over the place with the volatility.
Are we in Intermediate wave 5? I think so
Are we in Minor wave 2? I thought so, but the wave cycles were not clean.
Are we in Minor wave 1? This is my thought today.
If we really are in Minor wave 1, I assess we are at the end of it. The shock drop the other day on President Trump's tweet would make for a Minuette 4 instead of any larger wave. I assess this to be the case because it was took sharp and quick to have been a larger wave. With that said I am projecting the potential end of Minor wave 1 this morning. I have indicating the rough timeframe with the vertical dashed white line.
I have placed 4 potential reversal levels and the reasoning behind each level. The top level was an original top, but I do not see a solid reason for this to be the resistance as of now.
Sit back and enjoy. Projecting drop today through tomorrow?

Bullish Bat & Alternate ABCD PatternA Bullish Bat usually consists of an extended ABCD Pattern.
Both 4-point & 5-point patterns provides a Potential Reversal Zone, which maybe tested completely & trend may reverse.
SL below PRZ.

XRP/USD potential longXRP has taken a beating like a lot of the other Alt’s. The major difference for me is that XRP is currently at a major support and the others have blown through theirs. If XRP can find a way to close above the .235 area, I think it can make another run to the top of the descending triangle. My target would be .30. Good luck!

NZDUSD [Potential Short Setup]Potential short opportunity:
1. If it break the trendline
2. If provide a retest form a lower high
3. Possible short when price reject in that area.
Most of the USD pair has already moved, NZDUSD hasn't yet make the move. Will it follow others?

bitcoin - 4h - head and shoulder possibility - 2020/09/01bitcoin is in a very critical area it can form a potential head and shoulder on 4h time frame. for confirmation we should wait for reaction to resistance line and and then break of neck line.


CADJPY waiting for the sell setup to formon DAILY: CADJPY is approaching a strong resistance zone in green so we will be looking for objective sell setups on lower timeframes
on H4: CADJPY is forming a channel in red but our lower red trendline is not valid yet so we are waiting for a third swing to form around it and then enter sell on its break downward.

With the recent EV stock craze. Long over 22.70 $NKLA $NIO $TSLAhot sector and under 20 mil free float!
