YM1! DOW JONES E-MINI FUTURES - THE POST-FED BLUEPRINTDecember 10, 2025 | by officialjackofalltrades
🟢 BULLISH | Fed's "Hawkish Cut" Creates Opportunity
EXECUTIVE SUMMARY - THE FED DECISION IS IN
Current Price: $47,913 | Date: December 10, 2025 - POST-FOMC
The Dow Jones E-mini futures just experienced a historic moment :
The Dow gained 497.46 points, or 1.1%, to close at 48,057.75 following the Federal Reserve's decision to lower rates by a quarter percentage point, putting it in a range between 3.5%-3.75%.
But here's what NOBODY is talking about: This was a "hawkish cut" with three "no" votes, which hasn't happened since September 2019. Yet the market RALLIED .
Why? Because the "hawkish" part was already priced in.
The Technical Setup:
Pattern: Ascending channel (intact since November)
Current Position: Testing mid-channel at 47,700-47,800
Resistance: 48,100-48,300 (upper channel boundary)
Support: 46,800-47,00 (mid-channel), 46,500-46,100 (lower channel)
Breakout Target: 48,000-48,500
The Fed Backdrop:
Powell said "We are well positioned to wait and see how the economy evolves"
Translation? The Fed is DONE cutting for now.
But here's the twist: Fed funds futures suggest around a 68% chance the central bank will cut rates two or more times in 2026. The market doesn't believe Powell!
The Trade: Long from 47,700-48,300, target 48,000+
🔎 MARKET CONTEXT - THE FED'S "HAWKISH CUT" PARADOX
What Just Happened (Last 6 Hours)
At 2:00 PM ET today, the Fed delivered exactly what was expected: 25-basis-point reduction from 3.75-4% to 3.50-3.75%.
But the details were hawkish:
Three dissenting votes (Cleveland Fed President Beth Hammack voted against, plus two others)
Dot plot indicated just one more cut in 2026 and another in 2027
Seven officials indicated they want NO cuts next year
Powell called it a "very challenging situation"
The Market's Response?
Dow jumped 497.46 points (+1.1%) to 48,057.75. Why rally on hawkish news?
Answer: Because the hawkish tone was already priced in from the pre-meeting leaks and October's dissenting votes. The market expected worse .
The Internal Fed War
Asked about the elevated level of dissenting members, Powell emphasized that everyone on the FOMC agrees that inflation is still too high, and that there are also risks to economic growth.
This Fed is more divided than any time in recent memory :
Hawks (7 members): Want ZERO cuts in 2026
Centrists (5 members): Want 1-2 cuts in 2026
Doves (7 members): Want 2-3 cuts in 2026
19 participants among the governors and regional presidents, 12 of whom vote.
This division means volatility , but also opportunity .
TECHNICAL ANALYSIS - THE ASCENDING CHANNEL AT DECISION POINT
The Pattern: Ascending Channel (Bullish Structure)
Your chart shows a textbook ascending channel that's been in play since early November 2025.
Channel Characteristics:
Lower Support: Started at 44,000 (early Nov) → 46,500 (mid-Nov) → 47,000
Current Position: Dow closed at 48,057.75, which is mid-channel perfect positioning for next leg up.
Technical Indicators:
Moving Averages:
50-day MA: ~46,800 (rising, bullish)
200-day MA: ~45,200 (rising, bullish)
Golden Cross: Active since mid-October = long-term bullish
Volume:
Dow jumped on Wednesday after Fed decision with significant volume, this confirms the breakout is real , not a fake pump.
RSI:
Current: ~58-62 (slightly bullish but not overbought)
Room to run to 70+ before overbought conditions
🎯 SCENARIO ANALYSIS - WHAT HAPPENS NEXT
BASE CASE: Grind Higher to 48,000+ - BULLISH
What Happens:
Dow consolidates 48,000-48,400 for 2-3 days
Then breaks above 48,600 with volume
Grinds higher toward 49,000-49,500
Powell's "wait and see" stance removes uncertainty
Holiday buying + year-end window dressing pushes higher
Timeline: 2-3 weeks (by end of December)
Expected Return: +3-4% from 48,000 to 49,500-50,000
Catalysts:
Continued corporate buybacks
Holiday retail strength
Year-end fund rebalancing (institutional buying)
No negative Fed surprises (Powell on "pause")
BULL CASE: Breakout to 50,500+ - VERY BULLISH
What Happens:
Market doesn't believe Powell - 68% chance of 2+ cuts in 2026
Strong economic data (retail sales, employment) supports growth
Dow breaks 49,500 with conviction
FOMO kicks in, target 50,500-51,000
Timeline: 3-4 weeks (by early January)
Expected Return: +5-6% from 48,000
Catalysts:
Q4 earnings beat expectations
Strong holiday retail numbers
Dovish Fed speakers in January
International capital flows into US equities
BEAR CASE : Channel Break to 46,500 - BEARISH
What Happens:
Economic data deteriorates (unemployment spikes)
Earnings disappoint in early Q4 reporting
Geopolitical shock (unlikely but possible)
Dow breaks below 47,400, tests 46,500-47,000
Timeline: 1-2 weeks
Expected Return: -3-4% from 48,000
This is LOW probability given Fed just cut and Powell said "well positioned to wait."
📊 FUNDAMENTAL ANALYSIS - WHY DOW OUTPERFORMS
CATALYST #1: The Fed's "Hawkish Cut" Was Actually Dovish
Let me explain the paradox:
Hawkish Elements:
Three dissenting votes
Dot plot shows only 1 cut in 2026
Powell says "wait and see"
But Dovish Reality:
They STILL cut rates (3rd in a row!)
GDP forecast raised to 2.5% for 2025 and 2.3% for 2026
Unemployment expectations unchanged at 4.5% for 2025
68% market probability of 2+ cuts in 2026 means market doesn't believe the hawkish talk
Net Effect: Lower rates NOW + no immediate threat of hikes = bullish for stocks .
CATALYST #2: Corporate Earnings Remain Strong
GE Vernova jumped 8% after saying 2025 revenue trending toward higher end of guidance and doubled quarterly dividend.
This is indicative of broader Dow strength:
Industrial companies benefiting from infrastructure spending
Dividend increases signal confidence
Guidance raises = earnings momentum
CATALYST #3: Small Caps Leading (Risk-On)
Russell 2000 jumped to new all-time highs as lower interest rates benefit smaller firms that need to refinance debt.
When small caps outperform, it's a risk-on signal . Dow industrials benefit from this environment.
CATALYST #4: Year-End Window Dressing
Fund managers underperformed in 2025. In December, they buy winners to make their portfolios look good for year-end reports.
Dow = full of winners like UnitedHealth, Goldman Sachs, Boeing (recovery story).
⚠️ RISK FACTORS - THE BEAR CASE
RISK #1: The Fed Is More Hawkish Than Market Believes
Seven officials indicated they want NO cuts next year
If the Fed actually holds rates at 3.5-3.75% all of 2026, stocks could stall or correct 5-8%.
RISK #2: Channel Break Below 47,000
If Dow closes below 47,000 on daily chart, the ascending channel is broken . Next support: 46,000-46,500 (-4-5%).
RISK #3: Economic Data Deteriorates
Unemployment at 4.5% is manageable, but rising. If it spikes to 5%+, recession fears return.
RISK #4: Geopolitical Shock
US Coast Guard seized sanctioned crude tanker off Venezuela. Tensions with Venezuela/Russia could spike oil prices, hurting economy.
Entry Confirmation Checklist:
Before entering, CHECK:
✅ Price holding above 47,800 (support intact)
✅ Volume on bounce (>50K contracts on daily)
✅ No negative Fed speakers this week
✅ S&P 500 also bouncing (correlation check)
✅ VIX declining below 15 (fear subsiding)
✅ Treasury yields stable or declining
WAIT FOR 4/6 CONFIRMATIONS
THE BOTTOM LINE
Here's what I KNOW on December 10, 2025 (POST-FED):
✅ Dow rallied +497 points (+1.1%) post-Fed to 48,057
✅ Fed cut 25bps as expected to 3.5-3.75%
✅ Powell says "well positioned to wait and see"
✅ Market pricing 68% chance of 2+ cuts in 2026
✅ Ascending channel intact since November
✅ Your technical analysis shows clear support/resistance
Here's what I DON'T know:
Will economic data support more cuts?
Will earnings season (Jan) beat or miss?
Will geopolitical risks escalate?
📍 Follow officialjackofalltrades for post-FOMC analysis, institutional setups, and professional risk management.
Drop a 📊 if you're trading the post-Fed bounce.
Drop a 🎯 if this helped your YM1! setup.
Drop a 💰 if you're ready for 50K Dow.
Powell

SHORT ON US30Us30 has created a head and shoulder pattern at a major supply area/zone.
FOMC is coming out in a few minutes and this could be a major catalyst to US30 falling.
Strictly going off technical's with the chart. Looking to make 1k-2k points.

Hawkish Fed Tone Caps EURUSD Near 1.1580!!Hey Traders, in today’s trading session we’re monitoring EURUSD for a potential selling opportunity around the 1.15800 zone.
The pair remains in a downtrend, and the current correction phase is bringing price back toward the 1.15800 resistance area, aligning with the broader bearish structure.
On the fundamental side, the recent U.S.–China deal combined with Powell’s hawkish tone has reduced the odds of a December rate cut — a setup that continues to favor USD strength and weigh on EURUSD.
Watching for rejection signs near 1.15800 for possible continuation to the downside.
Trade safe,
Joe.

GOLD | Daily Analysis #1 - 29 October 2025Hello and welcome back to DP
Today we’re excited to launch our Gold daily analysis series. We hope this new addition provides useful and practical insights for your trading decisions. Please support us with your follows and reactions — it really helps us grow!
Market Review:
After a strong bullish run over the past 2–3 weeks, gold finally started to correct from October 20, 2025, continuing its decline up until yesterday.
On the daily timeframe, we’ve identified:
• Support: 3,897
• Resistance: 4,155
Today’s trading session is particularly important as the Federal Reserve’s interest rate decision is due.
According to CME FedWatch, there’s about a 95% probability that the Fed will cut rates by 25 basis points.
Until the announcement, we may see choppy and sideways movement, but once the decision is released, expect a surge in volume and sharp “kangaroo” moves in both directions as traders react to the news.
1H–4H Technical Analysis:
As seen on the chart, 3,897 and 4,155 remain our key daily support and resistance zones.
• If price breaks above 4,012 and confirms the breakout, gold may extend higher toward 4,083 as the first upside target.
• On the other hand, if price drops below 3,974, it may continue falling toward the 3,897 support zone.
With the Fed’s rate decision approaching, expect increased volatility.
Whichever direction price confirms after the announcement could set the tone for gold’s next major move.
Trade cautiously, keep your stop-loss tight, and avoid chasing price during the initial volatility spike.
Disclaimer:
This content is for informational purposes only and does not constitute financial or investment advice. © DIBAPRISM
Amir D.Kohn

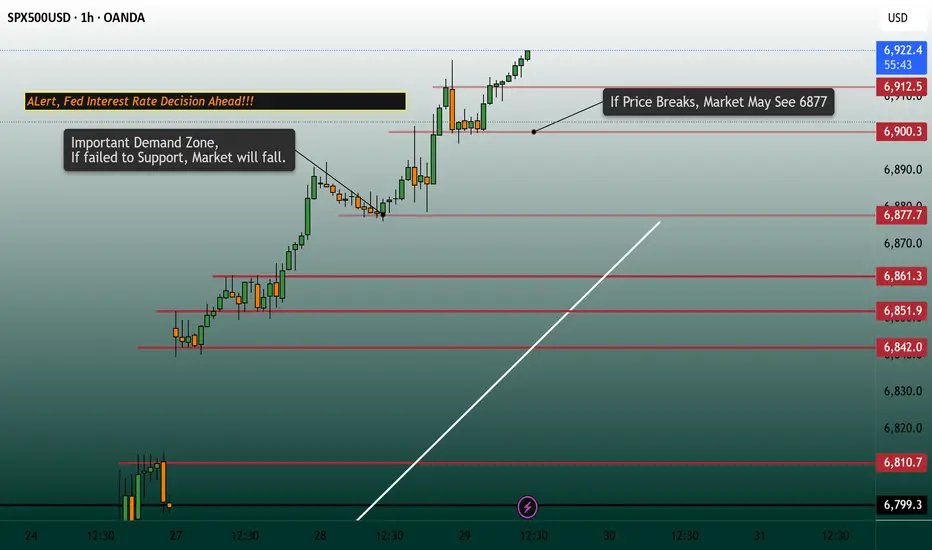
SPX | Daily Analysis #8 - 29 October 2025Hello and welcome back to DP
Market Review:
Over the past two days, as mentioned in our #7 analysis, “a sustained move above 6,860 may signal further bullish momentum toward the upside.”
This scenario played out as expected, with price reaching the 6,900 area for the first time. However, short sellers are now stepping in, attempting to fade the rally and fill the gap.
Currently, all eyes are on the upcoming Federal Reserve interest rate decision and Chairman Powell’s comments. Both China and the U.S. have remained relatively quiet, keeping market attention focused on monetary policy.
Meanwhile, President Trump stated yesterday that he intends to replace Powell in the coming months. Powell has previously clarified that the President does not have direct authority to remove the Fed Chair, so this statement adds a layer of political uncertainty.
According to CME FedWatch, there is about a 95% probability of a 25 bps rate cut being announced.
1H–4H Technical Analysis:
The 6,900 area is currently acting as a strong resistance zone, followed by the 6,878 support area.
• Bears have entered around 6,900–6,917, attempting to push prices lower.
• Bulls, however, are showing resilience and defending the zone.
If price fails to hold above 6,900, we could see a pullback toward 6,878.
Should 6,878 fail to hold, a sharper decline toward the gap zone could occur.
Given the interest rate decision, expect high volatility — with sharp moves both up and down before and after the announcement.
If you’re planning to trade this event, manage your stop loss carefully and avoid overexposure.
Disclaimer:
This content is for informational purposes only and does not constitute financial or investment advice. © DIBAPRISM
Amir D.Kohn
USDCAD Faces Pressure as DXY Correction Nears Key Resistance!!Hey Traders, in today’s trading session we are monitoring USDCAD for a potential selling opportunity around the 1.40200 zone.
The pair remains in a broader downtrend and is currently in a correction phase, approaching the trendline and resistance area at 1.40200.
From a macro perspective, the US Dollar Index (DXY) is testing its 98.900 channel resistance, where upside momentum may fade amid a weakening U.S. labour market and rising expectations for a dovish shift from the Fed.
A potential DXY rejection from that level could amplify downside pressure on USDCAD, especially if oil continues to find demand and supports the Canadian Dollar.
Next move: Watching for bearish confirmation near 1.40200 for potential continuation of the broader downtrend.
💬 What’s your view on USDCAD and the Dollar outlook this week? Share your thoughts below!

EURUSD BULLS Could be backBased on lower than expected CPI that was out last week and expected rate cut on Wednesday EURUSD is likely to maintain a slow bullish tone. I haven't modified my last week set up a lot but there is a small trendline 4hr time frame that is likely to be followed towards Wednesday's event. And if Powell maintains a dovish stance the uptrend will officially resume towards NFP. Traders are remaining bullish because of Fed rate cuts path, expecting a two rate cut this year. I am looking forward to making adjustments depending on how events will play out this. In line also is the ECB Main financing rate which is expected to remain unchanged thus giving the EURO stability. I will remain patient and make adjustments when necessary but for now I maintain a bullish but cautious tone.

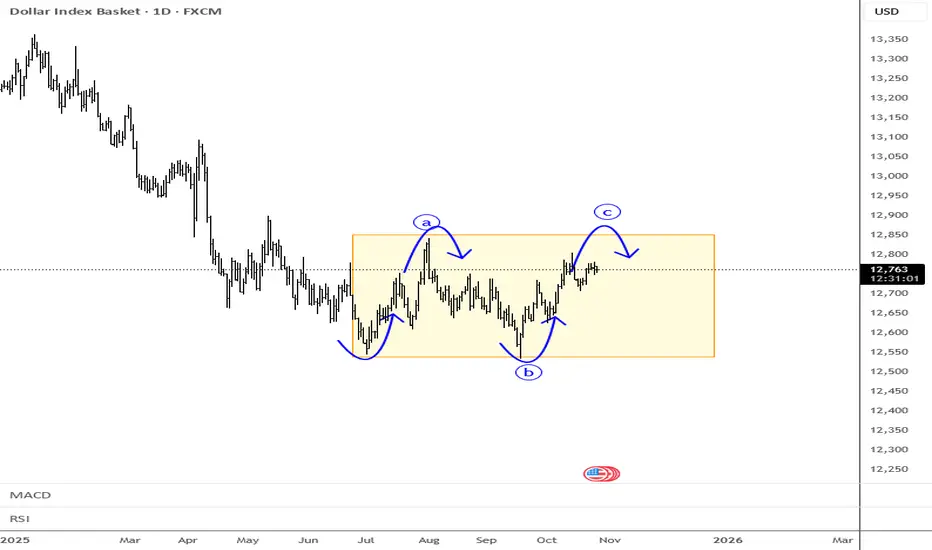
Dollar In Range-And It May Not Be Broken Soon...Stocks are pushing nicely to the upside after some optimism that a deal could be reached between the US and China regarding tariffs, as reported this weekend by Trump himself. He’s clearly driving the market into a risk-on mode.
However, it’s interesting to see that the dollar is still going nowhere; the only FX market showing a more decisive move is the Aussie, which is naturally benefiting from this story.
Looking at the dollar index, no one knows where it wants to move but basic analysis in ranges is simple; "down from resistance, up from the support".
Keep in mind we’re still missing the latest US jobs data, so the outlook for further cuts remains uncertain, and that could keep the dollar moving sideways for now.
Have a nice trading week!
GH
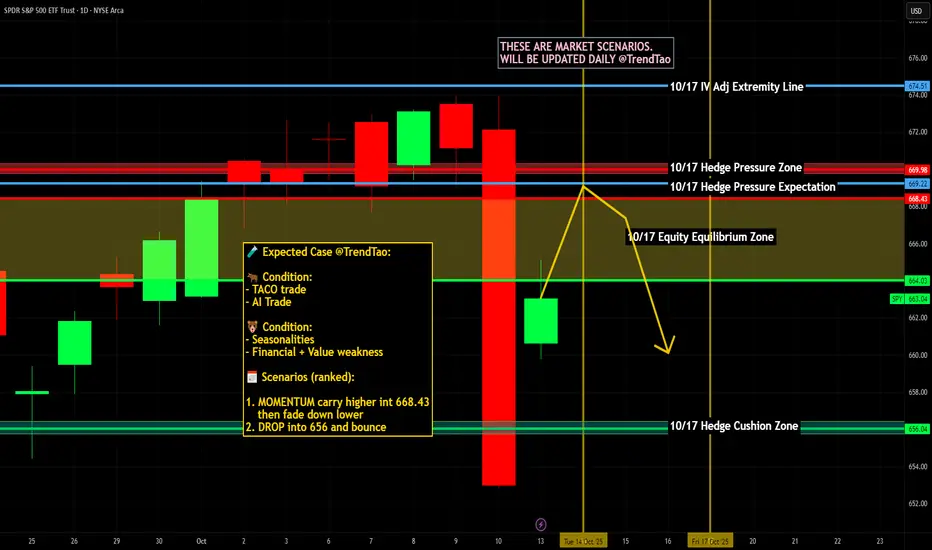
$SPY / $SPX Scenarios — Tuesday, Oct 14, 2025🔮 AMEX:SPY / SP:SPX Scenarios — Tuesday, Oct 14, 2025 🔮
🌍 Market-Moving Headlines
🚩 Powell returns: The Fed Chair’s midday remarks anchor Tuesday — traders watch tone shifts after a light Columbus Day tape.
💬 Fed-heavy lineup: Bowman, Waller, and Collins fill out the day — policymaker divergence could move yields and risk assets.
📈 Small biz sentiment: NFIB optimism opens the day, giving early insight into Main Street labor and inflation pressures.
⚠️ Shutdown overhang: Broader data flow still limited — markets key off Fed speak and earnings momentum.
📊 Key Data & Events (ET)
⏰ 6:00 AM — NFIB Small Business Optimism (Sept)
⏰ 8:45 AM — Michelle Bowman (Fed Gov) speech
⏰ 🚩 12:20 PM — Fed Chair Jerome Powell speech
⏰ 3:25 PM — Christopher Waller (Fed Gov) speech
⏰ 3:30 PM — Susan Collins (Boston Fed) speech
⚠️ Note: No high-tier macro data releases due to shutdown effects — Fed communication and earnings dominate the tape.
⚠️ Disclaimer: Educational / informational only — not financial advice.
📌 #trading #stockmarket #SPY #SPX #Powell #Fed #Waller #Bowman #Collins #NFIB #yields #bonds #shutdown #economy #megacaps
EURUSD still bullish. Here is why. Last week's sell off was triggered by the resignation of the French prime minister which was then slowed by the Trump's 100% threat on China. Also in the same week Gaza has agreed to a cease fire deal. This week we expect the US CPI to set the pace for EURUSD. Any higher than expected will confirm that inflation is too hot for a cut. Reports have been emerging that the tariffs have shown close to no effects on the US economy allowing room for disinflationary measures. Therefore, a low than expected CPI will mean the sell off that happened in the past week was just a correction and the 1.18 zone is likely to be tested. Finally if Powell maintains a dovish tone on Tuesday then bulls will hold.

$NKE Inverse Head and Shoulder $117 to gap fillThe chart is currently forming a classic Inverse Head and Shoulders pattern, which is a bullish reversal setup. The left shoulder and head have already been established, and the right shoulder is in development, suggesting a potential breakout to the upside. The neckline resistance appears to be around the $73-$85 range. A confirmed breakout above this level could trigger a measured move toward the $117 gap fill, which aligns with a previous price gap and serves as a logical target for bullish momentum.
Key technical highlights:
Target Price: ~$117 (gap fill zone)
If volume confirms the breakout above the neckline, this setup could offer a strong risk/reward opportunity for traders. Keep an eye on RSI and MACD for confirmation of bullish momentum.

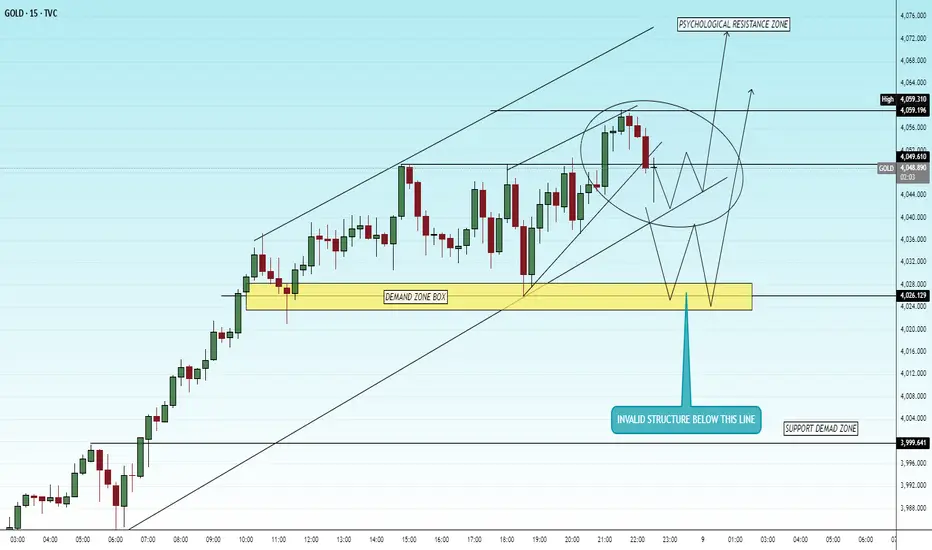
XAUUSD 15m – FOMC Setup AheadTVC:GOLD
Structure | Trend | Key Reaction Zones
Price still maintaining a descending channel structure.
Sitting near psychological and demand support zone (4030–4025).
FOMC volatility expected — final structure below 4025 could trigger continuation down, else a short-term bullish correction may occur.
Market Overview
Gold has been under intense selling pressure before the FOMC event, forming multiple lower highs within a bearish channel. The zone around 4030–4025 remains a key area where liquidity may sweep before a potential retracement toward upper levels if the market rejects strongly from this zone.
Key Scenarios
✅ Bullish Case 🚀 → Bounce from 4030–4025 → 🎯 Target 4068 → 🎯 Target 4085 → 🎯 Target 4100
❌ Bearish Case 📉 → Break below 4020 → 🎯 Target 4005 → 🎯 Target 3980
Current Levels to Watch
Resistance 🔴: 4068 / 4085
Support 🟢: 4030 / 4020
⚠️ Disclaimer: This analysis is for educational purposes only. Not financial advice.
SPY MONEY PRINTER GO BRRR|LONG|
✅SPY with the FED lowering rates, liquidity injections perspective fuel risk assets. Price has broken out above the key level, signaling bullish order flow. SMC outlook suggests momentum could push into new all-time highs as money printer effects unfold. Time Frame 1H.
LONG🚀
✅Like and subscribe to never miss a new idea!✅

Powell cutting rates? But why would he?📉 Powell cutting rates? 100% priced in. Even talk of 1–2% slashes. But why would he?
Let’s look at what the media ignores:
🇮🇳 Reports suggest India plans to cut its US Treasury holdings by up to 50% by 2025. That could mean roughly $450B hitting the market. Who’s going to buy that debt? The Fed? They’re already running negative equity — something that would be called insolvency for any private company.
Lowering rates would allow the US government (and its billionaire buddies) to borrow even more cheap money — not to fix the economy, but to speculate, pump Bitcoin, and trash the dollar further. Inflation? Even worse.
The US economy shows all the symptoms of a recession: layoffs rising, real wages falling, manufacturing shrinking. Official GDP numbers still look positive, but let’s not forget those “revisions” that always come later. Translation: the data is constantly massaged.
So what’s the real goal? Probably to juice the housing market. But let’s be honest: US mortgage rates today are just average by historical standards. Russia’s rates are higher, yet their currency and balance sheet look healthier because they don’t live off endless money printing.
The core problem is clear: reckless dollar printing to protect billionaire portfolios. And Powell? If he truly had conviction, he wouldn’t touch the rate at all.

Two-phase FOMC reaction on EURUSD explained: Where next?EURUSD experienced a classic "dovish-then-hawkish" whipsaw following the Fed's 25bp cut. The Initial dovish reaction saw the fibre surge above 1.19 to multi-year highs as the dot plot showed 50bp additional cuts vs expected 25bp in 2025. However, Powell's hawkish presser reversed gains within the hour, describing the cut as "risk management" rather than an aggressive easing cycle start.
EURSD is finding support at 1.1778 (previous high), with the price having taken out the 100% Fibonacci extension from August lows. Critical support sits at 1.1740, with a break below invalidating the bullish bias.
Bullish Scenario
Targets : 1.1830, 1.1866 (critical level), then 1.2000-1.2032
Triggers : Hold above 1.1778, break above 1.1866
Rationale : ECB-Fed divergence theme intact with ECB holding, while Fed cuts
Bearish Scenario (Potential Dead Cat Bounce)
Targets : 1.1750, 1.1730
Entry : Short at 61.8% Fibonacci retracement (~1.1832)
Stop : Above 1.1878
R:R Ratio : 3.38
Where next?
ECB pause vs Fed easing supports underlying bullish EUR/USD theme despite near-term volatility. But the next FOMC meetings are more critical as Powell emphasised a "meeting-by-meeting" approach. Current pullback is likely a retracement before a potential continuation higher, but watch for rejection at the weekly trendline resistance shy of 1.20.
This content is not directed to residents of the EU or UK. Any opinions, news, research, analyses, prices or other information contained on this website is provided as general market commentary and does not constitute investment advice. ThinkMarkets will not accept liability for any loss or damage including, without limitation, to any loss of profit which may arise directly or indirectly from use of or reliance on such information.

BTC: Bullish range below 114,472, 111,809 remains key__________________________________________________________________________________
Market Overview
__________________________________________________________________________________
BTC is holding a constructive 110k–115k range after rejection below 117k, with buyers defending 111,809 and supply capping under 114,472–116,217. The HTF trend remains intact, but breakouts need volume confirmation.
Momentum: 📈 Bullish-in-range — building above 111,809, but capped until 114,472 breaks.
Key levels:
- Resistances (4H/12H): 114,472; 116,217–117,966; 124,278 (W).
- Supports (4H/1D): 111,809; 110,000; 107,286–107,299 (1D).
Volumes: Very high on 1H/30m (pivot validation), normal on 1D — acts as a breakout catalyst.
Multi-timeframe signals: 1D/12H trend up; 6H/4H “neutral buy” below 114,472; 2H/1H recovering; 30m/15m impulsive but close to resistance.
Risk On / Risk Off Indicator: NEUTRAL BUY (STRONG BUY on 15m) → moderate long bias, consistent with momentum while 111,809 holds.
__________________________________________________________________________________
Trading Playbook
__________________________________________________________________________________
Strategy context: HTF trend is bullish, range in play; favor tactical longs while 111,809 holds and fade clean rejections below 116,217.
Global bias: NEUTRAL BUY above 111,809; invalidation if daily close < 111,809.
Opportunities:
- Range long: re-accumulate 112.05k–112.3k if 111,809 holds cleanly; add on break & hold > 114,472.
- Breakout: buy the close and successful retest > 114,472 targeting 116,217 then 117,966.
- Tactical short: sell a clear rejection at 114,472/116,217 (wick + volume), manage tight and take profits fast.
Risk zones / invalidations: A confirmed loss of 111,809 reopens 110k then 107,286 (bull bias invalid). A 12H/1D close > 116,217 invalidates fade shorts.
Macro catalysts (Twitter, Perplexity, news):
- Powell’s speech: potential trigger for break or fakeout.
- US PMIs: can spark the 114,472 break or a rejection.
- Hard assets strong (gold at records) and oil lower: mixed “inflation/sentiment” that shapes risk appetite.
Action plan:
- Long (range/break): Entry 112.05k–112.3k or > 114,472 / Stop 111,650 / TP1 114,472, TP2 116,217, TP3 117,966 / R:R ~2–3.
- Short (tactical): Entry 114.3k–114.5k (rejection) / Stop 114,800 / TP1 113.1k, TP2 111,809 / R:R ~1.5–2 (reduced size).
__________________________________________________________________________________
Multi-Timeframe Insights
__________________________________________________________________________________
Overall, HTFs (1D/12H) stay bullish, while LTFs rebound but still face nearby resistance.
1D/12H: Uptrend above 111,809 and 107,286 pivots; reclaim of 114,472 would open 116,217 then 117,966 with volume confirmation.
6H/4H: “Neutral buy” below 114,472; active range 111,809–114,472; a close > 114,472 should target 116,217.
2H/1H: Ongoing rebound, strong 1H volumes at the pivot; need a close > 114,472 to convert into impulse.
30m/15m: Intraday impulse (strong risk-on on 15m) but immediate friction at 114,472; beware fake breaks without a successful retest.
__________________________________________________________________________________
Macro & On-Chain Drivers
__________________________________________________________________________________
Macro is mixed: Fed speak and PMIs are in focus, hard assets strong and oil easing — likely to polarize breaks on the key technical levels.
Macro events: Powell can trigger a break/reversion; US PMIs may add volatility; record gold and softer oil adjust the “inflation/sentiment” lens.
Bitcoin analysis: 110k–115k range with 117–117.5k rejection; the 112k–110k support cluster is pivotal to preserve the structural bull bias.
On-chain data: Not provided here — no actionable on-chain extremes mentioned in this set.
Expected impact: If Powell/PMIs validate risk-on, a close > 114,472 should extend to 116,217–117,966; otherwise, expect a return to 111,809 then 110k.
__________________________________________________________________________________
Key Takeaways
__________________________________________________________________________________
BTC trades a bullish range above a key pivot while dense resistance sits overhead.
- Trend: moderately bullish while 111,809 holds; need a close > 114,472 to re-ignite upside.
- Prime setup: buy the defense of 111,809 or the break & hold > 114,472, aiming 116,217 then 117,966.
- Macro: Powell/PMIs can trigger the break or produce intraday traps.
Stay disciplined: wait for close-and-retest confirmations to size up, and de-risk quickly if macro flow contradicts the signal.

$SPY / $SPX Scenarios — Tuesday, Sept 23, 2025 🔮 AMEX:SPY / SP:SPX Scenarios — Tuesday, Sept 23, 2025 🔮
🌍 Market-Moving Headlines
📉 Post-Fed digestion: Equities and bonds still recalibrating after last week’s SEP + Powell tone.
💻 Mega-cap watch: Tech + AI flows continue to drive AMEX:XLK sentiment.
🌐 Central bank chatter: A busy Fed speaker slate gives extra volatility into month-end.
📊 Key Data & Events (ET)
⏰ 9:00 AM — Fed Vice Chair for Supervision Michelle Bowman speech
⏰ 🚩 9:45 AM — S&P Global Flash PMIs (Sep) — Services & Manufacturing
⏰ 10:00 AM — Atlanta Fed President Raphael Bostic speech
⏰ 🚩 12:35 PM — Fed Chair Jerome Powell speech
⚠️ Disclaimer: Educational/informational only — not financial advice.
📌 #trading #stockmarket #SPY #SPX #Powell #Fed #PMI #economy #Dollar #bonds #megacaps
Dow at record highs, outperfoms peers! But are risks brewing?The Dow Jones DJIA surged to new record highs, driven by defensive sector strength and expectations of Fed rate cuts. Dow outperformed due to its heavier weighting in defensive sectors (industrials, financials, consumer staples), which are favoured during economic uncertainty and falling yields. Technical analysis suggests further upside potential, as investors seek stability and dividends in Dow components amid lingering recession risks. However, key support levels must hold to sustain the rally.
The Dow has completed a V-shaped recovery, breaking above previous double-top highs from 2024/2025 (45,150), now acting as support. An open triangle pattern was identified, with the current move likely the fifth wave to the upside. The index trades above all major moving averages, confirming bullish momentum, but RSI shows hidden bullish divergence, supporting the case for continued upside only if support holds after a pullback.
Dow has critical support at 45k, must hold to maintain bullish momentum. A drop below 45,581 could trigger a correction. Short-term upside shows 47k, with a major Fibonacci cluster and technical inflexion in focus. Intermediate levels sit at 46300/45900/45640, with important long-term Targets at 45k, 49500, 50k, 53k.
Risks & Potential Scenarios
Divergence: Despite strong momentum, technical divergence suggests a possible corrective move if the Dow falls below 45581.
Bullish : Holding above 45581 and 45k supports further upside toward 47k and beyond.
Bearish : A break below 45581 could trigger a deeper pullback before any renewed rally.
Market Sentiment :
The bond market’s caution contrasts with stock market optimism, so stay vigilant.
This content is not directed to residents of the EU or UK. Any opinions, news, research, analyses, prices or other information contained on this website is provided as general market commentary and does not constitute investment advice. ThinkMarkets will not accept liability for any loss or damage including, without limitation, to any loss of profit which may arise directly or indirectly from use of or reliance on such information.

Bitcoin Trade of the Week: Liquidity Rules the MarketOne of the most decisive factors for markets right now is the expansion of liquidity. The growth of global M2 remains evident, particularly in China, where the economy faces a deflationary backdrop that forces authorities to maintain – and even expand – both monetary and fiscal stimulus. Ultimately, these flows permeate global financial markets and, as I’ve explained on several occasions, liquidity is the fuel that drives asset prices.
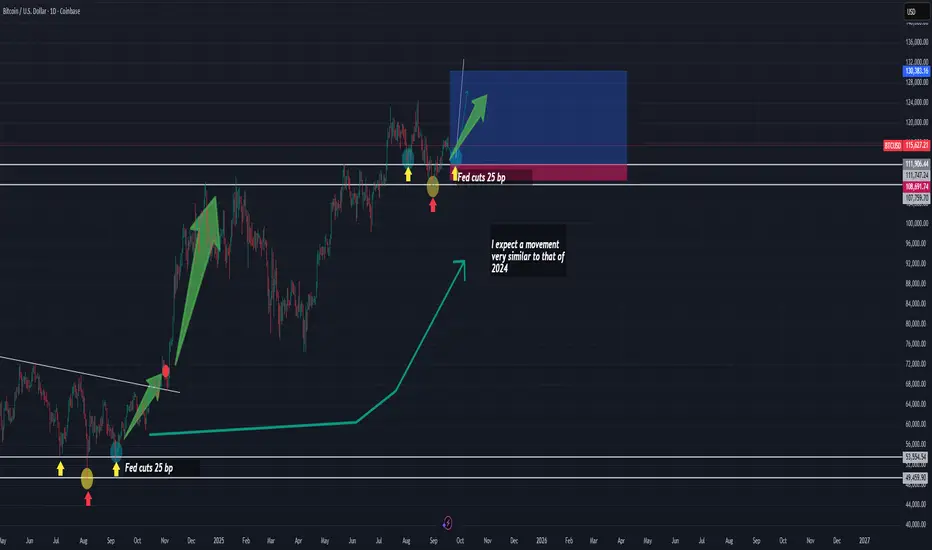
A Parallel with 2024
What we are observing today shows remarkable similarities with what happened in 2024. Back then, the start of Federal Reserve rate cuts marked a turning point. Even a moderate 25-basis-point cut triggered a rebound that coincided with a technical consolidation phase in Bitcoin, shaped as a descending channel.
Later, in November 2024, when the Fed accelerated the move with a 50-basis-point cut, the result was a much more aggressive bullish impulse.
Today, we find ourselves in an environment with rising probabilities of further cuts in upcoming Fed meetings, which could once again act as a catalyst.
Correlation Context with the Nasdaq 100
Meanwhile, the Nasdaq 100 is printing all-time highs, reflecting the strong risk appetite in tech assets. Bitcoin, in contrast, remains slightly behind its own highs. This divergence can be interpreted as a window of opportunity: if additional liquidity is confirmed through another rate cut, the momentum could spill over into Bitcoin and provide the strength needed to form a technical reversal structure—very similar to the inverted Head and Shoulders (H&S) pattern observed in 2024.
Trading Strategy
Entry Zone: 111,906.44
Stop Loss (SL): 108,607.83
Take Profit (TP): 130,383.16
ETH 1H Analysis - Key Triggers Ahead | Day 20👋🏻 Hey everyone! How’s it going? Hope you’re all doing well.
❄️ Welcome to Crypto Winter.
⏰ Today, we’ll be analyzing ETHUSDT and exploring its potential opportunities.
👀 On the 1-hour timeframe for Ethereum, we observe that after exiting its box, Ethereum entered a downtrend, marked by a trendline. As much as attention was given to it, suddenly it was ignored, and buyers could not keep the price high enough. Ethereum’s triggers are completely defined — with a breakout and confirmation of these zones, Ethereum can create trading opportunities for us.
🧮 The key RSI oscillator levels are 59 and 30. If momentum passes these levels, Ethereum could start its move, although it may be ignored at times. After rejection from the $4,757 zone, red candles were significantly larger than green candles. Today, Ethereum’s volume is increasing, and we need to see what will happen with the news for Ethereum.
💸 The ETH/BTC pair, or Ethereum versus Bitcoin, is currently in a compression resembling multi-timeframe accumulation. Exiting this compression can clearly determine Ethereum’s direction. The upper and lower bounds of this compression can be considered alert zones, where you can observe price behavior when it reaches these levels.
🔴 Today’s news could have a significant effect on Ethereum. Especially if a stepwise interest rate cut occurs, Ethereum could reach targets above $6,000 and create a larger DeFi space, particularly in terms of contract and collateral infrastructure.
🧠 To enter Ethereum positions, we need to wait for a bullish move in ETH/BTC, confirmation in ETH/USDT, and a breakout of key resistances. After these breakouts occur, we can enter at each level and stay in the trades as long as the market allows.
❤️ Disclaimer : This analysis is purely based on my personal opinion and I only trade if the stated triggers are activated .

BTC 1H Analysis - Key Triggers Ahead | Day 39👋🏻 Hey everyone! How’s it going? Hope you’re all doing well.
❄️ Welcome to Crypto Winter.
⏰ Today, we’ll be analyzing BTCUSDT and exploring its potential opportunities.
👀 On the 1-hour timeframe for Bitcoin, we observe that after breaking the $116,000 zone, the price moved upward and buyers drove it to the $117,000 level. Then, sellers pushed the price back down to roughly the same level as yesterday. Currently, Bitcoin has two important triggers: one at $116,860 and another at $114,660. With a breakout of these levels, we can take positions more confidently. I don’t have a specific short scenario in mind because long positions, if taken, could continue with the news of interest rate cuts, and we could even add several funding levels to our positions.
🧮 On the RSI, the two critical zones are 70 and 38. If momentum breaks either, Bitcoin could move with much more strength.
🕯 The size and volume of green candles have increased significantly after micro-buyers entered. However, due to the interest rate cut news and upcoming scenarios, this kind of movement and these candles may not continue. One notable point on the chart is that the buying pressure has caused the size, volume, and number of green candles to be smaller, yet they produce larger moves. Our momentum for further upward movement is stronger and more powerful.
🔴 Today’s news could affect Bitcoin’s future price, so try to take a position aligned with the news. Although it seems risky, Bitcoin’s volatility relative to other coins is lower on news days, meaning less risk for traders.
🧠 There are two scenarios for entering a Bitcoin position:
1️⃣ Place a stop-buy at $116,850 to enter when the stop triggers. The stop size would be 2–3%, which is relatively large, delaying risk-to-reward, and there is a chance the scenario fails and the stop is hit.
2️⃣ Wait for a 15-minute candle setup (Indecision + SMA + Low Volume) to enter, allowing a smaller stop at roughly the same level. This still carries the risk of being stopped out quickly.
Risk management is essential — if we follow it today, nothing adverse should happen.
❤️ Disclaimer : This analysis is purely based on my personal opinion and I only trade if the stated triggers are activated .

USDJPY Deat Cat Bounce at play after Jackson Hole remarks?In this video, we analyse the sharp move in the USDJPY following crucial speeches from Fed Chair Jerome Powell and BOJ Governor Kazuo Ueda at the Jackson Hole Symposium. Powell signalled the possibility of a September rate hike, highlighting ongoing weakness in the US labour market. Meanwhile, Ueda emphasised Japan's strong job market, supported by immigrant labour, which is driving wage growth and sustaining inflationary pressures.
Ueda’s Hawkish Stance:
Ueda maintained a hawkish tone, noting that wage hikes in larger Japanese companies are now spreading to smaller firms, strengthening expectations for continued inflation. This commentary increased the likelihood of a BOJ rate hike, giving the yen additional support.
Market Reaction:
Prior to the Symposium, traders were positioned for a potential rate cut by year-end. However, after Ueda’s remarks, futures market pricing suggests the odds of an October rate cut are now evenly split at 50-50.
Technicals:
Open triangle completion may trigger further downside after the post-JHS drop. Current rally to the upside could be a relief rally, part of a potential Dead Cat Bounce (DCB).
This content is not directed to residents of the EU or UK. Any opinions, news, research, analyses, prices or other information contained on this website is provided as general market commentary and does not constitute investment advice. ThinkMarkets will not accept liability for any loss or damage including, without limitation, to any loss of profit which may arise directly or indirectly from use of or reliance on such information.

Melt-Up into FOMC - Post FED Expect CorrectionMore all-time highs
I shouldn't be upset (and I'm really not as the portfolio continues to make new YTD highs)
But technically, it is extremely frustrating to see nothing more than slow grind higher after slwo grind higher on the indexes - and also see blowout moves on individual stocks (ORCL, GOOGL, AVGO for example)
Rising Wedge still hasn't rolled over, resistance at 6500 hasn't been a wall yet
50 Day Moving Average is now over 90 bars from price. I could see price action melting up
into a crescendo or peak pre, during, or post FOMC and then fading lower after to find
some technical levels I've been eyeing for weeks
Enjoy the melt-up, just be ready for some action and volatility in the indexes, gold, silver,
bitcoin, and the bond/yield markets
I won't complain about YTD highs, but it's the caution ahead that I don't want to be
surprised by in the coming weeks
Plan accordingly - I'll continue to grind through it the best and safest way I know how
Thanks for watching!!!
