Lets Snipe NZD/USD Down!! ShortLETS SNIPE THIS PAIR DOWN!!
Note: Do your own research before taking the trade.
Short/Sell: 0.71500
SL: 0.71802
Target: 0.70625
Profits

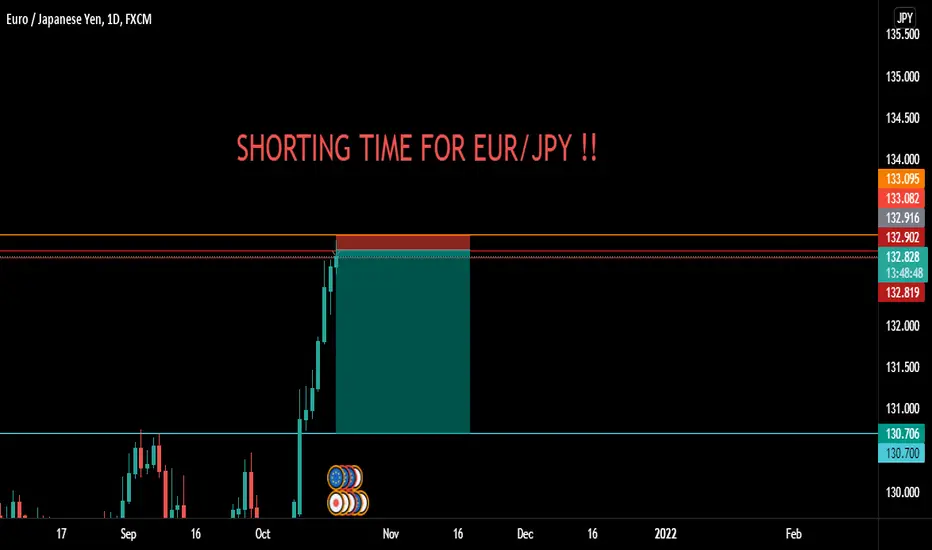
SHORTING TIME FOR EUR/JPY !! SHORTING TIME FOR EUR/JPY !!
Note: Do your own research before taking the trade.
Short zone: 132.819 - 132.900
SL: 133.095
Target: 130.700
LETS SHORT GBP/USD !! The Pair has bounced back from Strong Trend Line Resistance . Sell/Short is recommended.
Note: Do your own research before taking the trade.
Sell/Short: 1.37573 -1.37255
SL: 1.37760
Target: 1.34300

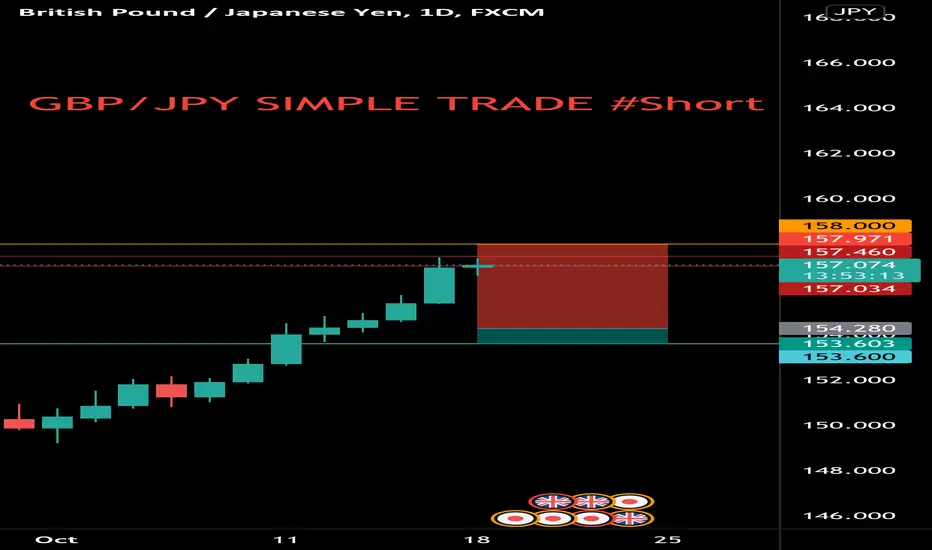
GBPJPY SIMPLE TRADE #Short GBPJPY SIMPLE TRADE #Short
Note: Do your own research before taking the trade.
Sell/Short: 157.430 - 157.000
SL: 158.000
Target: 153.600
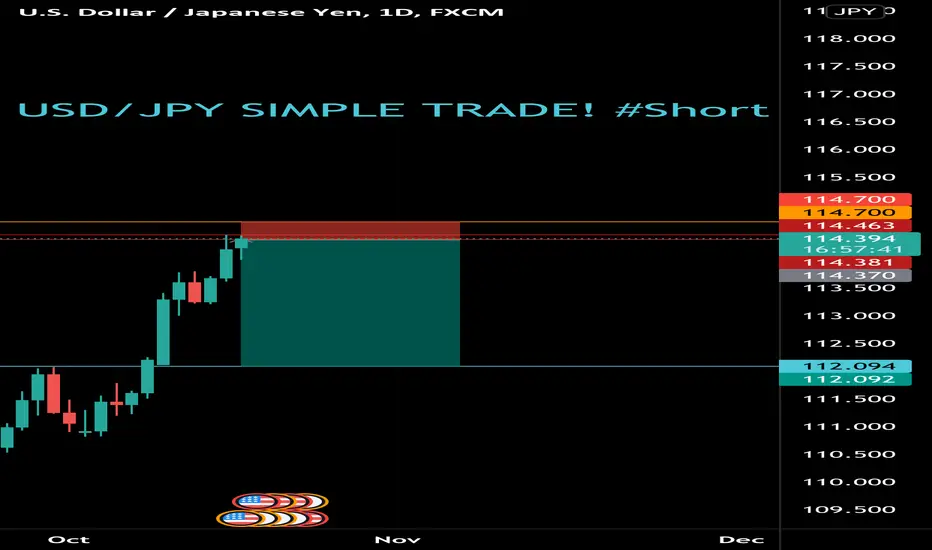
USD/JPY SIMPLE TRADE! #Short USD/JPY SIMPLE TRADE! #Short
Note: Do your own research before taking the trade.
NZDUSD LONG Trend is expected to be in Bullish So take a ride and make some profits Moreover last candlestick is showing three white soldiers

USD/CAD LIKELY TO RISE !! #LongUSD/CAD LIKELY TO RISE !! #Long
Note: Do your own research before taking the trade.
Buy/Long: 1.23356 - 1.23560
Stop loss: 1.23200
Target: 1.25600

DXY LONG TERM SELL • market reached a major trendline (weekly)
• for the past two days of last week price has been indecisive resulting in two reversal candlestick patterns (drawn and highlighted) which show a slow down in momentum and possible market reversal.
• so i'll be looking to sell the dollar as of now and reach that support level, but we wait and see what the market does next week and then we adapt to whatever it does and seek opportunity.
please do share your opinions and input :)

EUR/AUD SIMPLE PLAN #LongEUR/AUD SIMPLE PLAN #Long
Note: Do your own research before taking the trade.
Buy/Long: 1.56100-1.56200
Stop Loss: 1.55700
Target: 1.58400


ALICEUSDT /^^^/ LONG - 15MINBINANCE:ALICEUSDT
Long - all explained in the video.
Things are good - but you need to still never get too comfortable.
Set your stop loss, plan your entry and tp based on your risk management plan.
Have fun!!
Alt.

Patients Is Key!Here on the 15min. A little consolidation, I'm going to wait for clean/strong break and look for an entry on the 5min chart & ride the wave.

$NTR Taking profitsGreat box breakout , taking profits here. Possible re entry after RSI comes down a bit. Great trade !

EUR/AUD CAN WITNESS BULLISH WEEK! #LongIt seems that EUR/AUD is likely to see a good bullish week. Buy/Long is recommended.
Note: Do your own research before taking the trade.
Buy/Long: 1.57800 - 1.58400
SL: 1.57161
Target: 1.64358

GBP/USD LIKELY TO RISE !! #LongThe Bears in GU Pair seems to be exhausted. The Pair is likely to Rise now!
Buy/Long is recommended with strict Stop Loss.
Note: Do your own research before taking the trade.
Buy/Long: 1.35000
SL: 1.34300
Targets: 1.39800 and 1.42400

GBPJPY ANALYSIS on friday market broke a significant bearish trendline both because of technicals (market was bullish for about two weeks) and fundamentals (nfp) so i'll be looking for market to lose a bit of momentum next week which will result in a retest (corrective move) before continuing in it's bullish move my predictions say that market will reach my tp area

YEN BASKET ANALYSIS FOR NEXT WEEKon friday market tanked down because of of nfp and also because of technicals (market was already bearish for 2 weeks) so upcoming week there'll be a slow of momentum resulting in a corrective move (retest of broken trendline) then market will continue in overall direction and i'll be looking for price to reach my take profit level as it was a support level in the past

EUR/USD Near Reversal !! #LongBuying Opportunity Arising in EURUSD !
The Pair is very likely to Reverse . The Target is Long-term . Buy zone, Stop Loss and Targets are mentioned below;
Note: Do your own research before taking the trade.
Buy: 1.15400 - 1.15100
SL: 1.14600
Targets: 1.19180 & 1.21868

RMRK/USDT Breakout IncomingWe are at a mega support in a trending up channel here for RMRK. We can see huge upside potential, follow channel for signal and analysis! Follow like, enjoy profits!

Is the BTC Bottom in? October the Month of Mega Gains?For all your ichi lovers ou there, on the 1D, we've got one of the most beautiful E2E's ever, but we're just sitting below this cloud resistance, which we'll likely see act as support as we react at that top supply, so a level to consider for eventual pullbacks.
This is also an important level from a fibs standpoint (my fibs are set from a while back to look at the overall picture, I'll still draw more recent ones when I'm looking for pullbacks also.)
I would not be surprised to see a quick pullback to that 44-45 level before our next move, but are still holding spot buys on the chance that we pump into the weekly close and Asia gives us a little kick as well.
I mentioned 2 days ago I had a feeling it was getting close to an alt run.. I'm getting a lot more confident of that after this move, but we still have work ahead of us and i'm not jumping too deep into the few positions I have open currently.
I think there's going to be a few trades put on this October...

BTC/USDT BREAKOUT Bitcoin to USDT is now in a breakout in the 1D time frame. We need the daily candle to close above the resistance line (Pink Trendline) to be able to confirm this breakout. If confirmed we can see further push into the Bull Territory marked zone and on its way to 53k soon and possibly 55-60K within this month(October). There can still be a retest of the newly formed support(Pink Trendline) but so long as we remain above the resistance line (Pink Trendline), we are considered bullish as long as confirmed. This will allow the rest of the market to follow and push very heavily. Next upcoming chart will be BTC Dominance.

I TOLD Y'ALL TO BAG THIS BABY, DID YOU? NOW LOOK AT THISJust me flexing on 977% profit 💰🎯💸✅
**********************************

MONEY: IN SMALL TRENDSIn my own methodology I've shown in other charts that, it doesn't matter which time frame you make your money. I even showed a 3 min trend on one occasion. All this true is trend-following - which is different to following a moving average of some sort. The ATR line reacts differently to price fluctuations.
The important thing is to minimise losses.
This chart is a 15 min time frame. It's of little value now because the start of the trend is where you want to be. But for the future I'm showing where the entry point is. Similar strategies can be used on other time frames.
1. See the trend breaking down and fighting to stay afloat.
2. See the double top on the 15 min time frame.
3. See price collapse.
4. See the rebound to 0.5% fib.
Experience is required with all this. In this scenario the stop-loss could have been just above 0.618. That was an unlikely rebound in this particular scenario because price was struggling already. (In other scenarios where price isn't struggling as much I've seen retracements to 0.76 and above).
Please note carefully: true trend following is a higher risk strategy but also an exceptionally higher reward strategy. It loses far more often than other strategies. But numbers of losses mean little. Why? It's the aggregate of the minority of big gains well outweighing minimised greater numbers of small losses. It certainly isn't for 'everybody'.
In he captioned scenario, nobody knows how far that 15 min trend will go. NOBODY! For trend-followers in this scenario, the exit would be the amber line. In other words, the market shows the entry point and the exit point. That's very scary.
See same strategy on the lowly 3 min time frame below
Disclaimers : This is not advice or encouragement to trade securities on live accounts. Chart positions shown are not suggestions intended to assure you of an advantage. No predictions and no guarantees are supplied or implied. The author trades mostly trend following set ups which have a low win rate of approximately 40%. Heavy losses can be expected if trading live accounts. Any previous advantageous performance shown in other scenarios, is not indicative of future performance. If you make decisions based on opinion expressed here or on my profile and you lose your money, kindly sue yourself.
