SUNTV LONG INTRADAY 19 Mar,2021Dear trader,
If u look at the chart of SUNTV (analysis based intraday only) the SUNTV Buy at 461 and Target at 470 and stop loss at 450.
The chart clearly indicates Bullish Trend you can also see the candle stick patters for more indepth analysis.
In Intraday most important thing is to enter and exit points.
Our signals are based on analytics, algorithms, mathematical derivatives.
Always be a responsible trader, kindly trade only when you have maximum opportunity in the market with minimum risk and with keynotes like data, analysis and proper strategies.
Kindly message us for strategies and analysis.
Profits

💡Don't miss the great buy opportunity in VETBTCTrading suggestion:
. There is a possibility of temporary retracement to the suggested support line (0.00000070).
. If so, traders can set orders based on Price Action and expect to reach short-term targets.
Technical analysis:
. VETBTC is in an uptrend, and the continuation of the uptrend is expected.
. The price is above the 21-Day WEMA, which acts as a dynamic support.
. The RSI is at 64.23.
Take Profits:
TP1= @ 0.00000095
TP2= @ 0.00000110
TP3= @ 0.00000130
TP4= @ 0.00000150
TP5= @ 0.00000190
TP6= @ 0.00000215
TP7= @ 0.00000270
SL= Break below S2
❤️ If you find this helpful and want more FREE forecasts in TradingView
. . . . . Please show your support back,
. . . . . . . . Hit the 👍 LIKE button,
. . . . . . . . . . Drop some feedback below in the comment!
❤️ Your Support is very much 🙏 appreciated! ❤️
💎 Want us to help you become a better Forex trader ?
Now, It's your turn !
Be sure to leave a comment. Let us know how you see this opportunity and forecast.
Trade well, ❤️
ForecastCity English Support Team ❤️

gold's next movegold will push to the fibo 0.618. this fibo is taken on the 4h timeframe. after this push and the patron of a bearisch flag. we will go short on the fibo. if you misout you can also go short if 1750 breaks. the next position can be taken on the break of 1725 but i will wait untill the break of the bear flag.

What price to take profits? DOGE COIN & Price action (ĐOGECOIN)Perhaps the dollar is in accumulation from the last month. We have four times Doge test the trend line and proves to be a very strong support line.
We can see price react very strongly to take profit at 0.382. But in my opinion on this 3rd test it will fail and head towards the target of the 0.5 zone. Be careful at 0.618 zone, this strongest resistance, we should be take profit 50% if the price reacts strongly in this area.
Entry: < 0.06$
Stoploss: 0.0535$
Take profits: 0.0696$ and 0.0762$ and 0.0855$ and more..

DEEPAKFERT LONG INTRADAY 15 MAR,2021Dear trader,
If u look at the chart of DEEPAKFERT (analysis based intraday only) the DEEPAKFERT support at 219 and Target at 228 and stop loss at 210.
The chart clearly indicates Bullish Trend you can also see the candle stick patters for more indepth analysis.
In Intraday most important thing is to enter and exit points.
Our signals are based on analytics, algorithms, mathematical derivatives.
Always be a responsible trader, kindly trade only when you have maximum opportunity in the market with minimum risk and with keynotes like data, analysis and proper strategies.
Kindly message us for strategies and analysis.

NIFTY LONG INTRADAY15MAR,2021Dear trader,
If u look at the chart of NIFTY (analysis based intraday only) the NIFTY support 1 at 15010 and support 2 at 14900 and resistance at 15200.
The chart clearly indicates Bullish Trend you can also see the candle stick patters for more indepth analysis.
In Intraday most important thing is to enter and exit points.
Our signals are based on analytics, algorithms, mathematical derivatives.
Always be a responsible trader, kindly trade only when you have maximum opportunity in the market with minimum risk and with keynotes like data, analysis and proper strategies.
Kindly message us for strategies and analysis.

XAUUSD, sell By the looks of it, I’d say he overall market is bearish as of the moment.
I’m looking for trends which will indicate to me further decrease in price.
As you can see in my chart I’m current looking for a double top or a slight pull back before entering into a sell. My entry price is @1733.57 and TP @1678.581
What are your opinion guys ?
lmk in the comments👍

FTFT prediction of future potential breakout Future fintech if it can push through that trendline has massive breakout potential to approx 13$. From here we have a good entry point and area of value. Set the stops and enjoy a stress free high trade. Or play it even safer and wait for a break and retest of the trend line, this is a more conservative option as it could very well just pingpong off that trendline and head back down to 4$ area..with bullish bitcoin I expect the first option.
Please like/share if you like these ideas! Thank you!

ADANIENT LONG INTRADAY 12 MAR, 2021Dear trader,
If u look at the chart of ADANIENT (analysis based intraday only) the ADANIENT support 1 at 923 and resistance at 935.
The chart clearly indicates Bullish Trend you can also see the candle stick patters for more indepth analysis. You can also channel patterns.
In Intraday most important thing is to enter and exit points.
Our signals are based on analytics, algorithms, mathematical derivatives.
Always be a responsible trader, kindly trade only when you have maximum opportunity in the market with minimum risk and with keynotes like data, analysis and proper strategies.
Kindly message us for strategies and analysis.

GBPCAD - POTENTIAL LONGGBPCAD - LONG
Not a trade signal.
Trade at your own risk.
Trading is risky and does not guarantee profits.

EURUSD - POTENTIAL SHORTEU - SHORT
Not a trade signal.
Trade at your own risk.
Trading is risky and does not guarantee profits.

GBPNZD - POTENTIAL LONGGN - LONG
Not a trade signal.
Trade at your own risk.
Trading is risky and does not guarantee profits.

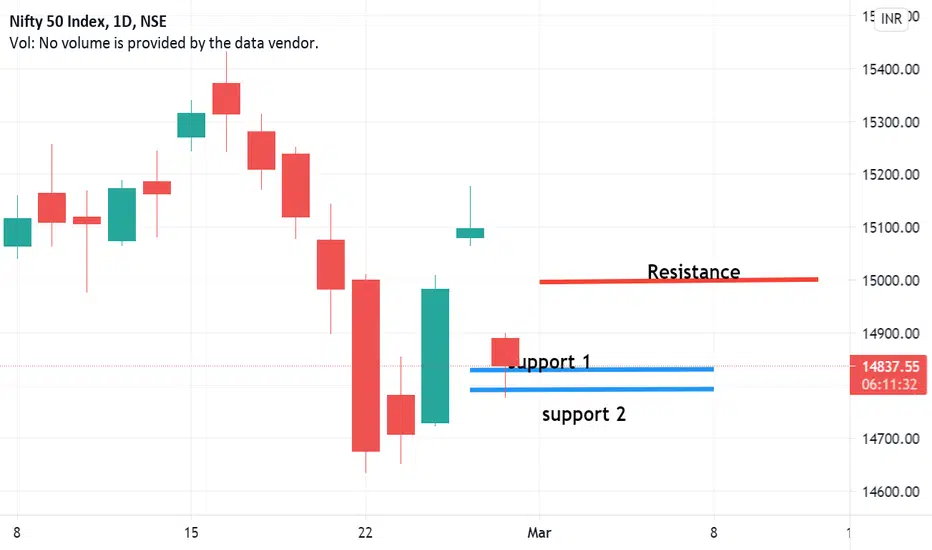
NIFTY LONG INTRADAY 2 MAR, 2021Dear trader,
If u look at the chart of HDFC LIFE (analysis based intraday only) the HDFC support 1 at 14760 and support 2 at 14700 and resistance at 14950.
The chart clearly indicates Bullish Trend you can also see the candle stick patters for more in depth analysis.
In Intraday most important thing is to enter and exit points.
Our signals are based on analytics, algorithms, mathematical derivatives.
Always be a responsible trader, kindly trade only when you have maximum opportunity in the market with minimum risk and with keynotes like data, analysis and proper strategies.
Kindly message us for strategies and analysis.

NIFTY LONG INTRADAY 1 MAR, 2021Dear trader,
If u look at the chart of NIFTY (analysis based intraday only) the NIFTY support 1 at 14650 and support 2 at 14600 and resistance at 14850.
The chart clearly indicates Bullish Trend you can also see the candle stick patters for more in depth analysis.
In Intraday most important thing is to enter and exit points.
Our signals are based on analytics, algorithms, mathematical derivatives.
Always be a responsible trader, kindly trade only when you have maximum opportunity in the market with minimum risk and with keynotes like data, analysis and proper strategies.
Kindly message us for strategies and analysis.

BANDHABNK LONG INTRADAY 26 FEB 2021Dear trader,
If u look at the chart of BANDHABNK (analysis based intraday only) the HDFC support at 340 and resistance at 348.
The chart clearly indicates resistance line break based buy above at 350 range narrowing - ascending triangle.
In Intraday most important thing is to enter and exit points.
Our signals are based on analytics, algorithms, mathematical derivatives.
Always be a responsible trader, kindly trade only when you have maximum opportunity in the market with minimum risk and with keynotes like data, analysis and proper strategies.
Kindly message us for strategies and analysis.

LUPIN LONG INTRADAY 26 FEB 2021Dear trader,
If u look at the chart of LUPIN (analysis based intraday only) the LUPIN support at 1035 and resistance at 1060.
The chart clearly indicates Bullish Trend you can also see the candle stick patters for more in depth analysis.
Symmetric Triangle Breakout Done and Can Break Resistance.
In Intraday most important thing is to enter and exit points.
Our signals are based on analytics, algorithms, mathematical derivatives.
Always be a responsible trader, kindly trade only when you have maximum opportunity in the market with minimum risk and with keynotes like data, analysis and proper strategies.
Kindly message us for strategies and analysis.

NIFTY LONG INTRADAY 26 FEB 2021Dear trader,
If u look at the chart of NFTY (analysis based intraday only) the NIFTY support 1 at 14830 and support 2 at 14790 and resistance at 15000.
The chart clearly indicates Bullish Trend you can also see the candle stick patters for more in depth analysis.
In Intraday most important thing is to enter and exit points.
Our signals are based on analytics, algorithms, mathematical derivatives.
Always be a responsible trader, kindly trade only when you have maximum opportunity in the market with minimum risk and with keynotes like data, analysis and proper strategies.
Kindly message us for strategies and analysis.
BTC Short Gartley playing out Im not telling anyone to take this as I have already taken TP2 and will be holding the rest of my short till TP3 or depending on how we react at that region maybe I hold .

AMC has the best popcorn Butter or no butter?
I've been watching AMC. Buy on the buy with proper disciplines and stop losses and you'll have free popcorn for life!
Please like and share!

BPCL INTRADAY FEB 24 2021 LONG FOR INTRADAYDear trader,
If u look at the chart of BPCL (analysis based intraday only) the NIFTY support at 430 and and resistance at 445
The chart clearly indicates BPCL has come out of a triangle giving breakout on weekly chart ,you can also see the candle stick patters for more in depth analysis.
In Intraday most important thing is to enter and exit points.
Our signals are based on analytics, algorithms, mathematical derivatives.
Always be a responsible trader, kindly trade only when you have maximum opportunity in the market with minimum risk and with keynotes like data, analysis and proper strategies.
Kindly message us for strategies and analysis.

APPS - consistent returnsSelf explanatory. Buy the dip, good to have cash on hand to seize the opportunities the market presents. Not always good to leave money on the table.
Switch the chart to candles and you can identify some great bullish candles at the reversal. Tweezer bottom got me looking at buying calls. The buy signal confirmed it. Ride the wave up and set the stop loss for some good risk/reward. Next signal was clear momentum play as the price moved above the cloud.
Safe trading! Like/Share!

HDFC LIFE LONG INTRADAY 23FEB 2021Dear trader,
If u look at the chart of HDFC LIFE (analysis based intraday only) the HDFC support 1 @705 and support 2 @685 and resistance at 715.
The chart clearly indicates Bullish Trend you can also see the candle stick patters for more indepth analysis.
In Intraday most important thing is to enter and exit points.
Our signals are based on analytics, algorithms, mathematical derivatives.
Always be a responsible trader, kindly trade only when you have maximum opportunity in the market with minimum risk and with keynotes like data, analysis and proper strategies.
Kindly message us for strategies and analysis.
