RTY / IWM Weekly: Cup & Handle Projection to $3280A classic Cup and Handle formation has developed on the weekly chart of the [b ]Russell 2000 (RTY) ; this structure is also visible on the IWM ETF.
My target is based on the depth of the Cup, which projects a measured move to $3280 . This represents a potential 24% upside from current prices.
Not Financial Advice. For educational purposes only.
Projection

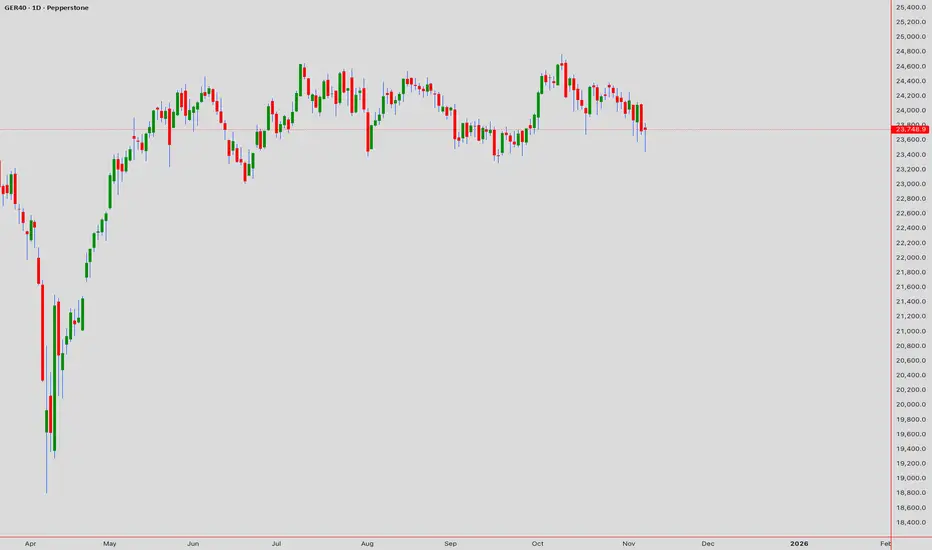
GER40 (DAX INDEX) TECHNICAL ANALYSIS# 📊 GER40 (DAX INDEX) TECHNICAL ANALYSIS 🎯
## Week of November 10-14, 2025 | Intraday & Swing Trade Mastery
Close Price: 23,748.9 Points | Entry Point: November 8, 2025, 12:54 AM UTC+4 📈
## 🔍 EXECUTIVE SUMMARY - MULTI-TIMEFRAME PERSPECTIVE
The DAX (GER40) is trading at a pivotal technical juncture with multi-timeframe alignment suggesting imminent breakout potential. Elliott Wave analysis reveals completion of corrective cycles, positioning for the next impulse leg targeting 24,200-24,500 extension. Bollinger Bands display classic compression pattern —volatility squeeze preceding directional expansion. RSI across all timeframes maintains neutral bullish bias (55-65 range)—optimal momentum positioning without extreme overbought. Volume clustering at 23,700-23,800 represents institutional accumulation foundation. Wyckoff spring tests near 23,500 provide aggressive entry triggers. Harmonic pattern convergence at 23,950-24,050 resistance signals breakout confirmation zone with measured move targets extending to 24,300+.
## 📊 TIMEFRAME-BY-TIMEFRAME ANALYSIS
### 5-MINUTE (Scalping Execution) ⚡
Candlestick Formation: Japanese candles reveal micro-consolidation breakout attempts with successive hammer/engulfing patterns at support zones. Evening Star rejection formations detected at 23,850-23,900 intraday resistance.
Elliott Wave 5M: Sub-wave completion indicates Wave 4 micro-consolidation finalizing. Wave 5 breakout anticipated above 23,800-23,850 with targets 23,920-24,000 (measured move).
Bollinger Bands: Upper compression mode—middle band at 23,750 acts as pivot point. Lower band rejection (23,680-23,710) creates scalp-long setups. Squeeze breakout targets 23,900+ on volume.
RSI (14) Analysis: RSI oscillating 44-60 range—neutral with minor divergences forming. Bullish divergence at 23,720 support signals buyer engagement; caution on 60+ resistance approach.
Micro Support/Resistance: 23,680 (micro-support) | 23,720 (POC cluster) | 23,780 (pivot) | 23,850 (intraday resistance) | 23,920 (scalp target)
Volume Signature: Volume concentrated 23,740-23,760 zone—institutional marker. Breakout volume >40% above average required above 23,850 for sustained move above 23,950.
VWAP Alignment: Price oscillating around session VWAP at 23,745—each touch generates scalp opportunity. Upper VWAP band at 23,880; lower support at 23,680.
### 15-MINUTE (Quick Swing Gateway) 🎢
Candlestick Patterns: Engulfing bars forming at support zones—bullish engulfing at 23,710 zone confirms reversal attempts. Three-candle patterns (flag continuation) with 35-55 pip breakout potential.
Harmonic Pattern Recognition: Gartley Pattern potential completion near 23,700-23,750 PRZ (Potential Reversal Zone). Exceptional risk-reward at 1:3.2 for harmonic traders. Butterfly variant also forming at secondary levels.
Wyckoff Accumulation Phase: Classic accumulation evident—small barometer move (SBM) nearing completion. Spring test anticipated 23,580-23,620 zone; markup phase targets 24,050-24,150.
Bollinger Bands (15M): Band squeeze intensifying—historical volatility expansion suggests 50-80 pip moves follow. Upper band resistance at 23,920; lower band support at 23,620.
Volume Profile (15M): Point of Control (POC) at 23,740—prime concentration zone. Volume surge >50% required confirming breakout above 23,900. Imbalances favor upside probability.
Ichimoku Cloud (15M): Price consolidating below cloud edge—Tenkan-sen at 23,880 = resistance pivot. Kijun-sen (23,820) = critical secondary support. Cloud support 23,650-23,700.
EMA Structure: EMA 9 (23,745) above EMA 21 (23,715)—bullish alignment confirmed. Price remaining above both = intraday strength maintained.
### 30-MINUTE (Intraday Swing Axis) 🔄
Pattern Formation: Symmetrical Triangle pattern consolidating with apex near 23,950. Ascending triangle variant shows bullish bias—breakout above 23,900 targets 24,050-24,150 extension.
Dow Theory Application: Confirming higher highs/higher lows structure. Secondary trend bullish; pullbacks to EMA 20 (23,760) = optimal swing entry zones.
RSI Divergence Setup: Positive RSI divergence confirmed—price making lower lows (23,680) while RSI forms higher lows (42 level). Classic reversal setup targeting 23,950 minimum.
Exponential Moving Average: EMA 9 (23,760) = core support. EMA 21 (23,715) = secondary support. EMA 50 (23,600) = structural hold level. Bullish ribbon alignment intact.
Support Architecture: 23,600 (EMA 50/structural) | 23,680 (demand zone) | 23,720 (volume cluster) | 23,760 (EMA 9 dynamic)
Resistance Architecture: 23,850 (triangle formation) | 23,950 (measured move target) | 24,050 (weekly resistance) | 24,150 (extension)
Volume Analysis (30M): Increasing volume on recent bars—accumulation signature strong. Buy volume exceeding sell volume confirms institutional interest.
### 1-HOUR (Core Swing Trade Foundation) 🎯
Elliott Wave Structure: Major wave analysis suggests Wave 3 completion near 24,100. Current Wave 4 correction targets 23,750-23,850 support zone. Wave 5 impulse anticipated—target: 24,300-24,450.
Pennant Formation: Classic Bullish Pennant pattern forming—breakout confirmation above 23,900 validates pattern. Pole height measured move = 24,200+ target.
Bollinger Bands (1H): Upper band at 24,050 = squeeze breakout target. Middle band (23,900) = bullish support. Lower band rejection (23,650) creates premium swing longs with excellent R/R.
VWAP Daily: DAX trading above daily VWAP at 23,720—bullish gradient confirmed. Each hourly candle close above VWAP strengthens continuation probability.
Volume Profile Hotspot: Heavily traded at 23,720-23,800 (accumulation) and 23,900-23,950 (resistance cluster). Imbalances above 24,000 suggest vacuum-fill potential.
Ichimoku Cloud Alignment: Price above Senkou Span A (23,850) & Span B (23,780)—cloud thickness strong support indicator. Chikou Span above candles = bullish confirmation. Cloud color: BULLISH GREEN.
Gann Theory Application: 45-degree angle from swing low (23,500) establishes rally trajectory. Resistance at 38.2% Fibonacci extension (23,950) precedes aggressive breakout phase.
Support Tiers 1H: 23,600 (structural hold) | 23,700 (EMA support) | 23,750 (Kijun-sen) | 23,800 (accumulation zone)
Resistance Tiers 1H: 23,900 (breakout trigger) | 23,950 (extension) | 24,050 (major level) | 24,150 (impulse target)
### 4-HOUR (Swing Trade Thesis Foundation) 💼
Inverse Head & Shoulders Pattern: Potential IH&S formation completing—left shoulder (23,450), head (23,350), right shoulder completing (23,550-23,650). Neckline breakout at 23,900 targets 24,100-24,250 extension.
Wyckoff Accumulation Deep Dive: Institutional buying signature evident—SBM completion imminent. Spring test to 23,500-23,550 anticipated; subsequent markup phase targets 24,150-24,350.
RSI 4H Analysis: RSI at 58-68 range—bullish bias maintained. Room for upside extension without extreme overbought. RSI above 75 targets 24,200+; below 35 = defensive posture required.
Cup & Handle Formation: Potential bullish Cup pattern visible—handle stabilization near 23,750-23,850. Breakout above handle (23,950) targets cup depth extension = 24,150-24,250.
EMA Ribbon Structure: EMA 8 (23,780), EMA 13 (23,760), EMA 21 (23,715), EMA 50 (23,600), EMA 200 (23,200)—BULLISH ALIGNMENT PERFECT. Compression/expansion cycles identify momentum phases.
Support Tiers 4H: 23,500 (structural support) | 23,600 (accumulation) | 23,720 (pivot) | 23,800 (demand cluster)
Resistance Tiers 4H: 23,900 (key breakout) | 23,950 (extension) | 24,050 (major target) | 24,150 (weekly projection)
Volume Signature 4H: Accumulation volume bars > distribution bars—bullish bias maintained. Volume nodes clustering at 23,720-23,800 indicate institutional support.
### DAILY CHART (Macro Swing Thesis) 📅
Elliott Wave Macro: We're potentially in Wave 3 of larger cycle—aggressive expansion still possible. Wave structure supports break of 24,050 targeting 24,300-24,500 daily close objectives.
Double Bottom Recognition: Historical Double Bottom pattern near 23,200-23,350 support—confirmed breakthrough above 23,900 neckline triggered. Second target near 24,200-24,300.
Bollinger Bands Daily: Upper band at 24,300 = realistic daily target. Mean (23,950) = healthy pullback support. Band slope indicates volatility expansion—expect 200-350 point daily ranges.
Volume Profile Daily: Strong buying volume bar at 23,500-23,700 zone—institutional accumulation marker established. Selling volume decreasing significantly—demand controls trend.
Ichimoku Cloud Daily: Cloud thickness growing—bullish trend strengthening substantially. Cloud support around 23,700-23,850 zone. Kumo breakout anticipated—targets cloud top at 24,000-24,100.
Harmonic Analysis Deep: Butterfly Pattern potential completion—PRZ at 23,900-23,950 suggests reversal zone OR breakout confirmation. Confluence amplifies probability of extension.
Gann Angles & Fibonacci: 50% retracement (23,600) + 61.8% extension (24,100) = key reversal zones. Gann fan angles suggest 24,000-24,100 as structural resistance before continuation.
Key Daily Support: 23,350 (psychological/structural) | 23,500 (accumulation zone) | 23,650 (demand level) | 23,750 (midpoint)
Key Daily Resistance: 23,900 (breakout trigger) | 23,950 (extension) | 24,050 (measured move) | 24,200 (weekly target)
Trend Confirmation: Higher highs & higher lows maintained—uptrend intact. Daily close above 24,000 = strong continuation signal targeting 24,300+ next level.
## 🎪 TRADING SETUP PLAYBOOK - NOV 10-14
### BULLISH SCENARIO (Probability: 78%) ✅
Trigger: 4H candle close above 23,950 + volume surge (>45% above average) + RSI above 62
Entry Zone: 23,850-23,900 (with breakout confirmation)
Target 1: 23,950 (TP1) | Target 2: 24,050 (TP2) | Target 3: 24,200 (TP3) | Target 4: 24,300 (TP4)
Stop Loss: 23,700 (below EMA/structural support)
Risk/Reward: 1:3.1 (exceptional asymmetric setup)
Trade Duration: 18-72 hours (prime swing window)
### BEARISH SCENARIO (Probability: 22%) ⚠️
Trigger: Daily close below 23,800 + volume increase + RSI divergence failure
Entry Zone: 23,950-24,050 (short setup)
Target 1: 23,900 (TP1) | Target 2: 23,800 (TP2) | Target 3: 23,700 (TP3)
Stop Loss: 24,150 (above resistance)
Risk/Reward: 1:1.6 (acceptable but lower probability)
Trade Duration: Watch for trend reversal confirmation first
## ⚠️ VOLATILITY & OVERBOUGHT/OVERSOLD CONDITIONS
Current Volatility Status: Moderate compression → Expect significant expansion imminent
5M/15M RSI: 44-60 range (neutral)—room for 20-40 point movements | Scalp target zones
30M/1H RSI: 52-68 range (bullish bias, safe zone)—sweet spot for swing entries
4H RSI: 58-72 range—approaching caution zone but room to extend | Safe for core swings
Daily RSI: 62-75 range (approaching extremes)—be defensive if daily RSI>78 | Take profits aggressively
Overbought Recognition Points:
RSI daily >77 combined with upper Bollinger Band rejection = immediate profit-taking
Ichimoku cloud top penetration fails (bearish candle rejection) = trend exhaustion signal
Volume declining on breakout attempt = false breakout warning signal
Harmonic pattern PRZ exact hit without follow-through = reversal likely imminent
Oversold Bounce Setups:
RSI 1H <32 on support touch = high-probability bounce back to 23,900-23,950
Price below EMA 50 (23,600) + RSI <30 = aggressive accumulation zone
Spring test below 23,550 with volume surge = Wyckoff spring reversal trigger
Harmonic pattern PRZ support bounce = measured move extension targets activated
## 🎯 ENTRY & EXIT OPTIMIZATION STRATEGY
### OPTIMAL ENTRY TIMING
For Scalpers (5M): RSI bounce from 42-48 zone after Band lower touch = 15-25 point scalp (1-3 min holds)
For Quick Swings (15M-30M): 15M candle close above 23,850 with 4H alignment = 80-120 point swing (30 min-2 hour holds)
For Core Swings (1H-4H): 4H pennant breakout above 23,950 on volume = 200-350+ point target (hold 12-48 hours)
For Position Swings (Daily): Daily close above 24,050 = continuation play targeting 24,200-24,300 (hold 5-7 days)
Best Entry Windows: Frankfurt open (7:00 CET), London open (8:00 CET), NY open (14:30 CET)
### EXIT STRATEGIES & PROFIT TAKING
Take Profit Levels: TP1: Fibonacci 38.2% (23,950) | TP2: Harmonic PRZ (24,000) | TP3: Daily Band upper (24,150) | TP4: Weekly target (24,300)
Stop Loss Placement: Always below most recent swing low + 15 points (strict risk management priority)
Trailing Stops: Activate at TP2—trail with 35-45 point buffer for 4H+ trades (lock in profits)
Breakeven Exit: Move stops to entry after 1:1 risk/reward achieved—eliminate emotional trading
Partial Profit Strategy: Close 25% at TP1 | 25% at TP2 | 25% at TP3 | Let 25% run to TP4 (maximize winners)
## 🔔 REVERSAL & BREAKOUT RECOGNITION CHECKLIST
### REVERSAL SIGNALS TO MONITOR:
RSI positive divergence (lower price lows, higher RSI lows) = bullish reversal setup high probability
Candlestick engulfing patterns at support/resistance zones = trend reversal confirmation strong signal
Volume profile breakdowns (declining volume on breakout attempts) = false move warning immediate
Ichimoku Cloud rejection (price fails to penetrate cloud layer) = structural resistance confirmed
Harmonic pattern completion at exact PRZ = reversal zone probability increases significantly
Elliott Wave 5th wave failure (truncation) = impulse completion = reversal imminent trigger
Gann angle break through significant angle = trend line break = reversal trigger activated
### BREAKOUT CONFIRMATION RULES:
Close beyond resistance with >40% volume surge above average = confirmed breakout signal strong
RSI crosses above 60 for bullish breakout, below 45 for bearish breakout confirmation
VWAP alignment with directional move = institutional participation confirmation strong
Bollinger Band breakout with band expansion (squeeze release) = volatility expansion confirmed immediate
Multiple timeframe confluence (5M + 15M + 1H + 4H aligned) = highest probability setup attainable
Ichimoku Cloud break (price clears all clouds with bullish candles) = strong continuation signal
Volume imbalance (ask volume > bid volume) = directional sustain likelihood increases significantly
## 💡 WEEK FORECAST SUMMARY - NOV 10-14
Monday (10th): 🌍 Consolidation continuation near 23,750-23,850 zone. Range-bound trading anticipated. Early breakout direction watch crucial. Entry setups favor reversal plays at support.
Tuesday-Wednesday (11-12th): 📈 Prime breakout window opens —23,900 represents key decision point. Expect 150-250 point daily volatility. Breakout confirmation targets 24,000-24,050 extension. This is the optimal swing trade window.
Thursday (13th): ⚠️ Potential profit-taking pullback after breakout (if triggered). Support retest of 23,950-23,850. Buying opportunity if pullback holds above 23,750.
Friday (14th): 📊 Weekly close pattern formation critical. Extension run anticipated if above 24,050. If above 24,100 = week target 24,200-24,300 achieved. End-of-week positioning for next week.
## 📍 CRITICAL CONFLUENCE ZONES - KEY TARGETS
23,500-23,550: Major support zone (accumulation marker, Wyckoff spring area, structural hold)
23,650-23,750: Secondary support (EMA 9, demand cluster, psychological level, volume POC)
23,800-23,850: Micro-resistance cluster (consolidation squeeze zone, early breakout resistance)
23,900-23,980: KEY BREAKOUT ZONE (triangle apex, harmonic confluence, all timeframe resistance)
24,000-24,100: Primary upside target (Elliott Wave 5, daily Band upper, measured move extension)
24,150-24,250: Secondary extension target (Gann level, macro resistance, wave projection)
24,300+: Weekly/monthly target (if wave 5 impulse extends beyond base projections)
## 🏆 RISK MANAGEMENT RULEBOOK
✅ 1) Position Sizing: Never risk >2% of account equity per single trade
✅ 2) Risk-Reward Ratio: Minimum 1:2.5 R/R on every entry—1:3+ preferred for swing trades
✅ 3) Profit Scaling: Close 25-50% at 1:1 ratio, let remainder run to 1:2+ targets
✅ 4) Stop Loss Discipline: Place stop IMMEDIATELY on entry—no exceptions (15-20 points tight)
✅ 5) Breakout Confirmation: Avoid FOMO—wait for candle close confirmation + volume surge always
✅ 6) Daily Support Respect: Psychological holds (round numbers 24,000) matter—trade confluence not against
✅ 7) Time Management: Exit losing trades quickly (max 1:0.5 acceptable for educational losses)
✅ 8) Macro Alignment: Always check daily/4H bias before taking 1H or lower trades
## #GER40 #DAX #DAXINDEX #TRADINGSETUP
#TECHNICALANALYSIS #ELLIOTTWAVE #HARMONICPATTERN #BREAKOUTTRADING
#SWINGTRADER #DAYTRADING #INTRADAY #INDICES #TRADINGVIEW
#BOLLINGER BANDS #RSI #ICHIMOKU #VWAP #TRADINGSTRATEGY
#WYCKOFFMETHOD #GANNTHEORY #DOWTHEORY #TECHNICALS #ANALYSIS
#SUPPORTANDRESISTANCE #VOLUMEANALYSIS #OVERBOUGHT #OVERSOLD #REVERSAL
#STOCKINDEXTRADING #GERMANYINDEX #BREAKOUTSETUP #TRADERSOFTWITTER
#TECHNICALTRADER #CANDLESTICK #PATTERRECOGNITION #CHARTANALYSIS #DAYTRADER
## 🎁 BONUS: DAILY PRE-MARKET CHECKLIST
Use this every morning before market open:
☑️ Check daily RSI (should be 60-70 for bullish bias continuation)
☑️ Identify support/resistance zones (23,700 | 23,850 | 23,950 | 24,100)
☑️ Verify 4H chart alignment (pennant/IH&S pattern status update)
☑️ Check Ichimoku cloud position (above/below = trend confirmation signal)
☑️ Review 1H Elliott Wave count (which wave are we trading exactly?)
☑️ Scan volume profile (POC = likely rejection zone area)
☑️ Set entry orders + stop losses BEFORE Frankfurt market opens
☑️ Plan 3 Take Profit levels before entering any position
☑️ Monitor economic calendar (ECB events, German data releases)
## 🌐 EUROPEAN SESSION NOTES
The DAX trades primarily during Frankfurt hours (7:00-17:30 CET) . Highest volatility typically occurs:
Frankfurt Open (7:00-8:00 CET): Initial direction breakout—watch for 50-100 point moves
London Overlap (8:00-12:00 CET): Prime trading hours —best liquidity + volatility combination
NY Open (14:30 CET): Secondary volatility surge—often confirms/reverses DAX direction
💡 Disclaimer: This technical analysis is educational only. Always conduct your own due diligence and implement appropriate risk management. Past performance does not guarantee future results. Trade responsibly within your risk tolerance. Use stop losses on every position. Not financial advice.
Analysis Created: November 8, 2025 | Valid Through: November 14, 2025 | Updated Daily
SMART MONEY CONCEPT (SMC)🚀 Technical Analysis – XAU/USD (15m, SMC)
The market swept sell-side liquidity 💧, triggering SL before showing a potential Change of Character (ChoCh) 🔄.
The key area is the 1H Order Block (4,052) 📍, where we expect a rejection ✅ after the fake out.
✨ Setup:
• 📌 Entry: 4,052
• 🛑 SL: 3,984
• 🎯 TP: 4,270
• 📈 R/R: 1:3
💡 This move follows the institutional narrative: Accumulation → Fake Out → Mitigation → Bullish Distribution.
🔥 Motivational message:
“Remember trader: institutions hunt liquidity before revealing the true move. Stay patient, trust your setup, and let the market work for you.
GOOD LUCK TRADERS… 🔥 🙌

MMC / Marsh % McLennan / Seasonality & FractalMy analysis gives me a hint that MMC could go up to the marked area. The upmove, from aseasonality point of view could finish around beginning of December.
After reaching the price and time downlside is coming. The bearhish period in PE+2 year should bring price down to break the double low until end of April 2026.
This is not a tradecall nor financial advice. Good Luck
I d be happy to see your comments on this and some "rockets" (but keep in mind: Space is Fake!!)
Cheers!

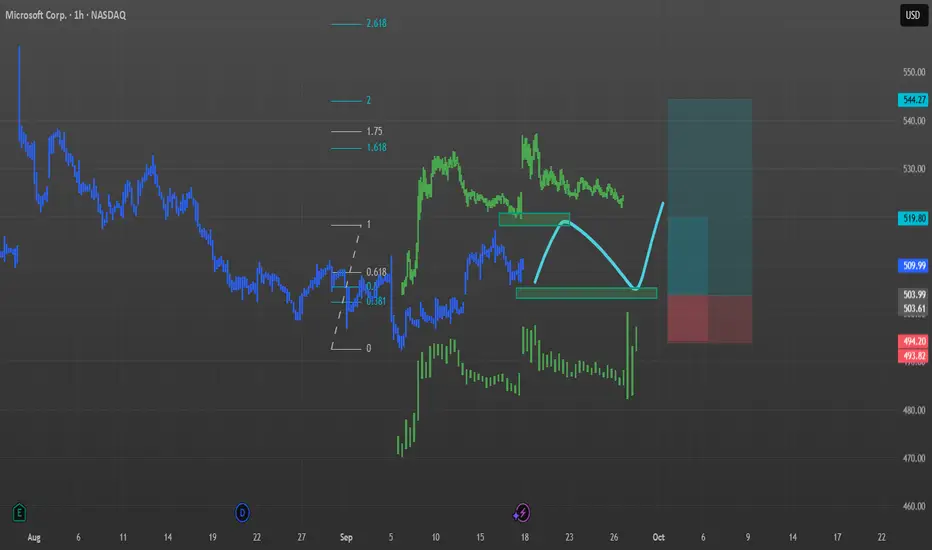
MSFT / MICROSOFT / Fractal and Seasonality inspiredHere is my view on MSFT from seasonal and fractal point of view.
Price gonna break the recent 516 high, shall turn and break recent 505 low than head upside for end of the year ralley.
i put 2 Longs into the chart. Smaller for first partial take profit and the larger one for rest.
All this should play out until 15th of November or latest until End of January.
After January 2026 downside. Be careful!
(This is not a trade call, just educational analysis, trade at your own risk)
Feel free to comment so we can learn and improve together!
Cheers!
FAST / FASTENAL / Long scenario / Fractal & SeasonalityMy view from a seasonality standpoint:
Bullish time ahead until around mid of december. Maybe one little dip lower before the action starts.
my view basted on a fractal analysis:
uncertain about on emore breaking the low but then upside at least to the former high.
*this is not a trade vall nor is it financial advice. think and trade for yourself and on your own discretion and risk

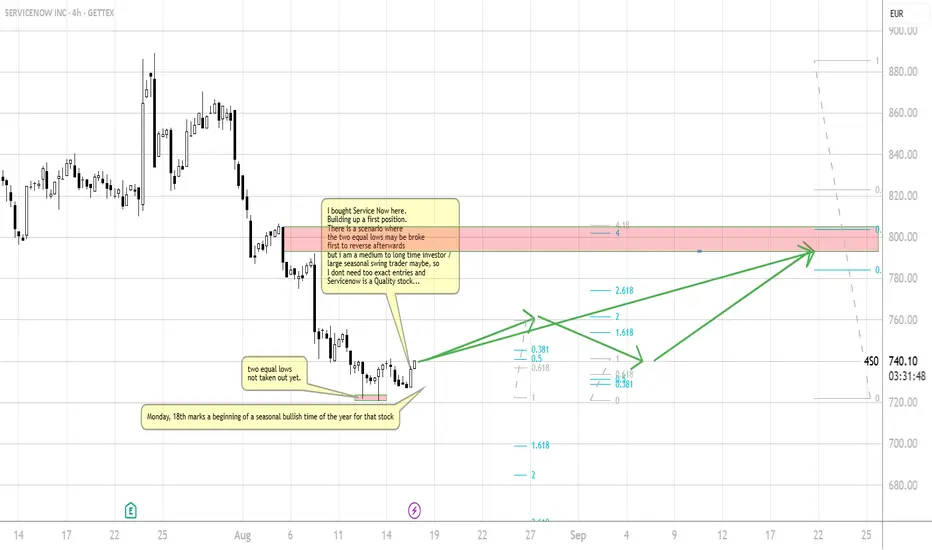
NOW Servicenow Service Now - Long scenarioI bought Service Now here.
Building up a first position.
There is a scenario where
the two equal lows may be broke
first to reverse afterwards
but i am a medium to long time investor /
large seasonal swing trader maybe, so
I dont need too exact entries and
Servicenow is a Quality stock...
this is not a trade call, no financial advice. for educational purpose only....
I d be happy about a like/rocket or comment and a chat with you guys!
BTC 4HBullish movement imminent, looking for the liquidity zone at $120,400. 🖤😎
Bullish divergence in formation

GBPUSD - Still Bullish - Dont trap your self ! Hi Guyz, welcome to other episode of analysis for GBPUSD.
From our 1H chat, it is seen that as per DOW Theory, the market has broken the HL and it seems like market has entered into the bearish trend However, the catch is there is no divergence followed by the break of HL. It implies that market is taking a corrective move, which is 50 percent of FIB level. Thus, there is a formation of AB=CD harmonic pattern.
we plan our entry on the break of "B" point and projected TP in our case is "D" point.
stop loss is placed beneath HL as marked.

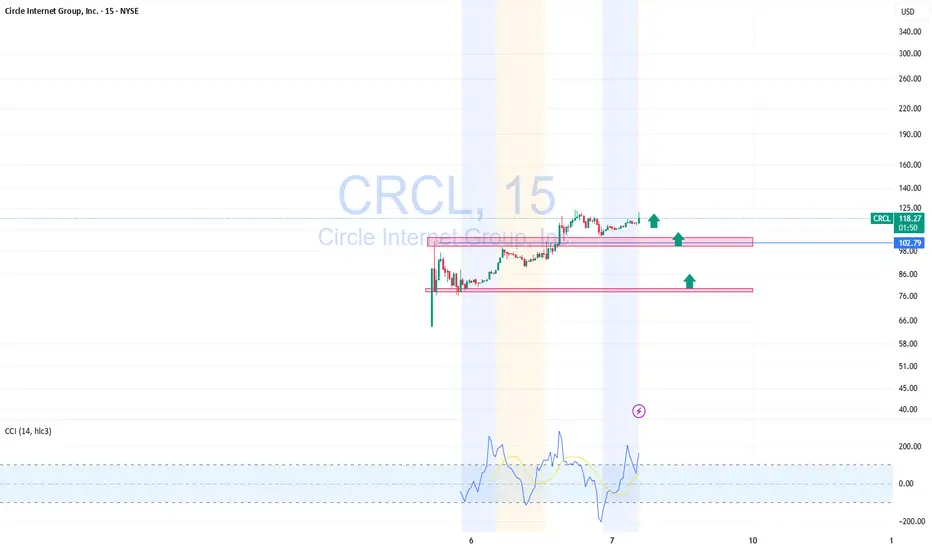
Buying CRCL after IPO — expecting a strong move like SEZLCRCL just hit the market after its IPO and is already showing signs of strength. This setup reminds me a lot of SEZL — after it went public, we saw a strong consolidation phase followed by a confident rally.
Right now, CRCL looks like it’s building a solid base. I'm starting to buy around current levels, expecting demand to grow. As long as the structure holds and buyers stay active, I see a good chance for continuation to the upside.
New IPOs like this often attract attention, and I’m treating it as an early opportunity. Same playbook as SEZL — patience and positioning.
Bitcoin Daily Technical Overview (BTC/USD)Currently, Bitcoin (BTC/USD) is trading around $104,800. Up slightly but still digesting a sharp reversal that rattled short-term bulls.
Recent Price Action: Rejection From $112K
Back on 22nd May, Bitcoin surged to a new high near $112,000, fueled by bullish momentum, institutional flows, and strong on-chain accumulation. However, that breakout was swiftly rejected, and BTC fell as low as $103,400.
This kind of "bull trap" reversal highlights a few key dynamics:
1) Overextended sentiment: The rally above $110K was not supported by volume or follow-through, suggesting exhaustion.
2) Profit-taking by large holders or institutions likely triggered a cascade of stop-losses, accelerating the decline.
3) Liquidation clusters in leveraged long positions likely exacerbated the drop.
Bitcoin is now attempting to reclaim stability around the $104K–$105K range.
🔍 Technical Snapshot
- Support Zones at $103,000 and $93,200
- Resistance Levels at $112,000 (ATH)
Price is still above the 50 & 200-day SMAs, which could be a bullish longer-term signal.
In addition, the price remains above the upper band of the cloud, but momentum is stalling. A decisive bounce off the cloud could reignite bullish sentiment. Or falling into the cloud could trigger more uncertainty and downside.
Macro tailwinds: Concerns over U.S. fiscal stability and potential Fed rate cuts could keep Bitcoin attractive as a non-sovereign asset.
📈 Projection Scenarios
Bullish Case:
If BTC consolidates above $107K, we could see another attempt and retest of $112K.
Bearish Case:
Failure to hold above $103K could see Bitcoin revisit $100K, and if that breaks, downside opens toward the $93K level.
🧭 Insight & Takeaway
The current reversal serves as a healthy reminder that no trend goes up in a straight line. Especially not in crypto.
It likely shook out overleveraged longs, reset sentiment, and may give the market room to breathe before the next leg up.
The long-term trend remains intact, but expect more volatility before any clean break to new highs.
Always DYOR and DYODD and manage your risk.

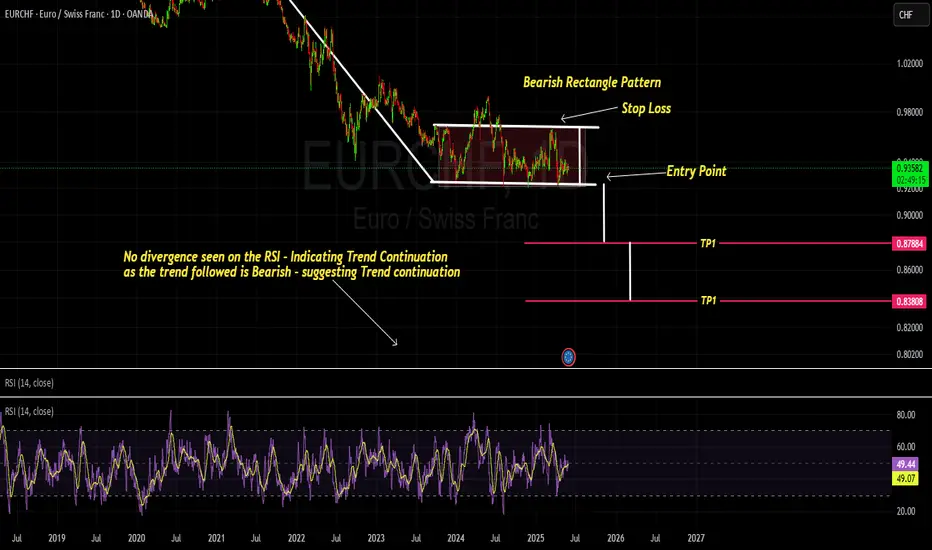
EURCHF - Bearish Rectangle Pattern Market is marking series of LH and LL and then consolidate, forming a rectangle pattern. Projected TP1 and TP2 are given below with the entry point marked with SL above the rectangle pattern.
GBPNZD- Bearish Wedge Pattern - SHORT SELL GBPNZD ; after series of HH and HL, now is the time for the market to take some reversal. market has formed divergence on 30 M time frame. we can see formation of Bearish Wedge patter which is a strong indication of up-trend getting weaker.
Once, market breaks the LH we can enter into the market. we have got projection on the charts (thanks to wedge pattern)
we have 4 TPs with a R:R of 1:1, 1:2 , 1:3 and 1:4 respectively.
SL is placed slightly above last LH.

Gold May Drop Further Below the $3,200 Level in the Short TermGold (XAU/USD) faces the risk of a deeper decline if the following factors continue to develop unfavorably for the precious metal:
📌 1. Continued Improvement in US-China Relations
• The joint statement between the US and China has eased trade tensions.
• If both sides announce more concrete agreements or actions (such as tariff reductions or market access), safe-haven demand may weaken significantly, leading to gold sell-offs.
📌 2. Sustained Strength in the US Dollar
• The USD is strengthening on expectations that the Fed will maintain higher interest rates for longer.
• Capital continues to flow into the USD rather than gold, especially as US bond yields rise.
📌 3. Lack of Supportive News for Gold
• Geopolitical risk factors have temporarily subsided.
• Inflationary pressure is no longer strong enough to support gold prices as before.
📉 Key Support Levels Ahead
If gold breaks below the $3,200 level, the next potential support zones include:
• $3,185 – a recent short-term low (if applicable)
• $3,160 – $3,170 – a technical support confluence zone
• $3,140 – a strong psychological support level, and a potential target if a sell-off intensifies
⚠️ Recommendation
• If gold decisively breaks below $3,200 with rising volume and continued positive developments in US-China trade, the downtrend could accelerate.
• Traders should monitor the $3,195–$3,200 range closely to assess whether to expand short positions.

CRAIUSDT - An interesting coin!CRAI token is a part of Cryptify AI project
Cryptify AI uses AI and blockchain to analyze influencer performance on social media, helping businesses make more accurate and transparent marketing decisions using the CRAI token.
A strong and interesting project with a unique idea.
On the chart, it has formed a descending channel, and the 0.236 resistance has been broken on the 3-day chart.
The price movement is expected as shown in the chart
Best regards Ceciliones🎯

Usd/Jpy - Key level incoming!USD/JPY Technical Analysis – Reaction at the Lower Trendline
Analysis of USD/JPY, we can see a clear reaction from the upper trendline, which has been tested multiple times before the current price decline after the false break on january 25.
By cloning this upper channel trendline and projecting it downward, I have identified a potential support level where the price may react.
This method provides a logical expectation that the market will respect the parallel structure. I am looking for confirmation in this area before considering a position. If i see a strong reaction and signs of strength from the projected trendline, it could present a solid entry opportunity for potential upside.
As always, I am closely monitoring price action and waiting for confirmation signals before making a decision. Risk management is key, and I will use a well-placed stop-loss in case the market breaks through the projected support.

Long term fot ETH could look insaneLooking at the long-term for ETH and assuming that we're putting 5 waves of i, of the highest degree of trend, we could be on an orgasmic wave 5 that IF equal to 1, which is often the case, could reach highs which go past the moon, on to Jupiter and beyond. Keep an eye on it, and let's see if the minor degree of trend of subsequent waves gives us confirmation. Follow for more.

AUDUSD - What message will the Federal Reserve's dotplot have?!The AUDUSD currency pair is below the EMA200 and EMA50 in the 4H timeframe and is moving in its downward channel. In case of a valid failure of the channel ceiling, we can see the supply zones and sell within those zones with the appropriate risk reward. If the downward momentum decreases, we will look for buy positions on the midline and bottom of the channel.
Investors are cautiously anticipating the key decisions from the U.S. Federal Reserve’s upcoming policy meeting. It is widely expected that the central bank will announce its third rate cut of the year and provide projections for 2025.
Giovanni Staunovo, an analyst at UBS, noted that market participants are eagerly awaiting updates from the Federal Open Market Committee (FOMC) and any hints regarding the trajectory of future rate cuts. He stated, “We expect the Federal Reserve to implement a 25 basis point rate cut this week, followed by four additional cuts next year.”
The Federal Reserve’s two-day meeting is anticipated to confirm a quarter-point rate reduction while also providing updated projections for potential rate cuts in 2025 and possibly 2026.
Meanwhile, the U.S. services sector has expanded at its fastest pace since October 2021, injecting fresh momentum into the economy, even as the manufacturing sector faces a deeper downturn. The S&P Global services index rose from 56.1 to 58.5 in December, while the manufacturing PMI fell to 48.3, marking its lowest level in 55 months.
These figures highlight a widening gap between sustained growth in the services sector and further declines in manufacturing. Factory output and order volumes have dropped at a faster pace, while the cost of imported raw materials from China has risen due to concerns over potential tariffs from the Trump administration.
Following the release of this data, projections for real private gross investment growth in the fourth quarter dropped from 2.4% to 1.2%, while forecasts for real government spending growth in the same period rose from 2.4% to 2.6%. Additionally, U.S. holiday retail sales for 2024 are expected to reach a remarkable $979 billion.
According to a recent report by Fitch Ratings, declining demand poses the most significant risk to global commodity markets if the U.S. imposes new tariffs and affected countries retaliate.
Fitch has warned that potential U.S. tariffs on China, Canada, and Mexico could weaken global economic growth, particularly in China, the world’s largest consumer of commodities. This could exert significant pressure on base metals, chemical products, and oil markets.
However, Fitch also noted that China’s economic stimulus measures could offset some of this pressure. At the same time, new tariffs on specific goods, such as steel and aluminum, could increase price volatility and disrupt trade routes.
Bloomberg reported that J.P. Morgan believes the upward trend in European government bonds is nearing its end. The firm now views Australia as the next promising market for stronger performance.
Kim Crawford of J.P. Morgan explained that there is limited room for further gains in Europe, as swap markets have already priced in the potential rate cuts by the European Central Bank. He also highlighted that the Reserve Bank of Australia’s stance, which has yet to reduce rates in this cycle, positions Australian bonds for stronger growth compared to other developed markets.

XAUUSD - Gold went below $2700!Gold is below the EMA200 and EMA50 in the 1H time frame and is trading in its descending channel. If we maintain the drawn channel, we can witness the continuation of gold's decline and limited visibility of the bottom of the channel. Within the demand zone, we can buy with a suitable risk reward. In case of valid failure of the ceiling of the channel, it is possible to sell within the supply zones.
Gold demonstrated a strong performance earlier last week, surging nearly $100 from its weekly low and sparking fresh optimism among traders. However, higher-than-expected inflation data and a stronger U.S. dollar reversed the market dynamics, putting renewed selling pressure on precious metals.
The latest weekly Kitco survey revealed that industry analysts are evenly split between bullish and bearish views, with a notable portion of respondents adopting a neutral stance. Meanwhile, retail traders’ optimism for gold remained unchanged compared to the previous week.
Marc Chandler, CEO of Bannockburn Global Forex, stated, “Gold saw an $85 rally in the first three days of the week, likely driven by reports of China’s central bank (PBOC) adding gold to its reserves for the first time in months. The metal reached $2,726 per ounce on the spot market on Thursday, marking its highest level in over a month, but then turned downward.”
He further added, “Some analysts attributed the price decline to stronger-than-expected U.S. Producer Price Index (PPI) data. Nonetheless, gold ended the week on a positive note, breaking its two-week losing streak.”
Chandler also noted, “Since late October, this marks only the second positive week for gold. A cautious approach by the Federal Reserve to rate cuts—indicating that rates will be reduced but further cuts are unlikely next year, with a potential halt to tightening policies in early 2025—could pave the way for another test of the $2,600 level.”
This week, the Federal Reserve is set to hold a two-day policy meeting, with monetary decisions expected to be announced on Wednesday. The central bank is anticipated to reduce the interest rate by 0.25%, bringing it to a range of 4.25%-4.5%. Additionally, the Fed will release its updated “Summary of Economic Projections,” known as the dot plot.
In September, the median Fed officials’ projection for interest rates by the end of 2025 stood at 3.4%. If this forecast is revised down by more than 1%, the U.S. dollar could face immediate downward pressure. In such a scenario, U.S. Treasury yields may decline, boosting gold prices.
Market participants will also closely monitor remarks by Federal Reserve Chair Jerome Powell. Should Powell strike a cautious tone regarding further monetary easing and emphasize a gradual approach, the dollar may maintain its strength against its rivals. Conversely, if he raises concerns about declining labor market conditions and their potential adverse impact on economic growth, the dollar could come under selling pressure.
Additionally, on Thursday, the U.S. Bureau of Economic Analysis will release the final revision of Q3 GDP data, and on Friday, the Personal Consumption Expenditures (PCE) Price Index for November will be published.
Market reactions to the PCE inflation report are likely to remain muted after the Fed’s announcement.
According to Bloomberg, Wall Street is shifting its outlook on the U.S. dollar, as Trump’s policies and the Federal Reserve’s rate cuts in the latter half of 2025 could weigh on the greenback. Analysts from Morgan Stanley to JPMorgan predict that the global reserve currency will peak by mid-2025 and then begin to decline. Société Générale also forecasts a 6% drop in the U.S. Dollar Index by the end of next year.

NAS100 - Nasdaq, the only green index last week!The index is above the EMA200 and EMA50 in the 4H timeframe and is trading in its ascending channel. If the index corrects towards the demand zones, you can look for the next Nasdaq buy positions with the appropriate risk reward. The valid failure of the previous ATH will provide the conditions for the continuation of the rise of this index.
The Economist predicts that as 2025 approaches, the U.S. economy is in a highly favorable position. It expects a soft economic landing in the upcoming year, meaning the U.S. will successfully reduce inflation to its 2% target without harming economic growth. While analysts previously forecasted a recession for the U.S., Washington now stands out as the only major economy whose output exceeds pre-pandemic trends.
This year, the Nasdaq index has significantly outperformed other major U.S. stock market indices. The primary reason is the heavy weighting of tech stocks in the index. Technology stocks, particularly the “Big Seven” tech giants, have seen remarkable growth due to the AI revolution and market optimism.On the other hand, the Dow Jones index, which is more focused on industrial stocks, has lagged behind Nasdaq despite notable gains.
The United States is preparing new restrictions on AI chips to block China’s indirect access to this technology. According to a report by The Wall Street Journal, these restrictions aim to prevent China from using hidden pathways to obtain AI chips. Sources familiar with the plan revealed that the U.S. intends to hold companies like Google and Microsoft accountable for managing access to advanced AI chips.
The most significant economic event this week is the Federal Reserve’s final interest rate decision of 2024, set to be announced on Wednesday. Markets are already anticipating a 25-basis-point rate cut, but attention will focus on the Fed’s policy statement and Jerome Powell’s remarks during the press conference. Traders will look for clues about the Fed’s monetary policy outlook for the upcoming year. Additionally, the Bank of England will announce its interest rate decision on Thursday, which could have a global market impact.
Key economic data on American consumer health will also be released this week. On Tuesday, the November retail sales report will provide fresh insights into consumer behavior during the holiday season. Moreover, on Friday, the Personal Consumption Expenditures (PCE) price index—a key inflation metric closely watched by the Fed—will be released, potentially clarifying the direction of future monetary policy.
Other important economic data include the Empire State Manufacturing Survey and the S&P Global PMI leading index, both set for release on Monday. On Thursday, critical figures such as the final Q3 GDP growth rate, the Philadelphia Fed manufacturing survey, November existing home sales, and weekly jobless claims will also be published.
Analysts expect the Fed to cut rates by 25 basis points this week, but the pace of rate cuts in 2025 is expected to be slow. Due to sticky inflation and some inflationary policies from Donald Trump, economists anticipate only three rate cuts in 2025.
The U.S. dollar has performed impressively this year, supported by the country’s economic conditions. However, Morgan Stanley analysts, including David Adams, believe buying the dollar at this point may be a mistake, as there is a downside risk for the currency. Based on their discussions, many investors expect the dollar index to rise further. Morgan Stanley argues that positive news is already fully priced into the dollar and that markets may be overestimating the speed, scope, and impact of economic measures.

Trading Timeframes: Measured Moves and ContextIn the previous post, we introduced the concept of measured moves, a structured framework for estimating future price behavior. This method is based on the observation that each swing move tends to be similar in size to the previous one, assuming average price volatility remains consistent. While not exact, this approach offers a practical way to approximate the potential extension of a swing move.
A common question that arises is: which timeframe should you use for measured moves, and how do you choose the correct swing move? These questions open up a completely different and important topic.
Imagine analyzing a chart across three timeframes: daily, weekly, and monthly. You’ve projected a viable measured move on each chart. Now, ask yourself: which projection is the correct one? Where is the move most likely to play out?
Daily
Weekly
Monthly
The reality is that there is no singular “correct” answer. The appropriate measurement depends entirely on your purpose as a trader, the timeframe you operate in, and trading style.
The Fractal Nature of Price Action
Price action is fractal by nature. Regardless of whether you’re observing a 30-minute chart, a daily chart, or a weekly chart, the price displayed is the same in real time. However, the purpose of charts is to provide context. Each timeframe offers a unique perspective on how price has developed. For example, a 5-minute chart may reveal details about intraday movements while a daily chart condenses those details into broader a broader structure and context.
These perspectives may align or contradict one another, they can confirm or challenge your biases. The key takeaway is that charts and timeframes are tools to contextualize price, not definitive answers.
Defining Your Trading Timeframe
To navigate the apparent contradictions between timeframes, start by defining your trading timeframe. This is where you analyze price structure, execute trades and define holding periods. This will answer the opening question: measured moves and other tools should in preference align with your trading timeframe.
In case one wants to consider context, for various reasons, then multiple timeframes can be utilized. These act as a complement, not replacement.
Here’s how different timeframes can be used for context.
Higher timeframe: Moving one timeframe up will compress the price data, providing a broader context, but at the expense of detail.
Lower Timeframe: Moving one timeframe down will reveal intricate details, but can introduce excessive noise.
The balance between these components should match your trading style. Without a clear and defined approach, there is a risk of confusion and contradictory biases.
The Concept of "Moving in Twos"
Another, more anecdotal observation in price movement is the idea of “moving in twos.” This concept suggests that price often moves in sequences of two swings: an impulse move, followed with a pullback, which then repeats.
There tends to be some price disruption after this has played out, but does not always imply that trend movement must stop after two moves. However, measured moves tend to align more reliably with these sequences.
While not a scientifically validated principle, this concept has been discussed by traders such as Al Brooks, Mack and more. It provides a practical heuristic for applying measured moves more consistently.
Practical Application
To apply these ideas, consider the following:
Define your trading timeframe. Use it as the primary basis for your measured move projections.
If needed, incorporate one higher or lower timeframe to balance context and detail. However, these additional perspectives should not overrule your primary focus.
Think in terms of “moving in twos.” Use this concept to locate sequences.
This post was about the relationship between timeframes and the fractal nature of price action. The focus is on our role as traders and how we decide to operate, rather than absolute answers. This might be clear to most, but if not, take some time to think about and define your trading style.

BTC up to $250K - Remarkably Accurate Projection 2022/25Initial projection from December 12, 2022, ➡️ ⬅️
When the price was at $17K, aimed to predict the bottom of the cycle, but primarily to predict Bitcoin's next all-time high and its timing.
This projection has been spot on!!!
The two-year forecast has proven to be exceptionally and remarkably accurate, demonstrating high credibility.
The analysis employed a multifaceted approach, including these key factors:
- Projected symmetrical parallel channel for price forecasting
- Volume Price Range (VPR) for identifying Points of Interest (POIs)
- Price range (PR) tool, to project the peak from the hypothetical bottom
- Measurement of days between halving events and peaks
- Measurement of days between peaks
- The symmetrical parallel channel , ( Green and Red lines ) derived from previous highs and lows, linking them enabled the projection of a clear symmetrical parallel channel into the future, this channel has proven to be highly predictive of price movements, whenever the price reached the channel's boundaries, it consistently signaled reversals or marked the cyclical highs and lows.
As shown by the three green arrows, the price consistently reversed direction upon reaching the lower boundary of the channel.
The orange arrow points to the most recent bottom, the initial analysis predicted that the bottom would be reached only in January 2023, with a price somewhere between $10K and $12K, which did not materialize, in fact, the bottom was reached in December 2022 a month early, with the price hitting a low of $15K, a slight deviation from the projection."
- Volume Price Range (VPR) ( Combined yellow and blue bar projection ) was employed to identify Points of Interest (POIs) by connecting reversal bottoms to peaks, then red rectangles were projected on the chart to align with these bottoms, indicating potential reversal zones for BTC.
Both projections (Red Rectangles ) accurately predicted a reversal in this zone, whatever in the recent bearish cycle, the exact reversal point was slightly higher than anticipated
VPR indicators remain a valuable tool for forecasting future price movements and identifying key areas of interest, and have proven to be reliable tools for identifying potential reversal zones.
- Price range (PR) tool ( Parallel channel with a white upward projection arrow ), was applied to projected from the December 2022 bottom until it intersected with the upper band ( Red line ) of the symmetrical channel, a level that historically coincided with cycle peaks.
- Measurement of days between halving events and peaks:
2nd Halving on July 2016 to Peak December 2017 +/- 500 days
3rd Halving on May 2020 to Peak November 2021 +/- 500 days
4th Halving on April 2024 to Peak October 2025 +/- 500 days ➡️ Projection ⬅️
The measurement of days between halving events and peaks for the 2nd and 3rd cycles was approximately 500 days, based on the results of the two previous cycles, we observe a potential temporal pattern and correlation between halving events and price peaks.
This correlation is reinforced by our projection, we forecast the peak of the 4th cycle to be around October 2025, occurring roughly 500 days after the halving (16-17 Months ).
Measurement of days between peaks we started by measuring from the December 2017 peak to the November 2021 peak and found that it took 47 months (approximately 1430 days) to reach a new peak, with a price increase of 250%
We then measured the duration from the latest BTC peak in November 2021 to October 2025 which was the month that coincided with our projection of a new peak.
Remarkably, we discovered that this period was identical to the previous cycle at exactly 47 months.
Intrigued and Astonished, we decided to copy and paste the measurements ( Blue Rectangle ) from the previous cycle and were stunned, the range was exactly the same 47 months and approximately 130 days.
And when we thought nothing could surprise us more, to our further amazement, the price increase was a striking 250% the same as before. This uncanny correlation is truly astonishing. What a heel, what is this?
CONCLUSION
The remarkable accuracy of the December 12, 2022 projection underscores the robustness and reliability of the multifaceted analytical approach employed. Multiple coinciding patterns and consistent correlations have converged to validate the forecast, enhancing its credibility significantly.
Symmetrical Parallel Channel: The use of green and red lines to establish a symmetrical parallel channel accurately anticipated price reversals at the channel boundaries. The consistent directional changes upon reaching these boundaries highlight the channel’s effectiveness in signaling cyclical highs and lows.
Volume Price Range (VPR): [ By identifying Points of Interest (POIs) through the combination of yellow and blue bars, the VPR method successfully pinpointed reversal zones. The alignment of red rectangles with these zones accurately forecasted price reversals, reinforcing the tool’s reliability in predicting key market movements.
Price Range (PR) Tool: The projection of the peak from the hypothetical bottom using the PR tool intersected precisely with the upper band of the symmetrical channel. This intersection historically aligns with cycle peaks, further validating the projection model.
Halving Events and Peak Correlation: The consistent interval of approximately 500 days between halving events and subsequent peaks across multiple cycles reveals a strong temporal pattern. Projecting this correlation forward suggests a peak around October 2025, maintaining the established 16-17 month post-halving window.
Measurement of Days Between Peaks: The identical duration of 47 months (approximately 1430 days) between consecutive peaks, along with a consistent 250% price increase, showcases a compelling cyclical pattern. The replication of these measurements in the current cycle with precise alignment adds to the projection’s accuracy.
The convergence of these diverse analytical methods each independently demonstrating high predictive accuracy creates a compelling case for the projection’s validity. The alignment of historical patterns, consistent temporal correlations, and the successful anticipation of recent market movements collectively inspire strong confidence in the forecast.
Projection: Given the synchronized alignment of these multiple indicators and patterns, it is highly plausible that Bitcoin (BTC) will reach approximately $250K by October 2025. This projection not only aligns with historical trends but also exemplifies the power of comprehensive, multifaceted analysis in accurately forecasting cryptocurrency market movements.

NASDAQ, setup for 25k (20% potential)Hello everyone,
based on the major wave 3, we can make a projection to imagine where the global markets could form a major top. In my view we are entering the last stages of the bull run, with a potential of 20% gains to come. After reaching the top, a major bear market could start, but I don't expect the top to be in before at least Q1 of 2025.
What I also want to point out is that we are about to test the very significant last swing high from where wave 4 started. I should be a good zone to start buying again, as we are in a strong bullish trend. If you need confirmation observe this level closely.
