US100: Needs a healthy pullback before breaking highs🧭 SKILLING:US100 (30-Min Chart) – The Market Needs a Pause Before the Breakout
After a strong recovery from the 24,200 area , the US100 has shown an impressive upward acceleration, forming a steep speed line that pushed price back toward the previous highs around 25,150 – 25,250 — a major resistance zone where sellers previously dominated.
However, as price reaches this area, the bullish momentum is starting to fade. Smaller candles and indecisive movements reveal hesitation — buyers are still in control, but the strength that carried the market this far is beginning to weaken.
If we look closely at the market structure, it’s clear that the index has been trying to reclaim the entire prior range, but that effort hasn’t come easy. After such a fast rally, the market looks overextended, and bulls may need a healthy pullback to gather enough energy for a real breakout.
________________________________________
🔍 Technical Outlook
• The 25,150 – 25,250 zone remains the key resistance area. If price keeps getting rejected here, short-term sellers might step in.
• A corrective move toward 24,850 – 24,950 (the pink zone) would not be surprising.
• That area should be watched closely — if buyers defend it strongly, it could become the launchpad for another push toward new highs.
________________________________________
🎯 Personal View
The overall structure still favors the bullish side, but momentum needs a reset.
A short-term pullback shouldn’t be seen as weakness — it’s an opportunity for the market to rebalance before the next leg up.
If the 24,850 zone holds, the probability of a true breakout above 25,250 increases significantly, potentially opening room toward 25,400 – 25,500 in the next sessions.
________________________________________
💬 In summary:
The US100 has worked hard to reclaim lost ground, but breaking above the previous top will require fresh momentum. A short-term correction could be exactly what the market needs to build a stronger foundation for a sustainable rally.
Please like and comment below to support our traders. Your reactions will motivate us to do more analysis in the future 🙏✨
Harry Andrew @ ZuperView
Pullback

EURAUD 4H – Long ideaPrice is bouncing from the lower rail of the 4H ascending channel that aligns with the weekly trendline. After a short liquidity sweep, the structure flipped bullish, and an H4 fair-value gap sits at 1.77–1.78 .
Plan: buy the pullback into the FVG ~1.774 (E: 1.77415). SL: 1.7363 —below the channel base and last swing low. TP: 1.8889 , targeting the channel top/previous supply and full FVG fill. Partial profits can be taken on the way at ~1.825/1.845 . Bias is invalidated on a daily close below 1.74 .

Mr. Wyckoff Is That You? (Pt II) & Pi Cycle Top Trendline on BTCHey Trading Fam,
As the Donald keeps the market gambling and scrambling, I want to step away from the headlines a bit and take a closer look at what our charts might be suggesting. Admittedly, the bias indicated may be somewhat contrarian at the moment. If you're not into that, this video is probably not for you.
It feels like an echo chamber out there with most analysts. Everyone keeps yelling, "Buy the dip! Buy the dip!" But what about a more cautious approach? Maybe it was time to sell the top and preserve your cash? I don't know. Just throwing it out there.
As many of you are aware, we've reached my third and final target on the SPY. I've been talking about 670-700 on the SPY for a couple of years now. It's been hit, and personally (though I am cautiously still trading publicly), I've exited. My goal is to preserve my cash. Maybe I do this through precious metals? Haven't decided yet. But I am happy with the profit I've made to this point and will probably not test fate too much further.
As for crypto, old Bitcoin usually follows our stock market. And we have tracked the SPY for that part. If the market does, in fact, pull back further, I would expect Bitcoin and all of crypto to follow.
I know, I know. But what about that altcoin season? I don't know guys. That may not actually start until next year. I'm not saying this will be the case for sure. But more and more, it sure is looking that way.
Enjoy the vid,
✌️Stew

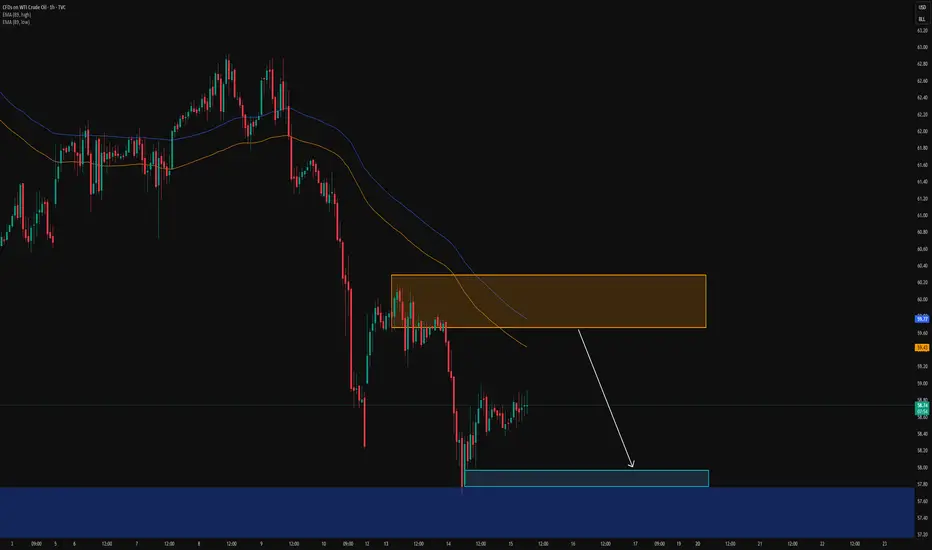
USOIL: Pullback within the correction on the 4h timeframeTo better understand my current outlook on USOIL, please refer to my previous higher-timeframe and fundamental analyses:
* Trend: assessed using at least three trend indicators, with market structure as the primary guide.
** Weak or Reversal Signals: Assessed based on one of our criteria for trend reversal signals.
*** Support/Resistance: Selected from multiple factors – static (Swing High, Swing Low, etc.), dynamic (EMA, MA, etc.), psychological (Fibonacci, RSI, etc.) – and determined based on the trader’s discretion.
**** Our advice takes into account all factors, including both fundamental and technical analysis. It is not intended as a profit target. We hope it can serve as a reference to help you trade more effectively. This advice is for informational purposes only and we assume no responsibility for any trading results based on it.
George Vann @ ZuperView
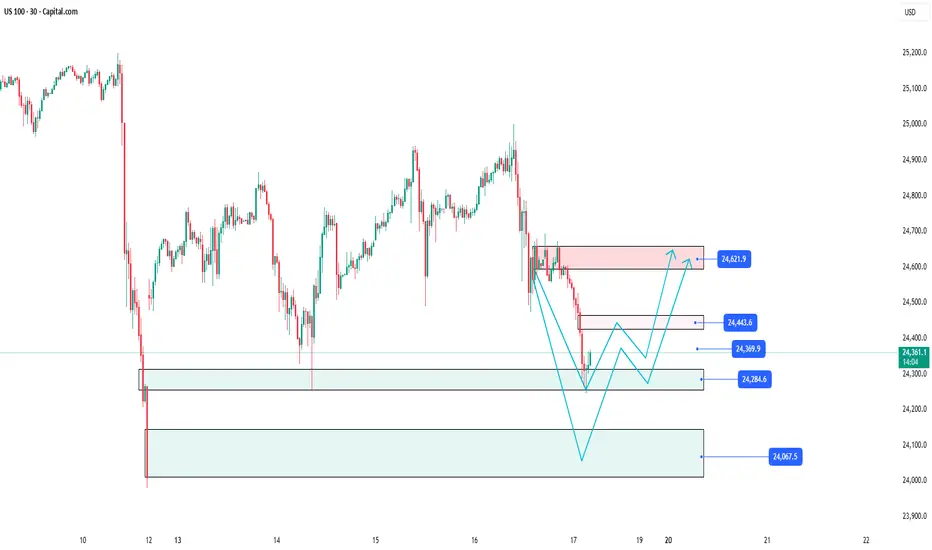
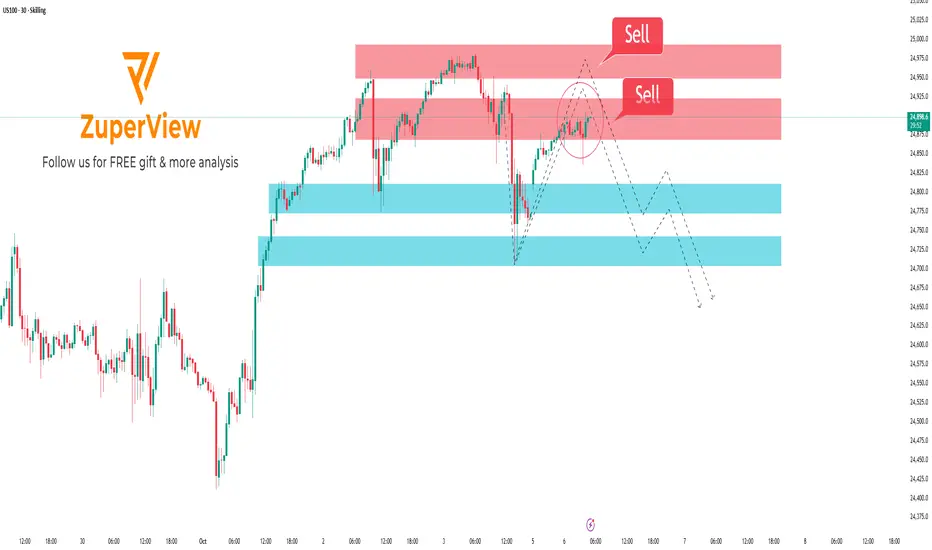
US100: Price action around important imbalance📊 SKILLING:US100 Analysis: Detailed trading scenario at key price level 24,443.6 🚀
The US 100 30-minute chart is currently illustrating a clear picture of price movements with significant support and resistance zones. At the moment, the price is undergoing a strong correction after a deep decline and is approaching crucial price areas, creating multiple potential trading opportunities for investors.
________________________________________
Support Zone 24,284.6 – The starting point for a potential bounce 💥
Currently, the price is nearing the technical support level around 24,284.6 – a key support area that is expected to hold considerable buying interest, potentially triggering a short-term bounce. Buyers may step in here to prevent further declines and initiate a recovery trend.
Careful observation of price action around this zone is essential as it will determine the market’s next momentum: whether the price will rebound or break lower.
________________________________________
Immediate Resistance Levels and the Imbalance Zone at 24,443.6 🔍
Following a bounce from the 24,284.6 support, the expected scenario is a gradual move upwards to test important resistance levels:
• First at 24,369.9, where initial selling pressure may emerge, challenging the upward momentum.
• Next at 24,443.6, identified as a significant imbalance zone on the chart — a price level where price previously moved rapidly, creating a notable supply-demand gap.
• This zone acts as a technical “wall,” a crucial checkpoint before the price can continue its upward trend or get pushed back down.
________________________________________
Detailed Price Movement Scenario 🔄
1. Price bounces from the support at 24,284.6, setting the stage for a recovery leg.
2. Price moves up to test the first resistance at 24,369.9; the reaction here indicates the buyers’ strength.
3. Price then challenges the imbalance zone at 24,443.6 — where significant selling pressure may occur.
4. At this level, two scenarios may unfold:
• Price breaks above 24,443.6, confirming the uptrend and targeting the next resistance at 24,621.9.
• Price rejects this zone, leading to selling pressure that pushes price back to retest the 24,284.6 support or even lower.
________________________________________
Downside scenario if support at 24,284.6 fails 🛡️
In the worst case, if price breaks below the crucial support at 24,284.6, further declines toward a broader support zone at 24,067.5 are likely. This level may act as the next key area for price stabilization and buyer interest before any potential rebound.
Please like and comment below to support our traders. Your reactions will motivate us to do more analysis in the future 🙏✨
Harry Andrew @ ZuperView
BankNifty Trend AnalysisThe chart clearly forms a rounded bottom (cup) from July–October 2025.
The price has just tested the neckline zone (~57,400–57,600), which corresponds to the previous resistance highs from May–July.
A handle (minor pullback) formation is likely before a confirmed breakout above 57,600–58,000.
The recent move from ~54,000 to 57,400 has been steep and relatively uncorrected, suggesting overextension in the short term.
Wait for pullback to 56,000–55,900 zone (20 DEMA).
Look for bullish reversal candle (hammer / bullish engulfing) near that zone.

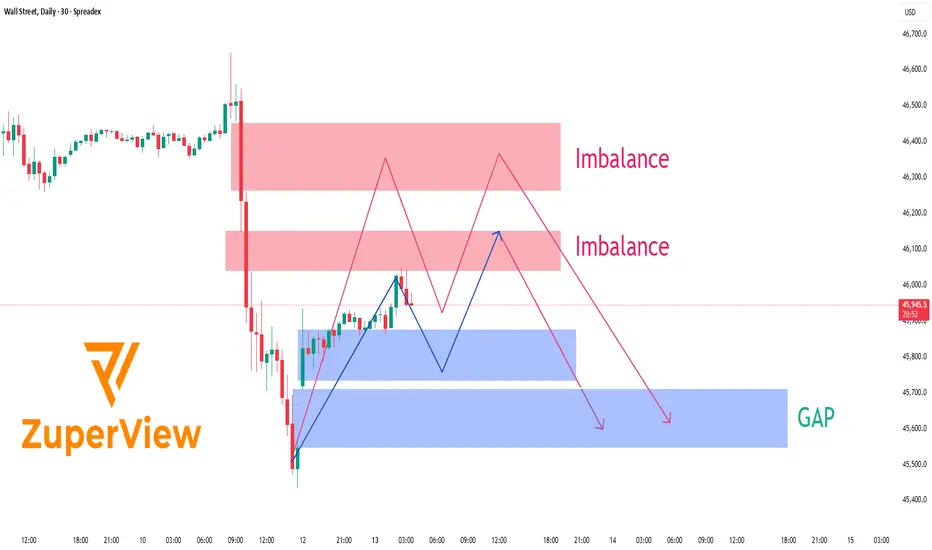
US30: Rebound before the stormTechnical Outlook – Wall Street Index (30-Minute Chart)
After the announcement that the U.S. will impose a 100 % tariff on Chinese imports, Wall Street ⚡ plunged sharply, leaving behind distinct Imbalance zones and an unfilled GAP lurking below current price levels.
At present, price is hovering around 45,950 💵, showing a modest rebound after tapping into a short-term demand zone. Above, two notable Imbalance areas stand out — around 46,000-46,150 and 46,250-46,450 - both formed as aggressive sell orders flooded the market following the latest wave of trade-war headlines 🌍.
The likely scenario 🎯:
Price could continue to retrace upward ↗️ to test one of these supply/imbalance zones before sellers re-enter the market. If selling pressure remains dominant, the index may resume its decline toward the GAP area around 45,500 - 45,650 📉, where liquidity is still unfilled and buyers may look to step back in.
Current price action indicates a corrective pullback rather than a full reversal. Trading volume is thinning 📉, candlestick patterns show signs of exhaustion 🕯️, and the upper imbalance zones remain untouched — all signaling that sellers still hold the upper hand.
________________________________________
🌍 Fundamental Context – U.S. vs. China Tensions Heating Up
On October 10, President Trump officially declared a 100 % additional tariff on Chinese goods, effective November 1, 2025 — the most aggressive move since the 2018-2019 trade war.
Beijing immediately condemned the plan, warning of “corresponding countermeasures”, including restrictions on rare-earth exports and higher port fees on U.S. vessels. While strong in tone, China has so far stopped short of announcing a direct tariff retaliation, signaling a cautious approach while keeping the door open for talks.
Washington, meanwhile, insists the measure aims to “protect American interests and reduce over-reliance on China’s supply chains,” but officials also noted that negotiations remain possible if China shows “substantive goodwill.”
Financial markets reacted swiftly 💥:
• U.S. and Asian equities dropped 2–3 % on average.
• USD strengthened, while gold and JPY rallied as safe-haven flows increased.
• Tech and industrial stocks with strong China exposure saw the largest losses.
Overall, risk sentiment remains fragile as investors brace for a prolonged phase of trade uncertainty.
________________________________________
💡 Trading Summary
Short-term structure favors a sell-the-rally approach. The market may retest upper imbalance zones before resuming its downtrend toward the 45,500 USD GAP area.
If U.S.–China tensions intensify further, downside momentum could accelerate. Conversely, any sign of renewed dialogue or tariff delay could trigger a short-term rebound — but bias remains bearish until the market reclaims 46,300 USD convincingly.
In short: patience, risk control, and reaction to headlines are key this week. ⚖️
Please like and comment below to support our traders. Your reactions motivate us to do more analysis in the future 🙏✨
Harry Andrew @ ZuperView
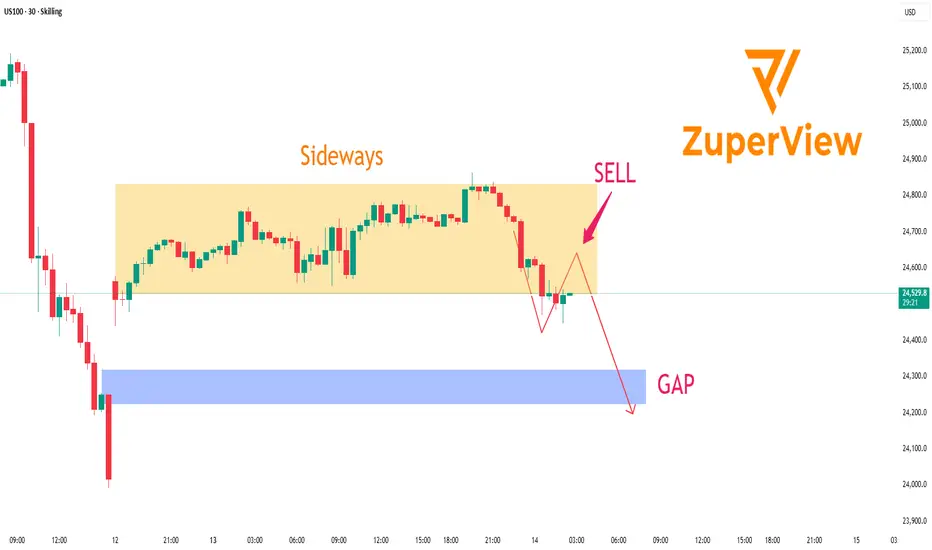
US100: Pullback to fill the GAP below
🧩 SKILLING:US100 – Pullback scenario targeting the GAP support zone
📊 30-Minute Chart Analysis
On the 30-minute timeframe, US100 is showing signs of a short-term corrective move after failing to hold its previous support zone.
Price is currently trading below the Trend indicator’s resistance area, suggesting that sellers have regained temporary control.
After a strong drop, the market is forming a technical pullback to retest the resistance zone. This is often where traders look for opportunities to continue following the prevailing bearish momentum.
________________________________________
🧭 Trading Scenario (For Analysis Purposes Only)
• Potential SELL Zone: 24,650 – 24,740 (resistance and Trend zone)
• Target Area: 24,250 – 24,350 (GAP support area below)
• Invalidation Level: Above 24,750 — if price closes above this level, the short-term bearish structure could be invalidated.
________________________________________
🔎 Technical Outlook
• Short-term trend: Bearish
• Market structure: Forming a pullback–continuation pattern
• Trend indicator: Has flipped bearish, confirming renewed selling pressure
• GAP support: Likely to act as a key area for potential stabilization or reaction from buyers
________________________________________
⚠️ Important Note
This analysis is for educational and informational purposes only and should not be considered financial advice.
Traders should combine this view with their own risk assessment, price action, and macroeconomic context before making any trading decisions.
________________________________________
💡 Summary:
US100 is in a short-term correction phase. If price continues to reject the 24,700 resistance area, the downside scenario toward the 24,250–24,350 GAP support zone remains valid.
________________________________________
Please like and comment below to support our traders. Your reactions motivate us to do more analysis in the future 🙏✨
Harry Andrew @ ZuperView
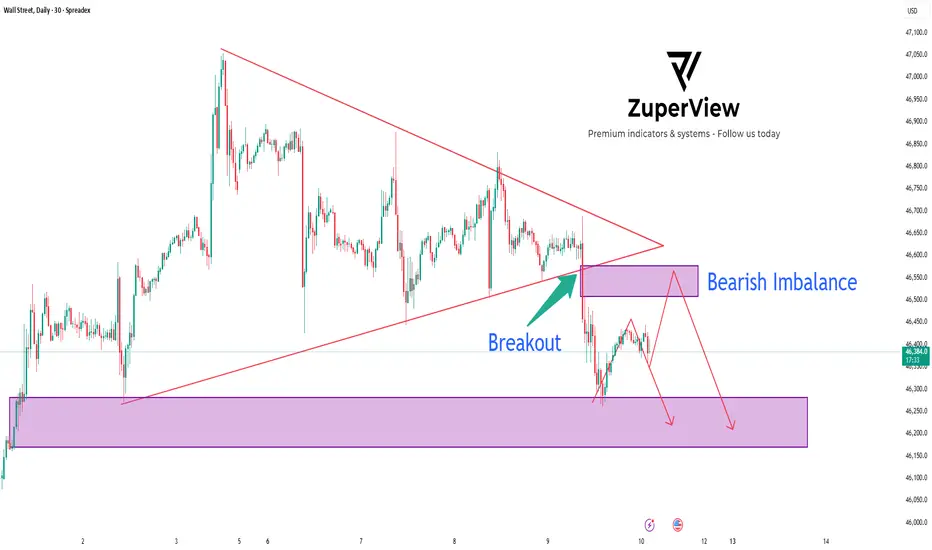
US30: Triangle breakout signal deeper sell move
📉 US30 Analysis: 4-Layer Resistance, Bearish Imbalance & Triangle Breakout | TradingView
The SPREADEX:DJI just printed a clean bearish breakout from a symmetrical triangle pattern on the 30-minute chart 🕒.
What makes this setup stand out is the 4-layer resistance zone perfectly overlapping with a Bearish Imbalance, creating a strong confluence for a potential continuation to the downside.
________________________________________
🧠 Technical Overview
On TradingView, the chart shows multiple lower highs forming inside a symmetrical triangle — a sign of buying exhaustion and seller accumulation. After several attempts, price finally broke below the structure, confirming a bearish market shift.
Key zones:
🔴 4-Layer Resistance: 46,850 → 46,550
⚫ Bearish Imbalance: 46,500 – 46,550
🟣 Demand Zone / Support: 46,150 – 46,250
Each resistance layer acted as a rejection point, showing how Smart Money continues to distribute orders and defend that area aggressively.
________________________________________
📊 Breakout – Retest – Continuation Setup
Following the breakout, price made a quick pullback to retest the 4-layer resistance zone — right where the Bearish Imbalance sits.
This is a textbook Breakout–Retest–Continuation pattern on TradingView, confirming that sellers are still in control.
1️⃣ Breakout: Price breaks below the triangle.
2️⃣ Retest: Price retraces to test the 4-layer resistance and imbalance.
3️⃣ Continuation: Strong rejection signals the next bearish leg.
________________________________________
💡 Trading Plan
Our trading plan for this setup is straightforward. I’m waiting for price to retest the 46,500–46,550 zone and show clear signs of rejection — such as a bearish engulfing candle or a break of structure on lower timeframes.
If confirmed, I’ll look to enter a short position targeting the Demand Zone around 46,150–46,250.
A stop loss would be placed just above 46,650, beyond the resistance cluster, to protect against false breakouts.
This plan aligns perfectly with Smart Money Concept (SMC) and Price Action trading, offering a strong risk-to-reward ratio 📈.
________________________________________
🧩 Market Psychology
✅ The four consecutive rejections at the same price zone clearly show how institutional traders are defending supply levels.
✅ Every time price pushes higher, Smart Money sells into liquidity, leaving wicks and imbalances behind.
✅ This behavior reinforces the bearish bias and supports the idea of a continued drop once short-term liquidity is collected.
________________________________________
🔎 Summary
✅ Bearish breakout confirmed from the triangle pattern
🔴 Strong 4-layer resistance overlapping with Bearish Imbalance
📉 Expecting price to continue toward the lower Demand Zone
This setup is clean, confluence-rich, and ideal for traders using TradingView, Price Action, and Smart Money Concepts.
A well-timed short from this zone could deliver a high-probability trade with excellent structure confirmation 🔥.
Please like and comment below to support our traders. Your reactions will motivate us to do more analysis in the future 🙏✨
Harry Andrew @ ZuperView
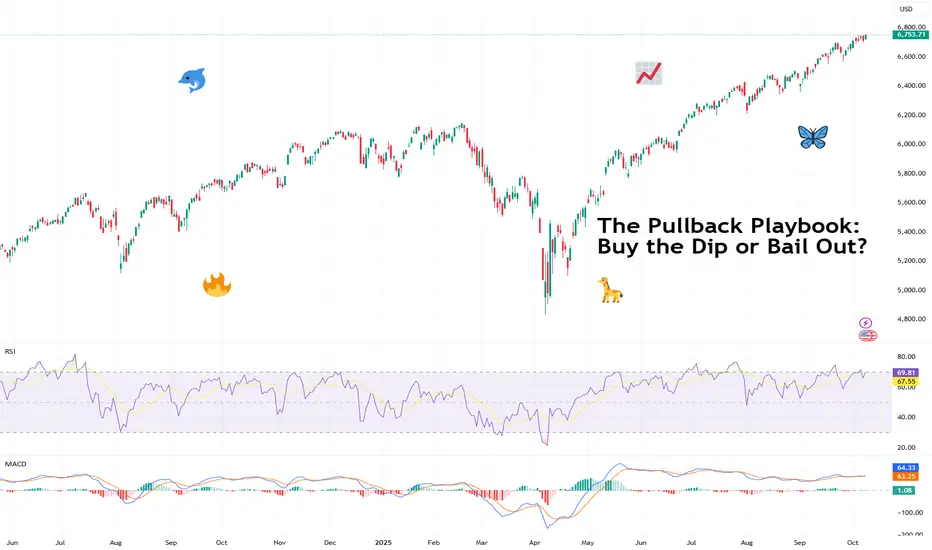
The Pullback Playbook: Buy the Dip or Bail Out?Markets don’t go up in straight lines. Even the strongest trends pause, retrace, and test your conviction.
These pauses are called pullbacks and they can either be healthy breathers before the next leg higher or the first cracks in a trend about to fall apart. The challenge for traders is knowing the difference.
📉 What Exactly Is a Pullback?
Think of a pullback as a temporary trend halt, not necessarily a crash. The price moves against the prevailing trend for a short period, testing support levels or shaking out weak hands before deciding where to go next. They’re common, normal, and — if managed right — they’re opportunities rather than threats.
But here’s where it gets tricky: not all pullbacks are trend halts. Some are the start of a flat-out reversal. And unless you’re comfortable holding through a potential nosedive, you need skills and tools to tell which is which.
🧐 Pullbacks vs. Trend Reversals
So how do know if you’re looking at a pullback or a trend reversal? The main differentiating factor is the length of the move. The healthy pullback looks orderly — modest in size, controlled in volume, and often retracing to familiar moving averages or support zones.
A healthy pullback might retrace 3-5% in a bull run, testing the 20- or 50-day moving average before bouncing higher.
A trend reversal barrels through multiple support levels in days, erasing weeks of gains. It’s often sharper, louder, and driven by news or panic.
Signs of a healthy pullback include:
• Price holding above key moving averages (20, 50-day. Some stretch to the 100-day but these tend to be rare — it’s more likely a trend reversal by then).
• Volume shrinking on the way down, then swelling on the rebound.
• Oscillators like RSI cooling off from overbought territory without plunging into oversold.
Trend reversals look more like:
• Breaks of multiple support levels in one go.
• Heavy, accelerating sell volume.
• Headlines driving panic: tariffs, central bank surprises, data releases from the Economic calendar , crypto exchange blowups, or noise coming from the Earnings calendar .
📊 Technical Tools to Judge the Dip
Charts can’t predict the future, but they can help you gauge probabilities. Pullbacks often line up with Fibonacci retracements, moving averages, or horizontal support and resistance levels.
• Moving Averages : If price pulls back to the 50-day and holds, that’s often a green light for trend continuation. If it slices straight through the 100-day? Not so healthy.
• Trendlines : Respecting the line = confidence. Breaking it = trouble.
• Volume : Low-volume pullbacks suggest sellers aren’t that committed. High-volume dumps are red flags.
None of these are crystal balls. But together, they give you a framework to avoid buying every dip.
🏄♂️ The Psychology of Buying the Dip
Why do traders love dips? Because everyone wants a discount. A pullback offers a chance to jump on a trend at a better price, and social media culture has turned “buy the dip” into a meme strategy. But memes don’t pay the bills when a dip turns into a crater.
The psychology works both ways:
• Optimists see dips as golden tickets.
• Pessimists see them as traps.
• Realists know both can be true, depending on the setup.
Being aware of your own bias — whether you lean toward buying too early or panicking too soon — is half the battle.
🔄 Asymmetric Risk and the Smart Bet
Here’s where it gets interesting. You don’t need to be right all the time if your risk-reward ratio is skewed in your favor. A tight stop and a wide target can mean one win cancels out several small losses.
Imagine risking 1% to potentially make 10%. Even if you’re wrong most of the time, the math can work. Pullbacks are prime territory for asymmetric setups: smart, thought-out entries, clear invalidation points (below support, trendline breaks), and attractive upside if the trend resumes.
This doesn’t mean chasing every dip. A pullback can wipe your position clean if you’ve placed your stop loss a little too close, a little too early.
⏳ Timing Matters
The biggest mistake with pullbacks is trying to catch the exact bottom. Traders love to brag about nailing the wick, but most who try end up paying for it. Smarter is to wait for confirmation — a bounce, a reversal candle, a break back above a short-term moving average.
Yes, you may miss the lowest price. But you’ll also miss buying into a freefall.
🌍 Pullbacks in Context
Context is everything. A dip in a raging bull market is not the same as a dip in a shaky sideways market. Macro matters too. If the Fed is cutting rates , risk assets might rebound fast. If tariffs, wars, or inflation are spiking, a pullback could turn into something bigger and deeper.
That’s why traders zoom out before diving in. Daily charts tell one story; weekly charts often tell the bigger tale.
🚀 Buy or Bail?
So, do you buy the dip or bail out? The honest answer is: it depends. A well-structured pullback in a strong uptrend with unchanged fundamentals is an opportunity.
A violent, volume-heavy selloff in a fragile market with cracked fundamentals is a warning.
The pullback dilemma isn’t just about charts but also about psychology. Can you hold your nerve when the market wobbles, or will you cut and run? Both choices can be right in the right context.
🎯 Final Takeaway
Pullbacks are part of every trend’s DNA. They test conviction, patience, and risk management. The key isn’t to predict every wiggle but to recognize whether price action is just cooling off or signaling something bigger.
Stay disciplined, respect your stops, and let the chart, not the noise, tell you when it’s time to stay in or step aside.
Off to you : Buy the dip? Or bail out? How do you respond to expected and unexpected market pauses? Let us know your coping mechanism in the comments!
US100: Imbalance rejection – Bears back in control
🧠 SKILLING:US100 Technical Analysis
🧱 Resistance Zone (Imbalance)
• The 24,900 – 24,950 area acts as a strong resistance, overlapping with a supply/imbalance zone.
• Price has reacted bearish from this level, showing clear selling pressure.
• This is a potential area to look for short (Sell) setups.
________________________________________
📉 Current Market Structure
• After a sharp bullish retracement, price formed a rising channel 🔵.
• However, inside the highlighted circle, price has broken down from the channel — indicating weakening bullish momentum.
• This breakdown supports a short bias in the short term.
________________________________________
💡 Trade Plan
• Bias: Look for Sell setups near the resistance zone.
• Confirmation: Wait for a small pullback and a new lower high before entering short.
• Target (TP): Toward the Support zone 24,740 – 24,868 (previous bottom).
• Stop Loss (SL): Above resistance at around 24,950 – 25,000.
________________________________________
🟢 Support Zone
• The 24,740 – 24,780 area is the previous bottom, where price previously bounced strongly.
• This level might attract profit-taking from sellers or temporary buying interest.
________________________________________
⚠️ Risk Notes
• If price closes above 25,000 (H1 candle), the bearish scenario becomes invalid.
• Manage position sizing carefully and wait for clear confirmation before entering a trade.
________________________________________
🧭 Summary
• Short-term Trend: 🔻 Bearish correction
• Mid-term Trend: 🔄 Sideways – waiting for a breakout of either 24,740 or 25,000.
• Current Opportunity: Sell from resistance → Target support zone
Please like and comment below to support our traders. Your reactions will motivate us to do more analysis in the future 🙏✨
Harry Andrew @ ZuperView

US30: Consecutive breakouts signal an emerging downtrend
SPREADEX:DJI – When price rejects the high, the market begins to shift
On the 30-minute chart, price action is clearly signaling a loss of bullish momentum and a transition toward a bearish structure.
________________________________________
🧠 Price Action Analysis
1. First Failed Breakout
Price initially broke above the ascending trendline that had held since early October — but failed to hold the breakout.
➤ A classic early warning of buyer exhaustion, often seen during distribution phases.
2. Multi-Layered Resistance Zone
The 46,725 – 46,779 region has become a clustered resistance zone, rejecting price repeatedly.
➤ Multiple rejections here suggest dominant selling pressure, with strong supply overhead.
3. Second False Breakout
A more subtle second breakout attempt followed — but again, price was swiftly rejected.
➤ Consecutive failed breakouts typically indicate a lack of conviction and precede sharp reversals.
________________________________________
📉 Trend Structure Has Shifted Bearish
• Lower highs and lower lows now visible
• Price broke below the previous trendline
• Pullback attempts failed to reclaim broken support
• Market is respecting resistance instead of support
➡ These are clear signs of a short-term downtrend emerging.
________________________________________
🔻 Trading Strategy: Favoring Sell Setups in the New Bearish Context
✴️ Scenario 1: Sell at Retest of Proven Resistance Zone
• Optimal Sell Zone: 46,700 – 46,750
• This area has already triggered two failed breakouts — a third touch could be the ideal trap for late buyers
• Watch for bearish rejection candles (pin bars, bearish engulfing, etc.)
Suggested Sell Limit Order:
→ Entry: 46,730
→ Stop Loss: 46,830 (above prior swing high)
→ TP1: 46,500
→ TP2: 46,300
→ Risk-Reward: At least 1:2
_______________________________________
✴️ Scenario 2: Momentum Sell on Breakdown of Local Support
• Trigger Level: 46,580 — if price breaks below with strong momentum (long red candle, increased volume)
• Confirms trend continuation after consolidation
Suggested Sell Breakout Order:
→ Entry: 46,580
→ Stop Loss: 46,680
→ Target: 46,350 – 46,200
→ Tip: Use smaller position size if breakout appears weak to avoid getting trapped in a fakeout
________________________________________
🎯 Trade Management
• Only enter trades with clear price rejection or momentum confirmation
• Move SL to breakeven after TP1 is hit to lock in safety
• Exit the trade if price closes above 46,830 — that would invalidate the bearish thesis
________________________________________
False breakouts leave a trail — for those who know how to read it. It's not a failure. It’s the market whispering that direction has changed.
Please like and comment below to support our traders. Your reactions will motivate us to do more analysis in the future 🙏✨
Harry Andrew @ ZuperView

US100: Strong resistance sell setup on the 30-minute chart
📈 SKILLING:US100 — Technical Analysis: Sell Setup Near Strong Resistance
🔍 Technical Analysis:
• Currently, US100 price is approaching a significant resistance zone (highlighted in red). This area has acted as a strong ceiling in recent sessions, where sellers tend to emerge.
• The price has rallied back after a sharp decline but is showing signs of slowing momentum as it nears this resistance. This often leads to a rejection rather than a clean breakout, especially on a 30-minute timeframe.
• Below, the light blue zones represent key support levels, which could serve as realistic targets if sellers regain control. These zones are important areas where buyers previously stepped in, creating potential bounce points.
• The drawn dashed lines illustrate a possible price path: a test of the resistance level, failure to break higher, followed by a pullback and continuation of the downward trend.
• For confirmation of the sell setup, traders should look for reversal candlestick patterns such as rejection wicks (long upper shadows), bearish engulfing candles, or pin bars at the resistance zone. These signals help validate that sellers are gaining dominance.
• Volume and momentum indicators should also be monitored for divergence or weakening bullish pressure near resistance to strengthen the case for a sell.
📊 Trade Considerations:
• Entering a sell position should be done only after clear confirmation of price rejection at resistance.
• Setting a stop loss slightly above the resistance zone helps manage risk in case of a false breakout.
• Targets can be placed near the support zones (light blue areas), with partial profit-taking to lock gains while allowing some position to run if price reacts there.
📌 Summary:
The technical structure of US100 on the 30-minute chart suggests a high probability of price reversal from the strong resistance area. A cautious sell setup is favored, waiting for confirming price action signals to reduce risk. Proper risk management is essential to navigate potential volatility near this key level.
Please like and comment below to support our traders. Your reactions will motivate us to do more analysis in the future 🙏✨
Harry Andrew @ ZuperView
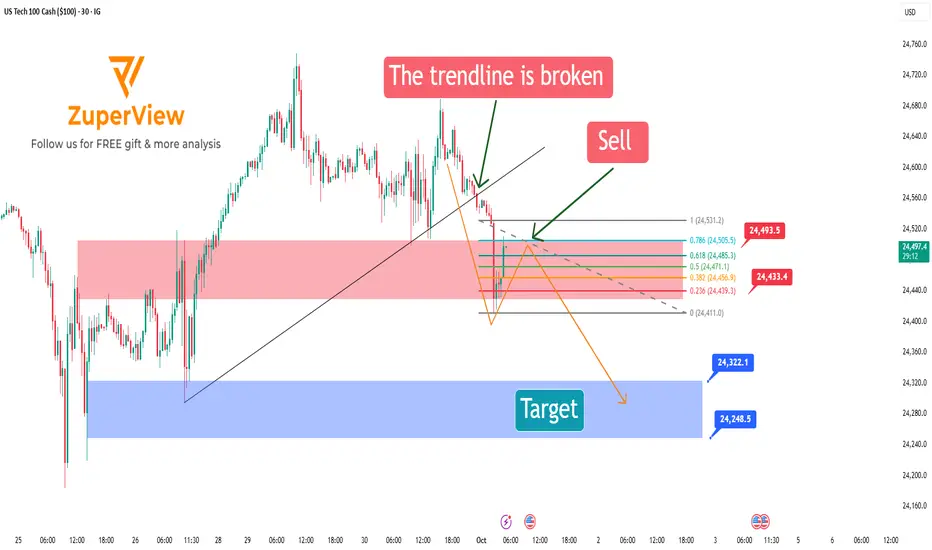
US100: Short setup using fib levels from flash candleIG:NASDAQ m30 chart analysis: short action!!
The chart signals a potential short opportunity after breaking the previous bullish structure and printing a strong bearish flash candle. The strategy focuses on shorting the pullback using fibonacci retracement measured from that candle.
🔺 1. Structure break and flash candle confirmation
The price broke below the rising trendline supporting the bullish move from sep 26 to sep 30.
Immediately after, a large bearish flash candle appeared — signaling strong selling pressure and a potential trend reversal.
This candle becomes the reference point for measuring the retracement and anticipating a continuation to the downside.
📏 2. Measuring fibonacci from the flash candle (high → low)
Apply fibonacci from the high to the low of the flash candle.
This technique identifies potential resistance zones within the context of that specific bearish move.
Key fibonacci levels to watch:
0.5: 24,472.0 | 0.618: 24,486.4 | 0.786: 24,506.9
🎯 3. Ideal entry zone: from 0.382 to 0.786
After a strong bearish flash candle, price often pulls back moderately before continuing lower.
The optimal short zone is between fibo 0.382 and 0.786:
This respects the integrity of the bearish impulse.
A retracement smaller than 0.382 may be too shallow to confirm a strong rejection.
A retracement beyond 0.786 might indicate loss of bearish momentum and invalidate the flash candle setup.
🎯 4. Bearish scenario and targets
If price reacts at the 0.382–0.786 zone and resumes downtrend, a potential ABC bearish correction forms:
A: Flash move down
B: Pullback to fib zone
C: Next impulsive leg down
Suggested take-profit levels:
🎯 Target 1: 24,322.1
🎯 Target 2: 24,248.5
🛡️ Stop-loss: above the flash candle’s high (around 24,533)
✅ Summary
After a structure break and a decisive bearish flash candle, us tech 100 is showing a clear bearish setup.
Using fibonacci measured from the high to low of the flash candle helps identify high-probability pullback zones.
📌 Entry zone: between 0.382 and 0.786 retracement — outside this range, the flash candle's power may be invalidated.
This is a momentum-following trade with defined entry, stop loss, and take profit zones.
Wait for confirmation from price action within the fib levels before entering.
Please like and comment below to support our traders. Your reactions will motivate us to do more analysis in the future 🙏✨
Harry Andrew @ ZuperView
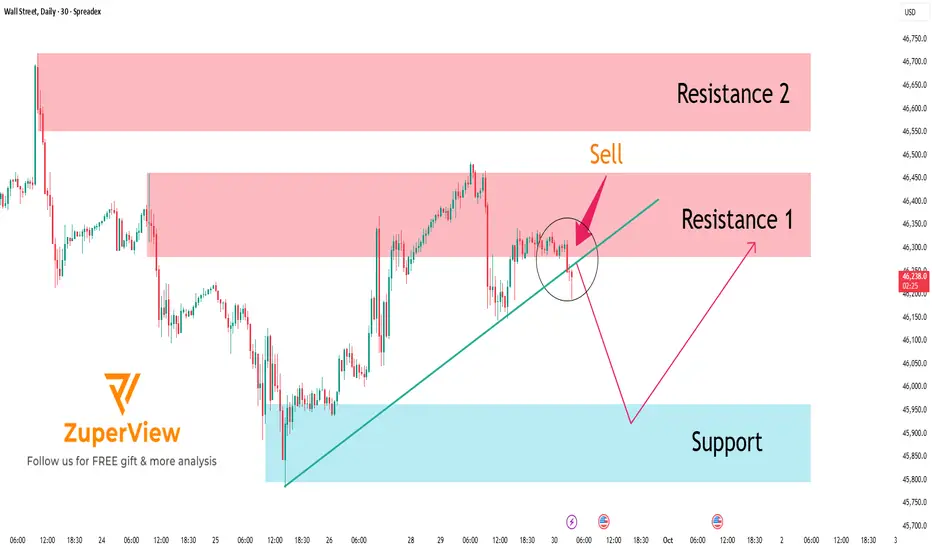
US30: Rejects Resistance – Bearish Move in Progress
The SPREADEX:DJI index is currently forming a bearish short-term structure, especially after price entered the Resistance Zone 1 (46,279 – 46,445) — a key area where sellers have clearly stepped in with strong rejection.
🚨 CLEAR REVERSAL SIGNALS
At Resistance 1, we saw multiple rejection candles with strong bearish bodies.
Additionally, the MA Plot has turned downward, signaling a possible shift in trend.
Price also touched the 4-level structure zone of support/resistance, adding confluence to the area.
Immediately after, the market reversed and dropped sharply with strong bearish candles, confirming the presence of selling pressure and strengthening the short bias.
📉 PREFERRED SCENARIO – SHORT WITH THE TREND
With the current momentum, the preferred scenario is:
🔻 Price is likely to continue dropping toward the Support Zone: 45,459 – 45,798
This zone serves as a logical short-term target for any short positions taken at Resistance 1. Once price reaches this area, traders can consider partial or full take-profits, depending on market reaction.
🧠 TRADE IDEA
Action: 🔻 Short
Entry Zone: 46,279 – 46,445
Stop Loss: Above 46,550
Take Profit: 45,800 – 45,500
✅ CONCLUSION
US30 is under visible selling pressure after rejecting Resistance 1 and reacting strongly at multiple confluence levels. The technical setup favors a trend-following short strategy, with proper risk management and patience around key levels to confirm next moves.
Please like and comment to support our traders. Your feedback motivates us to produce more analysis in the future 🙏✨
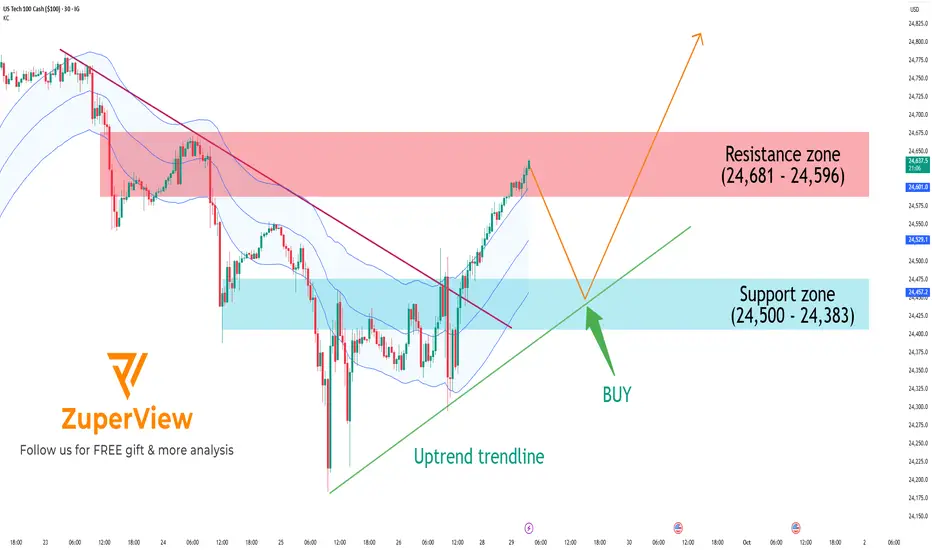
US100: Approaching resistance, pullback likely before breakoutThe IG:NASDAQ has shown a strong short-term recovery after breaking a major descending trendline. However, price is now testing a significant resistance zone, and a technical pullback is likely before the uptrend can continue.
📊 Technical Analysis: 30-minute Chart
📉 1. Overall Trend
Price has successfully broken above a descending trendline (red line), shifting market structure from bearish to bullish.
An uptrend line (green) is now acting as dynamic support.
Price is trading near the upper band of the Keltner Channel, indicating sustained bullish momentum.
🟥 2. Resistance Zone: 24,596 – 24,681
This zone has acted as a strong supply area in the past, causing multiple rejections.
Price is currently testing this area again → a rejection or short-term pullback is highly probable.
🟦 3. Support Zone: 24,383 – 24,500
This zone overlaps with previous consolidation and aligns with the uptrend line.
If a pullback occurs, this area could attract buyers and act as a launchpad for the next leg up.
🔁 Potential Trade Setups
✳️ Primary Scenario (preferred):
Price rejects at resistance → pulls back to support → bounces and resumes the uptrend
Wait for a pullback toward 24,500 – 24,383
Look for bullish price action (e.g., bullish engulfing, hammer) for entry
Enter long if support holds:
🎯 TP1: 24,650
🎯 TP2: 24,700+
🛑 SL: Below 24,350 (trendline invalidation)
🔻 Alternative Scenario (risk):
If price breaks below 24,383 and the uptrend line fails → short-term trend could shift sideways or bearish
Avoid long entries without a confirmed recovery
Re-evaluate trend structure if support fails
✅ Conclusion
A short-term uptrend is in place
However, price is now testing a major resistance zone, and a healthy pullback is likely
Please like and comment below to support our traders. Your reactions will motivate us to do more analysis in the future 🙏✨
$ETH Market OutlookCRYPTOCAP:ETH Market Outlook
Ethereum is currently consolidating, with a critical downside level at $4,000.
If $4,000 does not hold, the next supports are $3,500 and $2,400.
The $2,400 scenario remains highly unlikely, as it would imply a full retracement of the previous rally. In contrast, a pullback to $3,500 represents a 50% correction of the last upward move—a realistic outcome that would signal a temporary setback rather than a trend reversal, potentially setting the stage for continued upside momentum.
At present, CRYPTOCAP:ETH is trading within a range and sitting near the midpoint. Should this level break, the bottom of the range becomes the next logical target.
⚠️ Always DYOR.

S&P 500: Pullback after flash dump is a Short opportunity
📝 1. Market Context
BLUEBERRY:SP500 recently witnessed a sharp drop from 6,698 down to 6,645, showing clear bearish momentum. After this fall, the index attempted a recovery, but the bounce was weak: green candles became smaller and stalled right at key resistance zones. A long red bearish engulfing candle then erased the entire recovery, proving sellers are back in control.
🟥 2. Static Resistance (Red Zone on Chart)
On the chart, the red zone represents static resistance, located around 6,671 – 6,664.62. This area aligns with:
• Dynamic resistance (moving averages).
• Static resistance (previous supply zone).
Every time price has tested this area, it faced rejection. This makes the red zone a high-probability level for sellers to step in again if price retests it.
🟩 3. Support Zone (Green Zone on Chart)
The nearest support lies at 6,639, highlighted as the green zone on the chart. This is the first logical downside target, where price might pause or react before choosing the next move.
🎯 4. Bearish Scenario
• Bias: Bearish continuation.
• Entry zone: 6,671 – 6,664.62 (red resistance zone).
• Target: 6,639 (blue support zone).
• Invalidation: If price closes firmly above 6,672, this bearish idea is no longer valid.
✅ 5. Summary
After a sharp decline, the weak bounce into resistance looks like an opportunity for sellers. As long as the index remains below the red resistance zone, the path of least resistance points lower, with 6,639 as the next key support to watch.
📈 Similar to the previous Buy setup, we can see that price is reacting in a similar manner — it touches the static support zone (marked in green) and the moving average (acting as dynamic resistance), before making a strong bounce.
Please like and comment below to support our traders. Your reactions will motivate us to do more analysis in the future 🙏✨

US100 M30 – Sideway at the Top - Short OpportunityThe CAPITALCOM:US100 index has experienced a strong upward move on the 30-minute chart, pushing price to a new high around the 24,800 – 24,850 zone. However, recently, price has been moving sideways within a narrow range, forming a consolidation phase near this key resistance area. This sideways action signals a potential short-term correction or trend reversal.
📉Technical Analysis:
Current Sideways Zone: Price is consolidating between approximately 24,800 and 24,850, repeatedly testing this resistance but failing to break through decisively.
Key Support Level: The 24,650 – 24,700 zone is acting as critical support, holding price during this consolidation.
Support Break Signal: A close below the 24,650 – 24,700 support range would confirm the start of a downtrend and signal a likely bearish move.
📊 Trading Plan
Sell on Support Break: If price closes below the 24,650 – 24,700 support zone, consider entering a short position targeting the next strong support area near 24,400 – 24,350 .
Sell on Retest of Sideways Zone:
After breaking support, if price pulls back to retest the sideways zone (24,800 – 24,850) and shows bearish rejection signals (e.g., pin bar, bearish engulfing), this provides a good opportunity to enter or add to short positions.
⚠️Risk Management:
Stop-loss: Place above the sideways resistance area, around 24,860 – 24,870 , to avoid false breakouts.
Take profit: Consider partial profit-taking near 24,650 – 24,700 and final targets around 24,400 – 24,350.
Wait for Confirmation: Avoid entering trades without clear support breaks or bearish rejection signals to minimize risk.
Please like and comment below to support our traders. Your reactions will motivate us to do more analysis in the future 🙏✨

HARD SHORTMy former analysis successfully landed to target zone. And now market wants a pull back.
1-Above there is low liqudation
2-Next week we will probably see a rate cut. thats why I am a little nervous abot open short
3-Till that day I think whales will chase cheap asset that is where my courage come from
4-Market wants to see a pull back
be careful about short you may just want to open long at the below
Always manage your own risks this is not a investment advise I am not responsible neither your loss nor profit.

Gold (XAUUSD) – 10 Sep | Watching M15 Supply for Short Setups🟡 Gold (XAUUSD) Analysis – 10 September
Market Overview
Gold had been in relentless bullish momentum with both H4 and M15 aligned to the upside. Yesterday, price made a fresh all-time high at 3674.650 , but sharp selling pressure emerged from that level.
This rejection caused a significant Change of Character (ChoCh) below the previous higher low at 3628.5 . Following this, the market also printed a Break of Structure (BoS) earlier today, confirming that the H4 pullback phase has now begun.
Current Market Scenario
H4: Shifted into a pullback phase after M15 ChoCh + BoS.
M15: In a downtrend, currently retracing after the structural break.
This alignment signals that our focus today will be on sell setups only .
Key POI for Today
🔹 3637–3640.8 → M15 supply zone at the LH level.
If price retraces into this zone and provides LTF confirmation , we will plan a short setup.
If this zone is not respected, we will step aside and reassess deeper supply areas.
Execution Plan
Wait for price to retest the 3637–3640.8 M15 supply zone .
Drop to M1 for confirmation (micro ChoCh / micro BoS).
If confirmation is present, execute a short setup with fixed risk.
If the zone fails, do not force trades — wait for price to reach deeper supply before re-engaging.
Execution is about patience — let the market come to your levels, not the other way around.
Bias for Today
📉 Bearish only. Short setups will be taken from supply zones once confirmation is present. Until then — no trades.
📘 Shared by @ChartIsMirror

Will Ethereum lead next Altseason? ETF & Fusaka update in focus!Ethereum ETFs have recently seen significant inflows, outpacing Bitcoin ETFs, just ahead of the upcoming Fusaka upgrade in November.
Ethereum recently broke above its previous record high, a move that was anticipated in earlier analysis, and is pulling back before shooting higher. For a sustained move higher, a strong breakout with increased volume and momentum is needed. There are signs of momentum exhaustion, so traders should watch for confirmation before expecting further upside.
A classic cup and handle formation opens the door to $6,200 if resistance is cleared, with key support at $4,115 (previous resistance now acting as support) and a deeper pullback exposing $3,500. But this would not necessarily change the long-term bullish outlook.
Indicators to Watch
Bitcoin Dominance:
Bitcoin’s market dominance is currently around 55%, suggesting the market is still Bitcoin-led, and a true “altseason” may be at its early stage.
Total Crypto Market Cap:
Watch for breakouts in the total crypto market cap (TOTAL3 - excluding Bitcoin and Ethereum) and the formation of bullish patterns for confirmation of a broader market uptrend.
Altcoin Season Index:
The index remains below the threshold for a full altseason but is rising, indicating that Ethereum and other altcoins are not broadly outperforming Bitcoin but are nearing breakout.
Short/Medium-Term Outlook:
Expect continued consolidation or a possible pullback before any sustained move higher if support above $4,115 holds firm.
Long-Term Outlook:
As long as Ethereum holds above the 50% retracement level, the long-term trend remains positive. A confirmed breakout above resistance could signal the next major upward phase.
This content is not directed to residents of the EU or UK. Any opinions, news, research, analyses, prices or other information contained on this website is provided as general market commentary and does not constitute investment advice. ThinkMarkets will not accept liability for any loss or damage including, without limitation, to any loss of profit which may arise directly or indirectly from use of or reliance on such information.

Gold – Still One of Wall Street’s Highest Conviction TradesGold – Still One of Wall Street’s Highest Conviction Trades
Almost every major Wall Street bank currently lists long Gold as one of their strongest conviction calls – and the reasoning makes sense. There are three fundamental drivers that continue to support the bullish case:
I. Persistent U.S. Inflation → Gold remains in strong demand as a hedge.
II. Potential Fed Rate Cuts → Likely USD weakness could further lift Gold due to its negative correlation .
III. Reserve Diversification → A gradual shift towards Gold as a USD alternative in global central bank and hedge fund portfolios.
I’m not typically a trend trader, nor do I trade Gold frequently (my focus is mean reversion in FX), but I do find these arguments compelling.
From a tactical perspective, I wouldn’t chase the current highs. Price recently broke out of a triangle formation, and the Williams %R is at levels that historically preceded pullbacks. If I had to establish exposure, I’d prefer to wait for a retracement into the 38.2%–61.8% Fibonacci zone, scaling in gradually with multiple small longs.
To be clear – I don’t see an attractive short setup here. But patience may offer better risk–reward on the long side.
What’s your view? Do you agree with the fundamental case, or do you see a different setup?
Stay safe & happy trading,
Meikel
