Short 🔴 Price will go Down, Bulls will Buy LossShort 🔴 Price will go Down, Bulls will Buy Loss
SVM (Support Vector Machine) forecasts BTC/USDT dump.
AI predicts traders will try to buy the dip.
A liquidation snowball effect could create a fast & volatile crash.
After the shakeout, the new ATH later this year isn't excluded.
Put

Short 🔴 Bearish Wedge on UNI, Masses Have To LoseToo many are "longing".
So, here's a counter-trade idea.
People have to lose.
Scenario 2 is how they could.

Market Alpha - QQQ Searching for RealityEven with everyone following tik tok and social influencer trade ideas, there are still market technicals that will prove superior.
Make sure you guys have this chart in mind when taking longs at all time highs.
Profit taking can quickly turn into a more dramatic drop as demonstrated by this chart. NASDAQ:QQQ

Nasdaq Ready to Rip?I follow the AMEX:SPY closely but after pulling up the chart for the Q's it looks like we may be seeing an even more critical level to hold... What are your thoughts?

SPY Breaking Critical Technical LevelAMEX:SPY
An update on the SPY Chart shows continuing bearishness. We are not getting back to the 0 line on our upper indicator and falling further below our current level on that indicator would be a very bad sign for the market.
Inflation doesn't seem like it's going away and crypto may be showing itself as an inflation hedge.


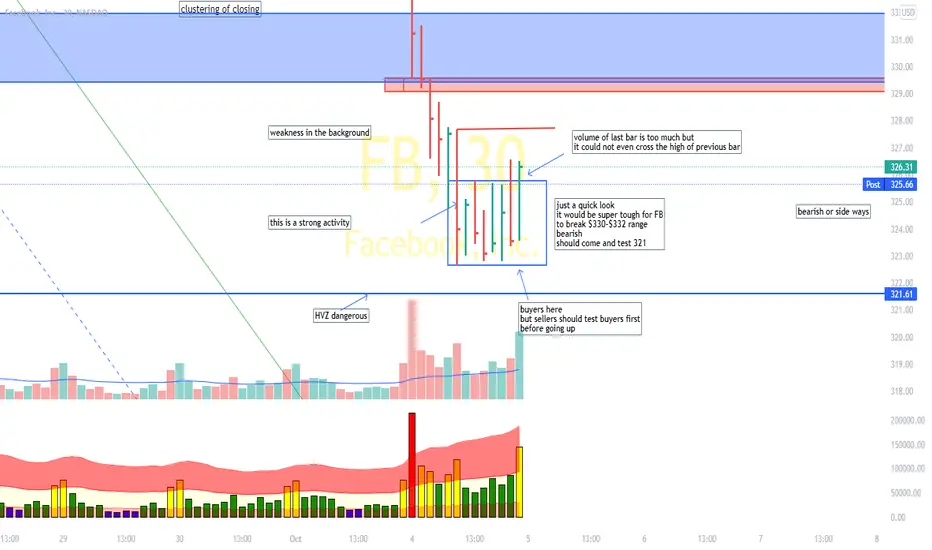
FB $321 to be tested|Bearish Bearish on FB as price is holding @1hr ,@30 &@15
high chances that $321 zone should be tested. I am bearish on FB for now. NO TRADE ZONE for now until price comes over $332.
Bearish
Swing/Intra day PT 242 OIL INDIATHIS IS NOT A FINANCIAL ADVISE.PT IS 242
OPTION TRADE PUT/SHORT.
Make sure you get out @ 242

Nifty 50 Price ChartNifty 50
Short/Sell
==> Wait red candle under Local Resistance and major resistance
Long/Buy
==> Wait Green candle upper support, local support and major support

$REAL Nice Put positionPUT REAL OCT 15th 0.55 71.99% -31.73 0.14
Gamma and Delta look good for this at 55 cents. Implied volatility is 72% . The signals are set up well and the sloan ratio is -37 indicating consistent negative reporting cycles in financials.

$MARA #Call #Put #Spread #Straddle #Strangle Mara consolidation looking ready to break.
Play we entered:
Expiry: 09/24/2021
Call: $34 @ $0.77 per
Put: $33 @ $0.96 per

Market Alpha - EMBNASDAQ:EMB
As a way to get exposure to the China housing debacle.... I go over my chart on a new position I opened that has relatively low volatility considering the weight of exposure it may have to the chinese housing collapse.

$ARKK Consolidation StraddleArk is strongly respecting these lines looking to see if it wants to break down or consolidate further.

$LCID - Call Put SpreadWill be interesting, LCID has a history of filling the gap, something we could see happening, but is also forming a bullish consolidation. If it doesn't break out/down before theta is priced in from this weekend, it could be a great spread.

$NVDA - Call Put Spread Waiting to see which colour line it respects the most before entering a play (to determine expiry).

AAPL Long Straddle Strike price: $149
Call Entry @ $3.12
Put Entry @ $3.43
Expiring October 1st
This is not financial advicr, just a description of the plays we are in!

$PLTR Cal Heavy Call Put SpreadThis chart and play was entered during that circle, however we did not publish it in time.

SLQT Long PutGap was filled. Plan to buy a $15 October Put in anticipation of the retest back down. Absolute zero trade...

Sold $SPX put verticalRelatively speaking, $SPX is till kind of weak, but I'm slightly bullish towards the end of Thursday. I sold Sept. 15th $4435/$4440 put vertical for $1.1 credit.

$TTD Bull Flag (Weekly)Weekly time frame
TTD - Labeled retracement levels. 69p is a solid swing play (exit 9/14 or 9/15)
Labeled extension levels
Like if you agree!

MARKET ALPHA WATCHLIST - INTCHey Everyone!
I hope everyone is having a blessed day. Today I'm posting a symbol from our watchlist. Spotted in the options market. We are watching INTC to see more strength and break above this trendline and possible downward trend. These are the levels to watch over the next few weeks whether long or or short.
NASDAQ:INTC

Rising Wedge Breakdown with Bearish Divergence.Gonna be looking for a quick 10-20 percent pullback from here.

Weekend BTC Hedge - use PUT spread!Trend reversal or correction? Over time, the situation in the bitcoin market should become more clear-cut. However, it is now possible to buy a hedge against a price decline with the PUT SPREAD.
Flash Idea:
To reduce the amount of risk, we choose the nearest expiration date of September 3. After that, we buy a 47 000 PUT option (we have to pay an estimated premium of $19 for a minimum transaction fee of 0.01BTC), and to finance this trade, we might sell two PUT 44 000 options (each with an estimated premium of $9).
This would hedge our last flush idea of BTC rising to September 24 for a week.
Risks: As the idea is to sell two PUT options at 44 000, after the price crosses 41 100 marks, the possibility of a loss arises.
