Feeling some bullish vibe on USDCHFI know FED is playing big moves ahead so far to prevent the State from the pandemic before it may cause more disruption around the country. The reason is beyond technical analysis for me to think even slightly how this pair might gonna end up trending upward. The big moves which I'm talking about from fed were the double rate cut within a month and some repo market actions. They aren't taking things slightly any more the moment when they decided to drop their benchmark rate around 0%-0.25% and some big Qe plans coming later. I know most of global central banks honchos are too serious about this pandemic at this moment and Fed has already shown us the real action lately which should slowly help to resolve the issue which had generated by that pandemic "coronavirus" within the state and its economy. Lastly don't forget about Swiss National Bank Intervening to Weaken Franc on recent data from the central banks. They just don't like their currency to get overvalued for various reasons. These conditions let me assume this pair may probably make some new swing highs.
QE

AGNC for 480% gains in just 6 weeks!I posted about AGNC at the beginning of January when AGNC was around $17.50, I called for $20 no later than June. What a pleasant surprise that AGNC has continued to stay on fire!
Now one might ask how did I turn this little, fairly slow moving stock into 480% gains in just 6 weeks? I mean this sounds like crypto gains, not stock market gains! This is a strategy I like to use where as I find a stock I expect to move but specifically a stock that typically doesn’t move that much. What we find is that the options have almost no overhead premium priced in and are super cheap. Here I bought 50 call contracts for June expiry @ $18 for .28cents each. I am now $1.50 in the money and just continue climbing with a current option price of $1.60!
Here is a capture of my specific options and their gains to date. > imgur.com
AGNC had another surprise earnings marking two in a row now, an indication that in fact fed policies are benefiting them more than anticipated. AGNC also announced an offering but #1 it was priced at $25 and #2 their offerings aren’t really dilutions, its just an expansion of capital that is tied 1 to 1 with real estate backed securities, more akin to expanding their balance sheets.
I took this opportunity to update AGNC because due to the incline, it looks like we will see a $20.50 top of channel and by next month at this rate. This is in contrast to $20 top of channel on this descending channel in June. Also I am selling most of my options now to buy more options further out of the money. While I suspect we will see decent resistance @ $20.50 I believe everything is in place to break resistance this time and start heading back up, maybe $24ish by late 2020.
If you have never traded options, you should be extremely careful. Options can expire worthless turning your entire investment to $0 with zero holdings. I prefer option trading to margin trading for leverage trading as I am only risking what I put on the table, I know my total risk up front. Options are not for the faint of heart or new investor.
This is not investment advice, DYOR, if its something new to you, always start super small while you test and get a feel for how it works.
I will post another update on AGNC as we see the channel resistance start to flesh out.
If you trade Crypto as well, please check out our site vcdepth.io with advanced real time and historical level2 data for the broad crypto market.
Good luck with your trades!

Will S&P catch the Corona Virus to 3075? Or is it S&P to 3550+
My Position:
Last TA I published on the S&P we had just announced a phase 1 trade deal had been reached with China. It was great timing as we need a push to get us out of the bottom sub channel we have been stuck in as we were reaching that resistance again for a 3rd time over the last year. I entered the market using slightly out of the money call options for a few months out on SPXL which is a bull S&P 3x return ETF. Before the Corona Virus, I was up 150% in a little over a month.
Leading up to now:
As many times as its played with breaking up out of the bottom sub-channel, its played with breaking down more. The bottom of channel is also the 10 year bull trend line, we have danced with it several times and late 2018 we had a massive break losing almost 10% value and well below the 10 year bull trendline. We recovered fairly quickly luckily and then we were bolstered with 3 rate cuts and $60Billion in QE-Lite per month still ongoing now.
Dangers:
Hand in hand with the Coronavirus outbreak, Fed Chief Powell signaled the feds would be looking to curb /end the QE-Lite that is not being called QE. To be fair the feds had reduced their balance sheets and incresed rates through out 2018 after a 3 years of letting things ride after 7 years of constant stimulus to the economy. Here is a great chart that shows a wealth of data in a single chart, from Reuters >
USA-FED-PORTFOLIO
Most likely this is profit taking after running straight up since mid October 2019 but at the same time investors should be leery of the feds turning off the tap that got this thing fired off to begin with. So as you can imagine given a recent and unquantified virus break out, an ongoing US impeachment that continues to get more complicated, a presidential election later this year, increased trade rhetoric with the European nations and a growing pool of countries resorting to negative interest rates, it is virtually impossible to know where the market will go and when it will correct. I will try to make a few points about the potential price action.
-------------------
More probable possibilities:
-We are positioned in a good place for S&P @ 3218 or so to hold support and retain grip on the middle channel. The reality is the phase 1 trade deal will act as a stimulus with tons of money flow this year that wasn't there last year, a relief of its own. If this support holds, the next obstacle will be S&P around 3550 around mid-march 2020, value dependent on when we reach top of sub-channel resistance. At this point we should already be starting to see some trade war relief continue the momentum pushing through resistance with slight delay and then seeing top of overall channel for the first time since December 2014. If we continue the general trend we would likely see the S&P at around 3950 by July/August. It would be a major feat to see the price action break up out of this 10/11 year channel. 3950 seems like a good exit for a long position and potentially an entry for a short position.
-We could break back down into the bottom channel which if we dive to bottom of that channel has us seeing the S&P500 @ 3075 by early April. With trade rhetoric improving, only the threat of feds dropping their QE-Lite and the CoronaVirus have any ability to knock the market back into the bottom channel. This seems possible but improbable.
-We could see the run lose steam as we reach the resistance of the top of middle channel and do similar as we did in 2018. How far we break above the top of the middle channel compared to 2018 as to whether the trend is improving. There is a chance we stay range bound here in the middle channel between 3250 & 3500 (currently) for most of the year, of course rising over time as outlined in the chart.
--------------------------
Notes:
*If you are a low risk appetite investor, consider putting your money into something more stable with a lower return until after election 2020. The market is volatile and unpredictable. My method of investing in options on 3x bull ETF's is some of the highest risk possible. If you make high risk investments, you should do so with a smaller portion of your overall wealth and pull some percent of profits out towards long holdings.
If you trade crypto, please check out our market depth site @ vcdepth.io with various depth of market filters available and recently integrated TradingView charts its great for scalping and swing trading. No one else captures open-interest like we do.
This is not investment advice, it is merely observations I have made during my trading analysis and I am sharing. Do your own research

US Dollar looking weak. The fed has continued with "QE" Quantitative Easing. They call it "adding to it's balance sheet"
It started buying long-term treasury's, debt and mortgage-backed securities to “increase the availability of credit” for home purchases and prop up the economy, according to a Fed statement from 2008.
Fast-forward to October 2017: The Fed started gradually selling off those holdings because the economy had since healed from the last recession. The Fed concluded this process Aug. 1.
What does QE have to do with the balance sheet?
You probably have an idea of the different types of debts you may owe, such as student loans, credit cards or a mortgage. In accounting terms, those are considered liabilities. In contrast, the things you own — stocks, bonds or a house, for example — are considered assets.
The U.S. central bank, too, keeps track of its assets and liabilities. It publishes this data in a weekly financial statement known as “the balance sheet.”
U.S. paper currency, as well as money that commercial banks hold in accounts at the Fed, are counted as a liability. Assets, on the other hand, are things that the Fed has purchased, such as Treasurys.
Now, go back to 2008. When the Fed announced it would start buying massive amounts of bonds, including “subprime” mortgage securities and other forms of distressed debt, it listed them as “assets” on its balance sheet.
This caused the balance sheet to balloon. In August 2007, before the financial crisis hit, the Fed’s balance sheet totaled about $870 billion. By January 2015, after those large-scale asset purchases had occurred, its balance sheet swelled to $4.5 trillion. That’s more than a five-fold increase.
By the time the Fed finished its normalization process, the balance sheet totaled $3.78 trillion.
As a result of all this Satoshi Nakamoto (Craig Wright and Dave Kleiman?) solved the Byzantine Generals problem of double spending and created the White paper for Bitcoin in Oct 31, 2008 (All Hallows Eve) with the hopes of creating a decentralized anti inflationary form of transact able, honest value.
This Creation coincided with the bottom on this chart. I can only imagine what the price of that creation(BTC) will do if the chart displayed here bottoms again. Thank you for reading.

Long EURUSD | $60 billion versus €20 billionFRS began a program of buying debt securities in the amount of 60 billion dollars per month. The ECB will soon start a similar 20 billion euro per month program. At the same time, the Fed still has the opportunity to apply additional measures to stimulate the economy. Since there is an opportunity to lower the interest rate. In other words, the Fed has steps to weaken the US dollar, the ECB has none.

SPX reversal- if trade war doesn't end soon, 10 year bull willAll the rage is about how the economy is doing great, the best its ever done, they say. This trend line in the S&P 500 with relevant data for reference says otherwise.
Suspect SPX will see 3k again this month even though it normally rallies in December. Without major intervention in way of massive trade deals or taking measures that further reinforce we are in economic trouble, we don't have long before we break down and out of our 10 year bull run. Reversal could lead S&P as low as 500 based on emerging descending trend line (See light grey line).
Here is what we can easily see with this chart.
---------------------------------------------------------------
**We have been hugging the bottom of channel of our 10 year trend all year and have 2 of 4 moving averages that have now fallen below the 10 year trend
-From 2009-2017 the majority of the trend was in the top of channel but the trend had already fallen to bottom half of channel not long before this administration took office.
-From 2017-current the market only barely breached out of the lower half of the channel around the time the $500Billion a year corporate tax break was announced
-In 2018 the USG provided a $500Billion a year corporate bailout in the form of a 50% corporate tax break but they didn't call it a bail out, also Amazon paid $0 taxes again
-End of 2018 and tariff trade rhetoric caused the market to crash hard below the 10 year trend line before recovering on dovish trade news that never came to fruition
-Mid-3rd quarter 2019 feds start cutting prime interest rates for the first time since the recession despite supposedly having the strongest economy ever, president pushes for negative interest rates, rates lowered 3 times in one quarter.
-Mid-3rd quarter 2019 feds start printing money with 3 rounds in one quarter to the tune of $250B, they dont call it Quantitative Easing (QE) as that breaks the narrative of a strong economy
-Each year under the current administration the national yearly deficit has ballooned and is now nearly as high as it was during the recession despite being in the best economic time we have ever had and collecting an additional $100B in tariffs from consumers. ($1T a year deficit).
----------------------------------------
If the tariff war ended tomorrow, we could possibly rally to top of channel but given the new tariffs with the EU and South America, given legislation that congress is pushing against China for their muslim concentration camps and given the pressure the president is putting on bejing over hong kong, it is unlikely that the tariff war is ending any time soon. It is possible that the president will use the opportunity to allow China to continue to attack democracy in the streets of hong kong and grow their concentration camps without American intervention if China will concede on a favorable trade deal with America but it needs to happen real soon.
Also concerning is how this administration tells markets "a trade deal isn't happening" one day and the next day they say "it looks extremely promising" with corresponding market action. This has been happening ever since the trade war started and I suspect some people in the know are making a killing off of these dramatic economically impacting tweets which strongly parallel what one might call market manipulation. This is no different than Elon Musk lying about a buy-out to shake the shorts which resulted in him being ousted from his chairman position. It's highly illegal and only causes further uncertainty and volatility to the markets when influencers push false narratives for political or financial gain. Any trader should be scared to trade right now because one tweet will reverse the market without the underlying content ever actually having to materialize, regardless of fundamentals or trend lines.
In short, if the trade war doesn't end soon, this 10 year bull trend will.
Don't believe me, DYOR


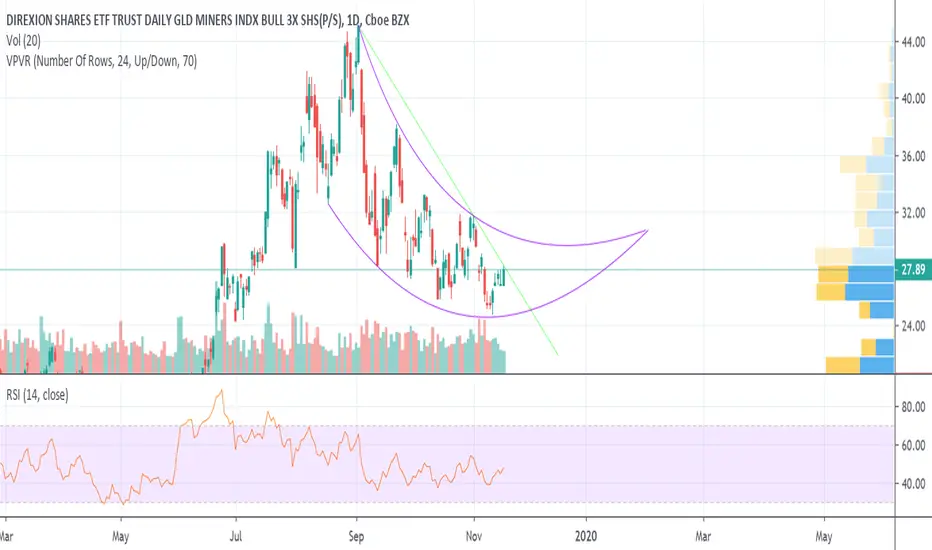
Miners rounding bottom?The gold miners' ETF is testing its downward trend line again today, and may be in the process of making a rounding bottom. Buy low in the crescent or watch for a bullish trend line break. Gold has been showing some strength due to Fed policies and dollar weakness. It could break out upward on news of either significant market weakness or a breakdown in the US dollar.
Gold to Silver Ratio. Let's step back for a bit.If you are familiar with the Gold to Silver ratio (XAUXAG) it shows us how many ounces of Silver is required for 1 ounce of Gold. So currently, it takes 85 ounces of Silver for 1 ounce of Gold.
Gold and Silver have been monetary metals for centuries, and historically, the Gold and Silver ratio has been 14-16:1.
Silver lost most of its monetary standing due to its stock to flow ratio...meaning the higher the price of Silver went, the more Silver would be mined to meet the new demand increasing its stock.
gold is the best form of money because it has a high stock to flow ratio. Meaning that if Gold moves up 100% or 1000%, the flow of Gold mined per year will not change because it is rare and hard to mine. It will always be around 2% new flow per year regardless of the price move.
Other metals like Copper, and Silver to some extent had low stock to flow ratios because as their prices rose, a lot of new capital and resources was focused on mining Copper and Silver and as mentioned, this would increase the flow and then bring price back down with this new supply.
We can argue though that this environment is different for two reason:
1) A lot of miners have not spent money on exploration. They are running low on their reserves and will need new supply. Mining is a business with a lot of costs that cut margin. So many argue that if Silver price does increase, new capital and resources allocated to mine silver will lag due to the fact that new resources will have to be developed.
2) This goes closely to my work on yield and Gold being a confidence crisis metal. I have argues stocks will go higher because there is nowhere to go for yield. Large funds cannot be in cash for a long time. When stocks begin to fall and we go to a risk off environment, this money will have to go somewhere. Some say bonds, but as Ray Dalio has said, it does not really make sense to hold bonds. You really are looking to sell them off to a bigger fool.
Enter Gold and Silver. There will be a confidence crisis as I have mentioned. People will realize soon that central banks are out of options. Central banks are not using the term QE, because it would illicit a confidence crisis. People will realize that monetary policy never worked and we are in a QE forever and 0 interest rate environment forever.
Paul Tudor Jones, Sam Zell, Ray Dalio and Stanley Druckenmiller are some Billionaires who have advocated increasing one's Gold position in their portfolio from 10% to higher. Paul Tudor Jones saying Gold will be the best performing currency in the next 12-24 months, and Ray Dalio perhaps starting a move into Gold by large funds and institutions. Dalio is well respected by the hedge fund community, and when he talked about Gold a few months ago, a lot of these funds began opening positions into Gold and miners.
Silver will have a good move because it is linked with Gold as it is a monetary metal. Gold is about a 7 Trillion dollar market. Silver is less than 700 Billion. It is a tiny market. When money moves into Gold, it will inevitably run into Silver as well. It will be seen as cheap. Silver will move much higher and faster due to the market being so tiny that large amounts of money will have a huge impact.
I have talked about the Gold and Silver ratio hitting all time record highs past 92 a few months ago.
This weekly chart for me is very exciting as I am seeing a potential head and shoulders reversal pattern which is alluding to a large move in Silver.
This seems to coincide nicely with central banks. I believe the Fed WILL cut again in December so in a few weeks. When this occurs, the market will begin to understand that we are going to 0 percent interest rates.
So again folks, do not be moved by these moves in precious metals on a daily basis. On a long term basis, Gold and Silver will do well.
Remember, when this confidence crisis occurs, we will see Gold and the US Dollar move up TOGETHER!

Gold Shake OutGold broke out of its pennant pattern a couple of days ago. Either we have a breakdown or a shake out (caught me out at break even) occurring right now just below the 50ma. A similar shake out occurred during the last pennant just before it exploded north.
I have bullish leanings for gold, given all the stimulus and extra stimulus coming out of the US. I'll be re-entering on a daily finish above the 50ma.

M1 Money Stock vs. S&P500: QE infinityBlue: M1 money stock. Contains liquid assets unlike M2
Black: S&P500 being artificially propped up by the federal reserve and its "large scale asset purchases" aka money printer.
Fed pumped the same amount from 84 to 08 and 08 till now.
Entire market is a bubble. Feds experiment is going to pop. Buy Bitcoin

SPY is selling off. People want their cashUsing the Cash in/cash out indicator (CICO) one can see the major shift from buying to selling. The CICO indicator measures a rolling sum of new money in and out of the market. The user can set the desired time frame to measure. The code is open source and directions on how to use the indicator are within the comment sections of the indicator. Don't let the 1% take your money, they don't need anymore.

ES needs to break and close below to continue downLooks like the mini-futures rally is starting to rollover. And it should... there was no good explanation for it. Unless you consider yet another round of QE a positive thing... SMH!

Navigating the Market : EURUSD 21st Sept 2019In terms of sentiment & fundamental analysis, last week and this coming week I have established a bias**. The bias is that I am moderately bearish on EURUSD (weak bearish) ECB is in quantitative easing mode whilst the Fed had done a hawkish interest rate cut.
**There will be a week when I do not have a fundamental/sentiment bias due to my limited knowledge on the matter but when I do, I put this bias on top of anything else, above Technical Analysis. Having said that though, I rely heavily on Technical Analysis to tell me where and when to trade.
In terms of Technical Analysis, the EURUSD is still in bearish mode (tho weakening). I look at the Daily Chart, even though our eyes would scream "EURUSD has gone bearish too long now". That is classical retail trader way of thinking. Picking tops and bottoms, claiming Euro is too cheap etc. I disagree with this completely. I am NOT saying the price would continue moving another 200-300 pips downwards (even though that is what I am anticipating because I am, after all, bearish bias EURUSD) but the average leg/wave for EURUSD (Daily Chart) before it retraces more than 38% of the impulsive wave, is 589 pips. Current wave/leg barely touches the average.
So, anyway.. quick hindsight-reading-the-left-side-of-the-chart analysis to make me sound stupidly smart: the EURUSD had been trading in the range since 5th September. It is true on the 12th and the 13th this pair broke above the trading range but that was due to the institutional liquidity run (conveniently coincided with the ECB Rate Decision). The pair traded back inside within the range until NY closes on Friday.
Now, time to read the right side of the chart instead. The nearest liquidity that I have identified is in between 1.10250 and 1.10400. Small retracement usually has stacks of orders that institutions love to consume. If price enters this zone I will be on Bearish standby mode waiting for a short signal. If the level I explained above would be broken through then I will be looking at the next level which is between 1.10750-1.0900. It would break the Friday High and that usually activates my bearish mode.
Risk Events on Monday for the EU are the Flash Services PMI, German Flash Manufacturing PMI and German Flash Services PMI. Nothing for the U.S

Dax - Massive Upside Potential ECB tomorowWe still see the Dax moving higher due to the ECB introducing additional QE as well as a rate cut which could act as a catalyst for the Dax jumping 10 per cent towards all time highs in the coming months. However, in the short term we would want to see the index move above the 12396 resistance level but if the ECB is less dovish than expected tomorow the Dax could easily start moving back down towards below 12000.


Gold is still surging despite strong dollar due to QE hopesThe dollar index has been up for about a week now, though it's slightly down today. So why is gold, which usually moves opposite the dollar, still up? Partly due to recession fears, I'm sure. Gold always offers a safe haven in uncertain economic times, and Fed rate cuts are always bullish for gold. Partly it's sheer momentum, with investors unwilling to exit a bet that's been a winner since May. And partly it's anticipation of further rate cuts. Today the news for gold is good, with President Donald Trump griping about the dollar's strength and threatening to intervene in markets to weaken the currency. The Fed may embark on quantitative easing (QE), which should be bullish for gold. Kitco is predicting that the gold spot price could rise to $1600 in 2020 due to QE.

EURUSD - Short - Key Support Level Broken We still see EURUSD going down as the key support level of 1.10976 we mentioned on our last analysis has been broken enabling the downtrend to resume. Additionally, today EUR CPI data came in at 1.4% vs 1.5% expected whilst US GDP came through at 2.5% vs 2.4% expected and with the uncertainty surrounding Brexit, as well as the ECB expected to initiate QE in September, we anticipate further downward pressure on the currency pair.

Dax - Long - Pre probable rate cut/ QE in SeptemberWe currently see the Dax going up but this is long term position where we are expecting QE and rate cuts in Q4 to lead to upward surge in the Index. The Dax could consolidate at this area around $11640 before gaining momentum towards $12000. However, we expect volatility due to the ongoing trade war notably due to mixed signals coming from both the US and China.

EURUSDJerome Powell is expected to speak this week concerning the Treasury note yield curve. We’re looking to see an aggressive Fed to address the potential global recession, which means quantitative easing and another rate cut.
This is a bearish signal for a weak dollar, due to the Fed debasing the currency by increasing dollars in rotation. This could bring in a high-volume price action.
An Easier Fed could mean my technical analysis would be inaccurate, and the EUR would push price to the down side.

GBPUSDThe Sterling Pound
The markets were optimistic regarding Germany’s Merkel agreement for the Irish backstop. The divorce with the EU, and Boris Johnson’s plan to meet with the Merkel will probably not accomplish any progress but headlines have moved Sterling a little higher.

Bullish on $GLDWith the first rate cut of the cycle around the corner, it's a good time to look at what $GLD did during the previous time rates were cut. It looks like $GLD kept rising as rate cuts and QE announcements kept coming.

END OF DOWN TREND? POSSIBLE 600 PIP TRADEGood day risk takers,
The Market has been in an intermediate down trend since early April 2018, for the first two months of the downtrend it had a strong momentum. Market then started to run out of steam but slowly pushing down until entering an 11 month channel with occasional fake outs to trap sellers and buyers. In November 2018 Market tested support at 1.1216 which is a very important level which held in May-June 2017 and November 2016. Price failed to break through and continued in its channel until testing the support again in 09 March 2019 and now which is current market price (02 April 2019). We see divergence on the weekly time frame for the 14 period RSI which indicates a reversal is eminent.
The question we have to answer now is that is this the end of a downtrend(intermediate), there is an 11 year old trend line which the market respects and could possibly be the long term target if the market were to reverse which is also a resistance for the primary downtrend.
In terms of fundamentals the US-China trade talks are still the main issue of concern, there is also Brexit for the Euro and Quantitative Easing, all these would be instrumental in driving the pair up to the 1.1800 which is possible were the trend line would extend to at the time.
