TESLA PT-2 TRILLION DOLLAR PAY CHECKI hope everything is clear now. I have exited all positions here and I am not going into news.
Elon is not going to tell me where my money is going
NOTE:NOT TRADING TSLA
QQQ

TESLA NOV 6 TRILLION DOLLAR PAY CHECKToday is the day for a lot of people with hope. Be careful & trade smartly.
I have explained the price action here.
YES I AM LONG
NOTE:IV IS HIGH SO STAY AWAY FROM OPTIONS

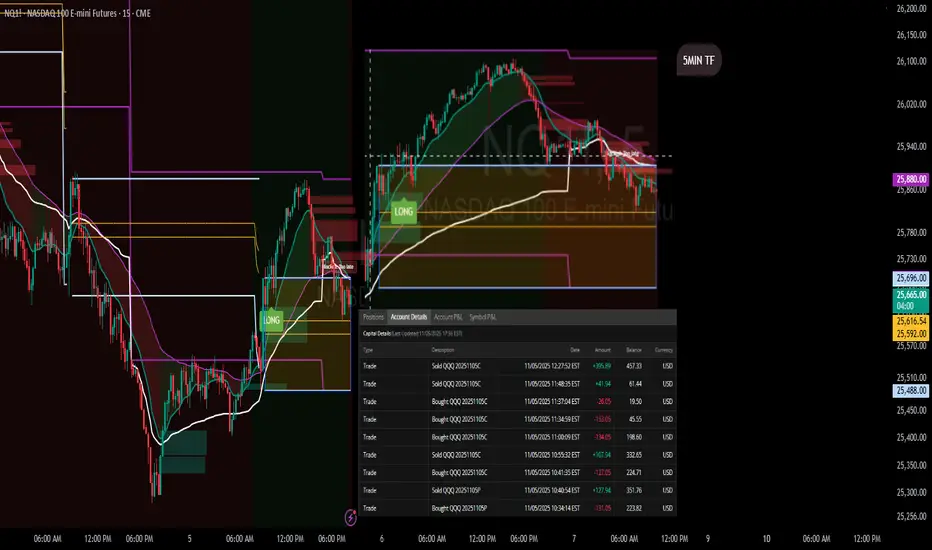
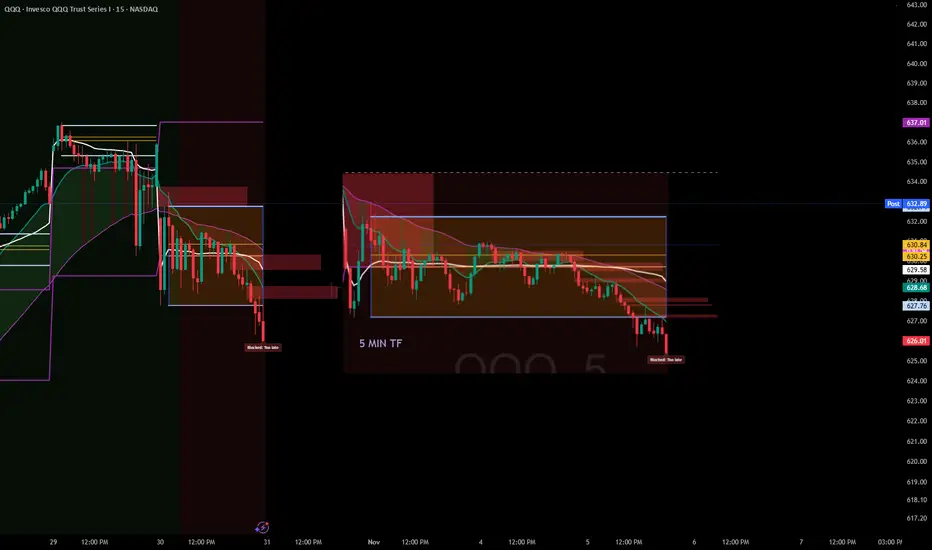
ORB Pro Signal Recap – Nov 5, 2025 | “Respect the Levels”Ticker: QQQ / NQ1! (5-min + 15-min TF)
Strategy: ORB Pro + Trendline Breakdown + Previous Day High Rejection
Focus: Signal confirmation & reaction zones
🧭 Market Context
The morning started strong, with buyers pushing off the open toward the previous day’s high (PDH) and ORB extension zone.
As price tapped the upper band, the ORB Pro system generated a clean long confirmation, aligned with the higher timeframe momentum.
But the rally quickly stalled at the PDH — a textbook reaction zone where the structure shifted.
From there, trendline breakdowns on both 5-min and 15-min charts confirmed exhaustion, and the system correctly prevented new long entries once momentum failed.
💹 Trade Breakdown
Initial Long: Taken on ORB Pro signal confirmation near the intraday retest (strong follow-through into PDH).
Profit-Take Zone: Price rejected sharply at the PDH and VWAP cluster — partials locked.
No Chasing: After the rejection, ORB Pro flagged “Blocked / Too Late,” keeping risk managed while trend flattened.
Result: Finished the day green with multiple small wins across calls — +$89.68 net on the $623C and +$15.89 on $626C.
📊 Performance Summary
Symbol Side Contracts Net Result
QQQ $623C Long 2 +$89.68
QQQ $626C Long 1 +$15.89
QQQ $622P Short hedge 1 –$3.11
Total P/L + $102.46 (Realized)
📈 Chart Recap
Price pushed through the early range with momentum but stopped exactly at the previous day’s ORB high and Fib confluence.
That rejection aligned perfectly with the HTF resistance zone on both 5-min and 15-min TFs.
The chart shows two green “LONG” entries and a clean signal fade once volume dropped —
a prime example of respecting structure over bias.
💡 Key Takeaways
PDH = Reaction Zone: Don’t ignore prior highs — they mark algorithmic defense zones.
Trust the Filters: ORB Pro prevented chasing the failed continuation after PDH rejection.
Structure First: The trendline breakdown confirmed what price was already telling us.
🧘♂️ Reflection
“The system signaled the move early, and I followed structure. PDH rejection confirmed the top, and discipline locked the profit. The goal wasn’t to predict — it was to react with control.”
QQQ : Stay heavy on positionsQQQ : Stay heavy on positions (QLD, TQQQ)
Entering a risk-on, high-volatility zone.
A signal for catching a bounce has emerged.
In stay light on positions zones, I hold QQQ and reduce exposure.
In stay heavy on positions zones, I increase allocation using a mix of QLD and TQQQ.
** This analysis is based solely on the quantification of crowd psychology.
It does not incorporate price action, trading volume, or macroeconomic indicators.

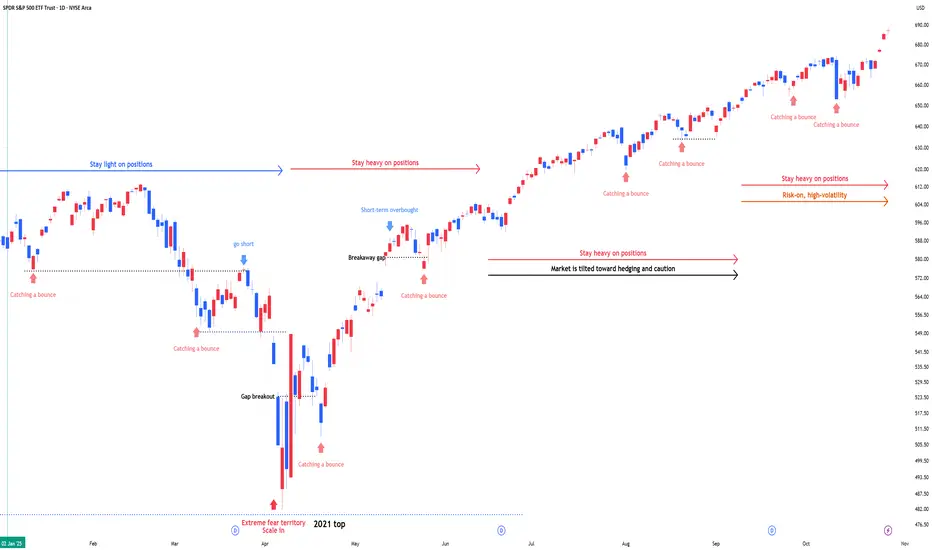
SPY : Stay heavy on positionsSPY : Stay heavy on positions (2x leverage)
Entering a risk-on, high-volatility zone.
A signal for catching a bounce has emerged.
In stay light on positions zones, I hold SPY(+QQQ) and reduce exposure.
In stay heavy on positions zones, I increase allocation using a mix of SSO(+QLD) and TQQQ.
** This analysis is based solely on the quantification of crowd psychology.
It does not incorporate price action, trading volume, or macroeconomic indicators.

Markets Looking SOFT at highs - Correction Underway (Key Levels)October 10th candle is a very important low for all US Markets
-S&P
-Nasdaq
-Dow
-Russell
The rally from that Oct 10 candle low (Friday) was met with aggressive
support but was only showing rallies in Mag 7 and AI related plays
Earnings for the most part are coming in meeting or exceeding expectations, but
price action is certainly looking soft with the market making lower highs and lower
lows for now
We have plenty of technical support, but given the longest US Government Shutdown
in history with dot.com like valuations (there is bubble and non-bubble evidence),
sentiment and elevated volatility are taking their toll and dragging the markets lower
I've closed a lot of open positions and de-risked the portfolio pretty severely this week
with the intention of finding ways to participate in a cautiously bullish environment. As I mention in the video, markets tend to V bottom, but round out the tops so the longer we
stall at these highs and the more "rounded" look we have near these highs, the more
fragile and support can be if we eventually see a break lower - TBD
Day to day, we continue to do good work carving out short-term winners and properly
position for what is next - good or bad
Thanks for watching. See you in the live markets
-Chris

Is AMD expensive? Earnings News!AMD just posted a double beat and reporting a record amount of revenue. crossing the $9billion mark.
The company expects revenue of about $9.6 billion for the next quarter, plus or minus $300 million, compared with analysts' average estimate of $9.15 billion.
AMD last month said it would supply AI chips to OpenAI in a multi-year deal that would bring in tens of billions of dollars in annual revenue and give the startup the option to buy up to roughly 10% of the chipmaker.
The deal covers the deployment of hundreds of thousands of AMD's graphics processing units (GPUs), roughly equivalent to the energy needs of 5 million U.S. households, or about thrice the amount of power produced by the Hoover Dam.
The stock still seems a bit expensive for my liking but a good solid report.

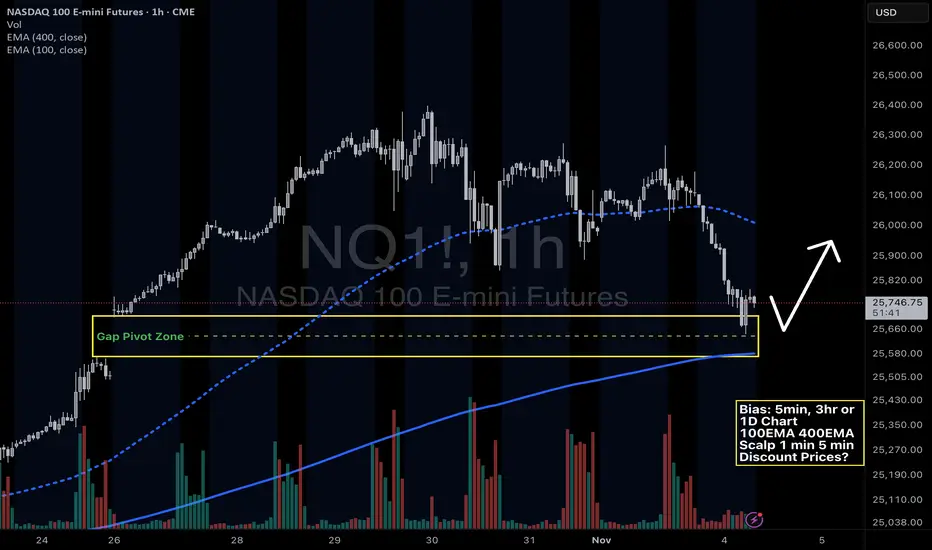
Nasdaq NQ - tapping into previous Gap Pivot ZoneNQ -Nasdaq Futures- pulled all the way back to the previous Gap up zone from October 26, 2025. Also, confluence with the 1 hour 400 EMA. Does this signal a bounce opportunity? Or does this signal that there will be a major news event that will occur? Is the market predictive of real life?
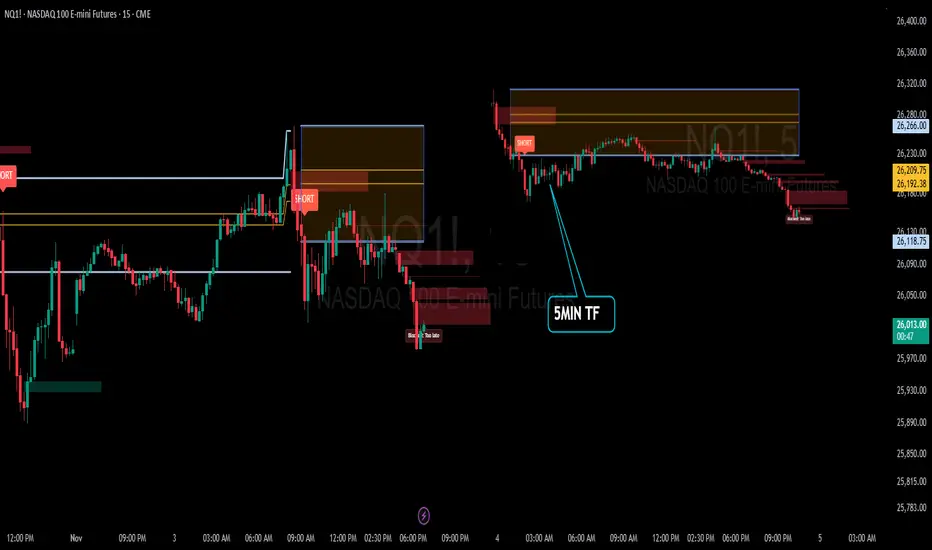
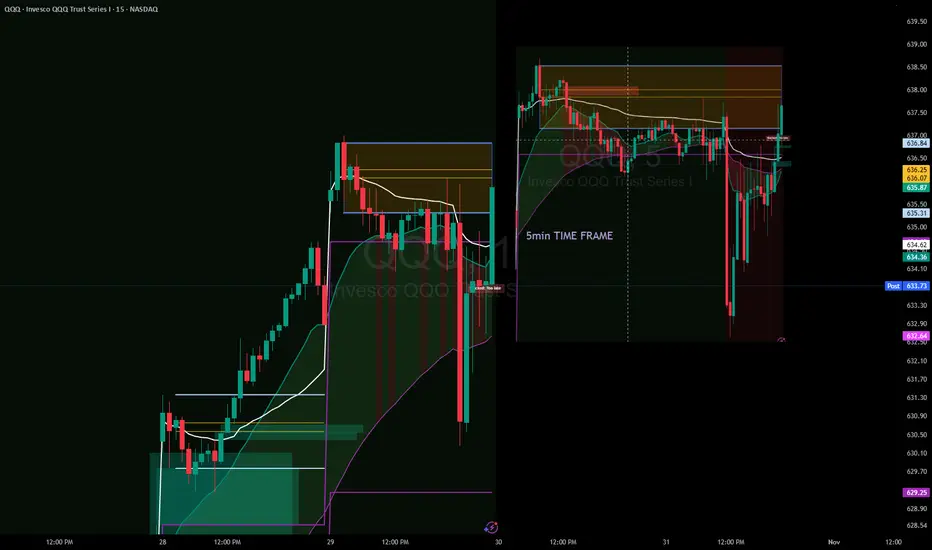
Recap: ORB Pro in Action | “Discipline > Direction”Date: November 3rd 2025
Ticker: QQQ / NQ1! (5-min TF)
Strategy: ORB Pro + Golden Pocket Retest + Volume Filter
Focus: Trend confirmation & controlled execution
🧭 Market Context
The morning opened sideways inside the ORB range — no clean conviction early on.
Around mid-morning, sellers gained control as lower highs formed beneath the EMA band and the Golden Pocket retest (0.5/0.618) failed with volume confirmation.
That break produced the clean short setup of the day, perfectly aligned with the higher-timeframe (HTF) downtrend.
🧠 Trade Review
Early Entries: Entered pre-confirmation and took initial heat.
Mid-Morning Setup: All filters aligned — EMA, volume, HTF direction. This was the textbook short that delivered follow-through.
Late Session Attempts: Momentum faded after lunch, with signals correctly blocked as “Too Late.”
Result: Several small wins offset by early losses, closing the day + $7.34 realized P/L after fees.
📊 Performance Snapshot
Metric Value
Win Rate ≈ 42 %
Best Trade + $287.94
Largest Loss – $189.05
Net Result + $7.34 (Realized)
Setup Accuracy High — execution mixed
📈 Chart Breakdown
The 5-minute chart highlighted a short trigger around 26 260 – 26 280, with smooth continuation into ORB extensions.
The ORB Pro filter marked “Blocked / Too Late” after the move — confirming that the system logic protected capital from late chases.
💡 Key Takeaways
Patience > Prediction — early entries rarely pay off.
Protect Green — partial profit lock once 1 R:R is reached.
System Strength — ORB Pro continues to validate structure when filters align.
🧘♂️ Reflection
“The system nailed the move — I jumped early. Still finished green, proving that execution discipline is the real edge. Tomorrow’s goal: one clean setup, one confident hold, and protect the profit.”
🧩 Next Steps
✅ Wait for full confirmation before entry
✅ Hold until 1:2 R:R min
✅ Avoid re-entries once HTF zone is tapped
$GEV Technical and Position UpdateNYSE:GEV Support and Trading Strategy Overview
Earnings and Revenue Performance
On October 22nd, NYSE:GEV missed earnings expectations. However, despite the miss, the company's earnings still grew by 368%. Additionally, revenue rose by 11.8% during the same period.
Support Area and Technical Indicators
An important area of support has been identified in the current price action for $GEV. The stock has remained above this support level for the past two trading days. Technically, NYSE:GEV has also regained its 5-day and 10-day moving averages (DMA) and is presently trading just below the 20-day exponential moving average (EMA).
Position Initiation and Risk Management
A half-size position was initiated at $587. A price alert is set on the horizontal support area, which is being monitored as a potential point to close the position if necessary. The actual stop is placed below the most recent low recorded on October 28th, at $565.00. Both the horizontal support area and the recent low represent attractive risk-reward levels aligned with the trading style being used.
Potential Position Additions
If the price manages to move above the 20-day EMA, there are plans to add to the existing position.
Important Disclaimer
Readers are encouraged to independently analyze this trading idea and strictly follow their own trading rules. It is important to remember that all investments carry risk. Making informed decisions with your own capital is essential.

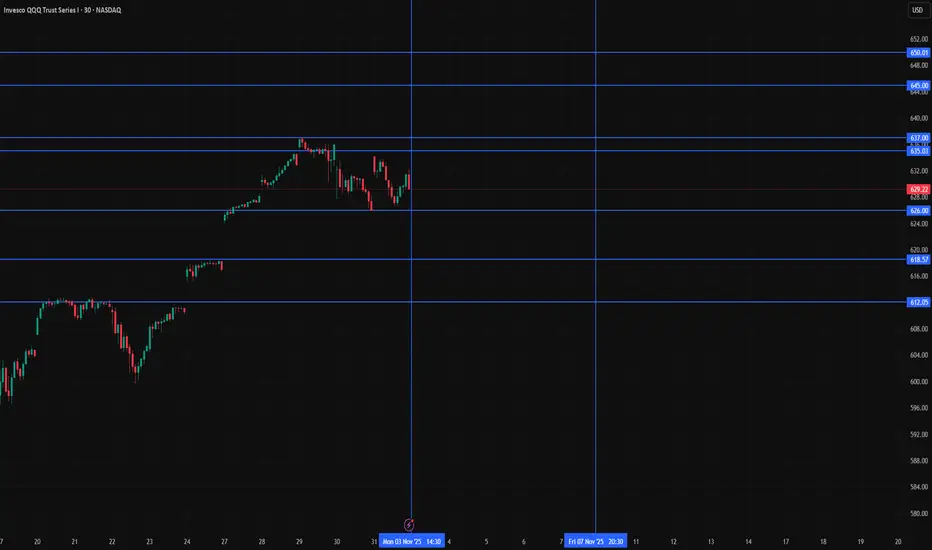
QQQ Weekly Map 3–7 Nov 2025Context
QQQ finished the week near the highs after a steady October climb. Buyers keep absorbing every shallow pullback. This week sits on two hinges. First, jobs and services data that nudge yields and implied vol. Second, a small cluster of tech earnings that can rotate leadership inside semis and handsets. The plan is simple. Let the market prove strength above the record band or let it pull back into patient demand. You will trade the reaction, not the forecast.
Chart setup
Use a one hour chart. Add 20 and 50 EMAs, a daily VWAP with bands, and the previous week high and low. Keep plots at global scope and turn lookahead off. Display VIX on a small separate pane for bias only.
Levels that matter
• 637.01 is the record high and the top of the current band
• 635 to 637 is the breakout ridge where wicks happen first and real holds happen later
• 629 is the Friday close reference for gap work on Monday
• 626 is last week’s first shelf where buyers defended cleanly
• 620 is a round shelf with memory from October
• 612 is the mean reversion area that often aligns with short term moving averages
• 597 is the bigger trend check where the intermediate crew steps in
How to read the week
Imagine a door at 637. When price opens that door and stays inside the new room for a while, trend traders have permission. If price knocks and gets rejected, range traders take the other side. If price steps down into 620 to 612 while volatility stays tame, that is where you seek bounces with tight risk. Your confirms are simple. VIX under the upper teens is friendly. Yields not jumping is friendly. If either flips, you slow down.
Three rules only
• Rule 1. Momentum only above the ridge. If cash breaks and holds above 637 for at least thirty minutes, take a starter. First target 645, stretch 650. Invalidate on a clean loss and thirty minute close back inside 635.
• Rule 2. Buy the dip into 620 to 612 only if volatility stays calm. Enter in the 620 to 612 pocket when VIX stays below your upper guardrail. Manage a first target 620 to 626 and trail. Invalidate on a decisive thirty minute close under 609 to 610.
• Rule 3. Risk first below 597. If the week forces a daily close below 597, treat it as a trend health check. Reduce gross and net and wait for a reclaim before trying to be a hero.
Why this works
One instrument. One band at the highs. One pocket for mean reversion. You are not predicting the data. You are pricing the reaction at the lines the market already respects. Breakout failures happen and that is fine because your hold filter removes most traps. Dips fail too and that is fine because your volatility guardrail removes the worst ones.
Intraday guide
• Morning plan. If we gap up into the ridge, let the first thrust exhaust and demand the hold. If we gap down toward 626, let the opening range print and only act after the first pullback.
• Midday plan. If price is inside 629 to 635 around lunch, expect chop. Trades there are optional.
• Afternoon plan. If the day is trending, trail behind a five minute reclaim of your entry line.
Risk and heat
Set maximum portfolio heat per idea at one half of one percent. Scale entries in thirds. Respect your stop even when it feels unfair. A string of small scratches is the tuition for the one clean runner that pays for the week.
Earnings and calendar awareness
AMD and Qualcomm after the close on Tuesday and Wednesday can swing semis and handsets. Shopify and Airbnb bookend consumer tone. The first week of the month carries ADP, services PMIs, ISM services, and payrolls. Do not guess the print. Trade the reaction at the levels on your chart. If VIX jumps before data, size down and wait for the dust to settle.
Cross checks
• If the ten year sits near recent levels or drifts lower, multiples breathe and the 637 break has better odds
• If VIX pins below the upper teens, dips are easier to buy
• If one of these flips, you slow down and treat the day like a range
Reminder
Education and analytics only. No advice. No guarantees. Process beats prediction.
Stock Market Forecast | TSLA NVDA AAPL AMZN META MSFTStock Market Forecast | CME_MINI:NQ1! CME_MINI:ES1! NASDAQ:NDX SP:SPX
Mag 7 | TSLA NVDA AAPL AMZN META MSFT GOOGL

QQQ: Weak Market & Bearish Forecast
Balance of buyers and sellers on the QQQ pair, that is best felt when all the timeframes are analyzed properly is shifting in favor of the sellers, therefore is it only natural that we go short on the pair.
Disclosure: I am part of Trade Nation's Influencer program and receive a monthly fee for using their TradingView charts in my analysis.
❤️ Please, support our work with like & comment! ❤️

LLY LOOKS BULLISH OCT 31 2025I have LLY from lower levels of 870ish which was trade 2. Trade 1 was initiated at 637. Now again it looks ready to go to 890
I am long since $815 yesterday.
Trade as per your risk management and its a current price trade so SLs would be huge. But I can understand what price is trying to do here.
LLY should breakout

A Lesson in Patience and structure - ORB waited till 2pm todayFellow traders,
Today tested patience more than precision.
The morning was a maze — choppy price action, overlapping candles, and zero conviction. The ORB range between 9:30–9:45 never gave clean confirmation. Buyers held the low, sellers pressed the top, but neither could gain control. Every candle said, “not yet.”
Then came midday compression. From 11 AM to 1:30 PM, QQQ coiled tightly under the EMAs and VWAP. That silence wasn’t random — it was the market loading energy. The moment VWAP was lost for good, the floodgates opened.
Finally, around 2 PM, the breakdown came: a clean retest rejection of the ORB box and an accelerated drop through 629. The move I had been watching all day finally unfolded — only this time, discipline said don’t chase.
And that’s the point of today’s session.
Not every move is yours to catch. Sometimes your biggest win is not forcing a trade that forms too late or breaks your system’s timing window.
Patience is part of the strategy.
The setup played out exactly as it should — I just didn’t have to be in it to learn from it.
Stay disciplined. Stay sharp.
— Trades with B ⚡
Daily Recap – The Patience Play (QQQ ORB Setup)Fellow traders,
Today was one of those sessions that remind us: sometimes the best trade is no trade at all.
The morning ORB (9:30 – 9:45 NY) gave us a wide initial range with very little conviction in either direction. We saw price flirt with both edges, but no candle could close decisively outside the box. Each push quickly reversed, leaving nothing but wicks and false momentum.
Volume stayed neutral and the EMAs never truly separated — a classic sign of indecision. Even the higher-timeframe (30-min) trend stayed flat, confirming there was no clean alignment to give us the confidence we needed.
Mid-session, price finally poked above the ORB high — but it immediately failed and rolled right back into the range. Later in the day, the real move came to the downside… well past the optimal ORB window. By then, discipline meant staying out.
👉 No setup, no entry — and that’s perfectly fine.
The goal isn’t to trade every day; it’s to trade only when probability lines up.
Tomorrow, we reset with the same rules:
Wait for a clean break and retest outside the ORB.
Confirm volume and trend.
Let the market come to us.
Stay patient, stay disciplined, and remember — consistency is built on the days you don’t force it.
— Trades with B
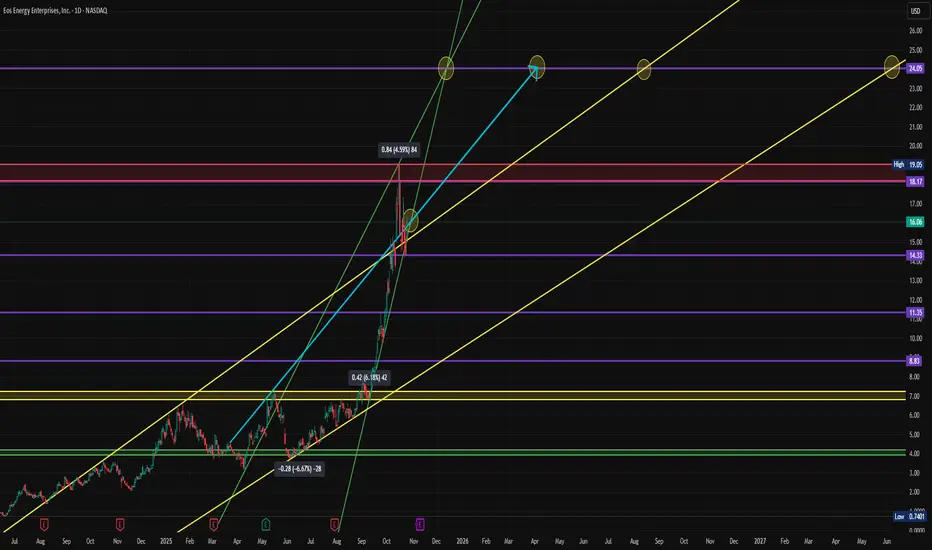
$EOSE - Next Move Above $18 or Pullback Reload to $14?NASDAQ:EOSE (Eos Energy Enterprises) has been a quiet outperformer this year — rising from $0.42 lows to a recent high near $18.17 (+4,000% YTD).
After a massive rally, price is now consolidating above $14.33 support while eyeing resistance near $19.05 and the next projection zone at $24.05 based on trend channel extensions (see chart).
🧩 Technical Breakdown
📈 Primary uptrend intact — higher highs / higher lows since May 2025.
🟡 Support: $14.33 (major structural level), $11.35 secondary, $8.83 extended.
🔵 Resistance: $18.17 then $19.05 (high confluence).
🎯 Upside targets: $24.05 and $26 via Fib 1:1 extension.
⚠️ Risk zone: Break below $14.00 could invite a pullback toward the 11–9 region before the next leg up.
📊 Fundamental Context
Recent catalysts keep bulls interested despite volatility:
Guggenheim raised its price target from $10 to $20 (maintaining a Buy rating).
$24 million economic development package awarded by Pennsylvania & Allegheny County for U.S. manufacturing expansion.
Multi-year partnership with Unico to launch ultra-compact power conversion products for domestic LDES systems.
📉 Counter-Sentiment Data (From Schwab QORE Analytics)
Schwab currently rates EOSE as F (Strongly Underperform) with High volatility — a classic contrarian setup that often precedes sharp re-ratings once earnings stabilize (next report expected week of Nov 4).
Momentum metrics show +41.4% over 4 weeks and +209.9% over 26 weeks — this is not a quiet chart.
💡 My Plan
Looking for entries around $14.33 support with a tight stop below $14.00. If stopped out, I’ll wait for accumulation in the $11–9 zone for a lower-risk swing position into Q4/Q1 ’26.
Above $19 opens the door to $24+ in the coming months if the manufacturing story keeps momentum.
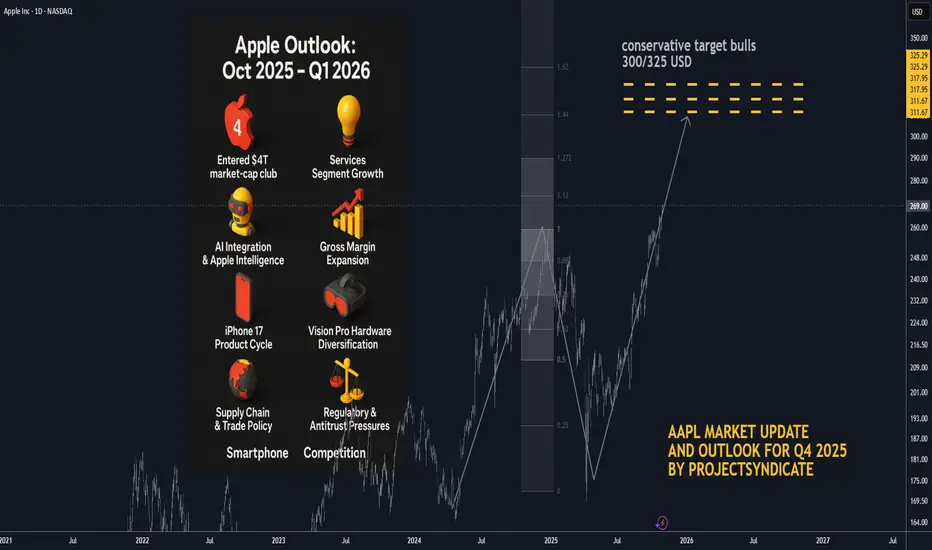
AAPL: Q1 2026 Target and Updated Outlook BULLS🍏 Apple Outlook: Oct 2025 – Q1 2026
🧠 Status and Tape Read. Apple (AAPL) has entered the $4 T market-cap club on Oct 28–29 2025, propelled by strong iPhone 17 sell-through and Services momentum. Shares pushed toward the $270 area intraday before easing, marking a powerful reversal from mid-year consolidation. Near-term, positioning is elevated into Thursday’s print; options imply ~±4% move on earnings.
📈 Path into Q1’26. Our base case shifts from a prolonged correction to a higher-low / buy-the-dip regime: dips toward the mid-$240s–$250s should attract sponsorship unless Services rolls over or China iPhone demand fades. A constructive tape through Q1’26 hinges on (1) Apple Intelligence engagement metrics, (2) iPhone 17 replacement/Android switcher rates, and (3) regulatory overhang.
📰 What’s New and recent headlines
🏆 Apple hits $4 T market value for the first time, joining Nvidia and Microsoft. Drivers: iPhone 17 traction and Services strength; stock up sharply since spring.
🗓️ Earnings set for Thu, Oct 30 (after-close); Street looking for growth in revenue/EPS; Services eyed >$100 B annual run-rate.
🔼 Loop Capital upgraded AAPL to Buy with $315 PT ahead of the move, citing iPhone cycle acceleration.
🧾 “Who Bought 8 Million Shares?”
🧺 JPMorgan Large Cap Growth Fund (SEEGX) increased its Apple position by ~8.15 million shares to ~32.9 million shares, per latest fund tracking.
⚙️ Catalysts Shaping Apple’s Stock Price in 2025–26
🤖 AI Integration & Apple Intelligence — Strength: 9/10
Rollout of on-device Apple Intelligence and upgraded Siri remains the core narrative into 2026. Look for user engagement datapoints and third-party app integrations at/after earnings. A positive read-through would validate the iPhone super-cycle argument.
💡 Services Segment Growth — Strength: 8.5/10
Consensus expects Services to push past a $100 B annual clip; durability watched versus regulatory pressure (DMA in EU, global app store scrutiny). A sustained >13% YoY growth print keeps multiple support intact.
📊 Gross Margin Expansion & Cost Efficiencies — Strength: 8/10
Management has guided 46–47% GM for FQ4 (tariff headwind embedded). Mix shift to Services + component deflation support FY26 margin resilience.
📱 iPhone 17 Product Cycle — Strength: 8/10 (↑ from 7.5)
Early sell-through outpacing prior gen in the U.S. and China within first days; the iPhone 17 (incl. “Air”) is the incremental driver restoring unit momentum.
🥽 Vision Pro & Hardware Diversification — Strength: 7/10
Next-gen devices + Apple Intelligence tie-ins create optionality; still niche near-term but adds ecosystem gravity.
💵 Capital Returns — Strength: 7/10
$110 B buyback authorization remains a floor; watch cadence vs. stock at ATHs and post-print cash deployment commentary.
🌏 Supply Chain & Trade Policy — Strength: 6.5/10
China exposure/tariffs remain a swing factor; Apple has been absorbing some costs rather than pushing through prices on key models.
⚖️ Regulatory & Antitrust Pressures — Strength: 6/10
DMA compliance and global app store cases could trim Services take-rate; monitor any remedial changes called out on the call.
📈 Macro & Rates — Strength: 5/10
“Higher for longer” limits multiple expansion; any disinflation/soft-landing upside would expand P/E support.
🥊 Smartphone Competition — Strength: 5/10
Android OEM velocity still high in EM; Apple’s cycle needs sustained switcher share to outrun.
💼 Earnings Set-Up: FQ4 reporting Thu Oct 30 2025
📅 Consensus into print:
• Revenue: ~$101–104 B (TipRanks ref: $102.2 B)
• EPS: ~$1.74–$1.82 (TipRanks ref: $1.78)
• Gross Margin guide: 46–47% (company indication)
• Services: watch for >$100 B annualized pace confirmation
• Implied move: options pricing ~±4%
🎧 Watch items on the call: Apple Intelligence activation/MAUs, iPhone 17 channel inventory, China mix, Services take-rate headwinds (EU), GM puts/takes (tariffs), cap-return cadence.
🎯 Street Positioning & Targets
🔼 Loop Capital: Buy, PT $315 (Oct 20/21 2025).
📊 General take: Many houses remain Overweight; focus turning to 2026 EPS power and AI monetization path.
🧭 Tactical View 0–3 Months
📈 Into/after print: Choppy but constructive. Chasing at ATHs is risky; prefer buy-on-weakness zones near $248–255 with stop discipline. A bullish guide/Services beat could sustain a breakout; a light AI engagement update or China wobble likely gets faded back into the mid-$250s.
⚠️ Risk-case: Regulatory headline or guide below mid-single-digit growth could quickly compress P/E and retest the $240s.
🚀 Bull-case: Clean beat/raise + AI usage KPIs → re-rate toward $290–300 into holiday.
🏁 Quick Milestone Recap
🥇 $4 Trillion Market Cap achieved on Oct 28–29 2025, making Apple the third public company (after Nvidia, Microsoft) to reach the level; iPhone 17 momentum and Services strength cited across coverage.
QQQ : Stay heavy on positionsQQQ : Stay heavy on positions (QLD, TQQQ)
Entering a risk-on, high-volatility zone.
In stay light on positions zones, I hold QQQ and reduce exposure.
In stay heavy on positions zones, I increase allocation using a mix of QLD and TQQQ.
** This analysis is based solely on the quantification of crowd psychology.
It does not incorporate price action, trading volume, or macroeconomic indicators.

SPY : Stay heavy on positionsSPY : Stay heavy on positions (2x leverage)
Entering a risk-on, high-volatility zone.
In stay light on positions zones, I hold SPY(+QQQ) and reduce exposure.
In stay heavy on positions zones, I increase allocation using a mix of SSO(+QLD) and TQQQ.
** This analysis is based solely on the quantification of crowd psychology.
It does not incorporate price action, trading volume, or macroeconomic indicators.
QQQ rally to 700Chart is about as simple as can be. If the COVID rally can do it, then the AI rally can to.

$FLY Firefly Stock Position Update and AnalysisOverview of Recent Positioning in Firefly ( NASDAQ:FLY )
On October 6th, I initiated a position in Firefly stock, purchasing a quarter-size allocation following the company's announcement of a deal to acquire SciTec, a firm specializing in military technology solutions. This acquisition was highlighted by Firefly CEO Jason Kim, who stated, "The acquisition of SciTec enhances our ability to support a growing number of defense missions and provides us with a significant operational advantage. SciTec's mission-proven software and big data processing capabilities provide warfighters with rapid, accurate information to enable informed decisions."
Stock Performance and Position Adjustment
After the acquisition news, Firefly's shares climbed 6.3% on Monday, October 6th closing at $29.09, with my entry price at $28.75. The stock continued to show strength, rallying again on October 8th. In response to this price action, I increased my stake by adding another quarter-size position, bringing my total investment to a half-size allocation.
Technical Analysis and Trading Plan
Since increasing my position, Firefly stock has traded sideways, which I interpret as a base-building phase. In today’s premarket trading, the price has moved just above what appears to be a key area of resistance, marked by a blue horizontal line on the 65-minute chart. Looking ahead, there is another potential resistance level at the previous high’s AVWAP (Anchored Volume Weighted Average Price).
I have set an alert on the AVWAP level. If the stock price breaks above this point, I plan to increase my allocation to a full-size position.
Trading Principles
As always, I encourage readers to analyze this idea independently and adhere to their personal trading rules. Please remember that any investment involves risk, and it is essential to make informed decisions with your own capital.

$TMUS Earnings and Technical AnalysisUndercut and Reverse Pattern Observed in TMUS
On October 23rd, T-Mobile US (TMUS) released its earnings report, surpassing analyst expectations. Despite the positive results, the stock initially experienced a sell-off and closed down approximately 3.3%. The overall downward movement exceeded 5%, with trading on October 24th pushing the stock below its June lows. However, the following day saw a positive shift, as the stock closed higher and rallied past the previous June low. This price action meets the criteria for an Undercut and Rally formation.
Trading Strategy and Position Management
After observing these developments, I waited until today to confirm a potential follow-through day. When the stock rallied above yesterday’s high, I initiated a new position at half of my typical size, setting a stop-loss just below the most recent low to manage risk. Despite this move, TMUS remains under all of its key moving averages. It is currently attempting to reclaim the 5-day moving average (DMA). The next targets for the stock would be the 10-day and then the 20-day moving averages. Should TMUS successfully move above the 20 DMA, I plan to consider adding to my position.
Q3 2025 Earnings Performance
On Thursday, October 23, 2025, at 6:58 AM ET, T-Mobile US reported earnings of $2.59 per share for the third quarter ended September 2025, with revenue totaling $21.96 billion. These results exceeded consensus estimates of $2.42 per share in earnings and $21.73 billion in revenue. The Earnings Whisper number was $2.56 per share, indicating that TMUS beat expectations by 1.17%. Additionally, revenue increased by 8.90% compared to the same period last year.
Disclaimer
Readers are strongly encouraged to conduct their own analysis and to adhere to their personal trading rules. Investing in the stock market always carries risk, and it is essential to make informed decisions with your own capital.
