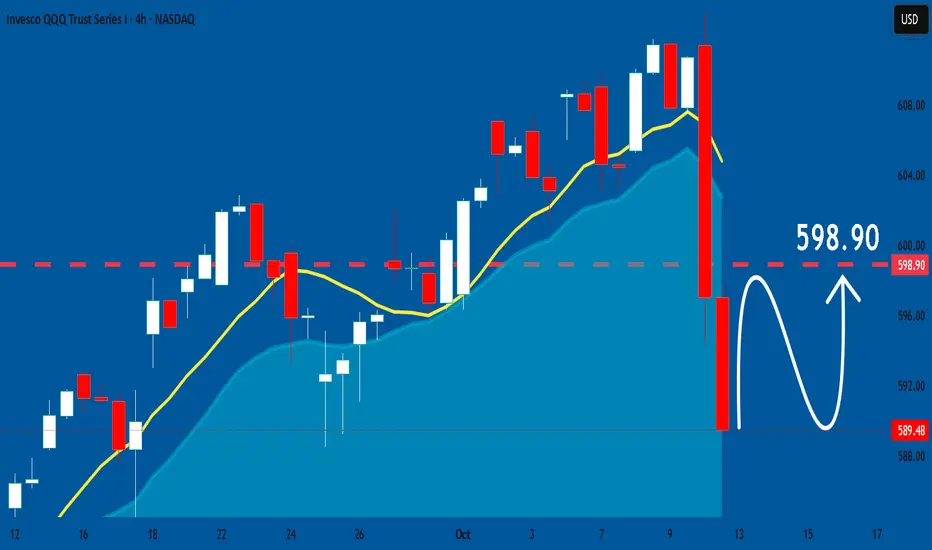
QQQ Will Collapse! SELL!
My dear followers,
I analysed this chart on QQQ and concluded the following:
The market is trading on 617.00 pivot level.
Bias - Bearish
Technical Indicators: Both Super Trend & Pivot HL indicate a highly probable Bearish continuation.
Target - 605.94
About Used Indicators:
A super-trend indicator is plotted on either above or below the closing price to signal a buy or sell. The indicator changes color, based on whether or not you should be buying. If the super-trend indicator moves below the closing price, the indicator turns green, and it signals an entry point or points to buy.
Disclosure: I am part of Trade Nation's Influencer program and receive a monthly fee for using their TradingView charts in my analysis.
———————————
WISH YOU ALL LUCK
QQQ
Stock Market Forecast | TSLA NVDA AAPL AMZN META MSFTStock Market Forecast | CME_MINI:NQ1! CME_MINI:ES1! SP:SPX NASDAQ:NDX
Mag 7 | TSLA NVDA AAPL AMZN META MSFT GOOGL

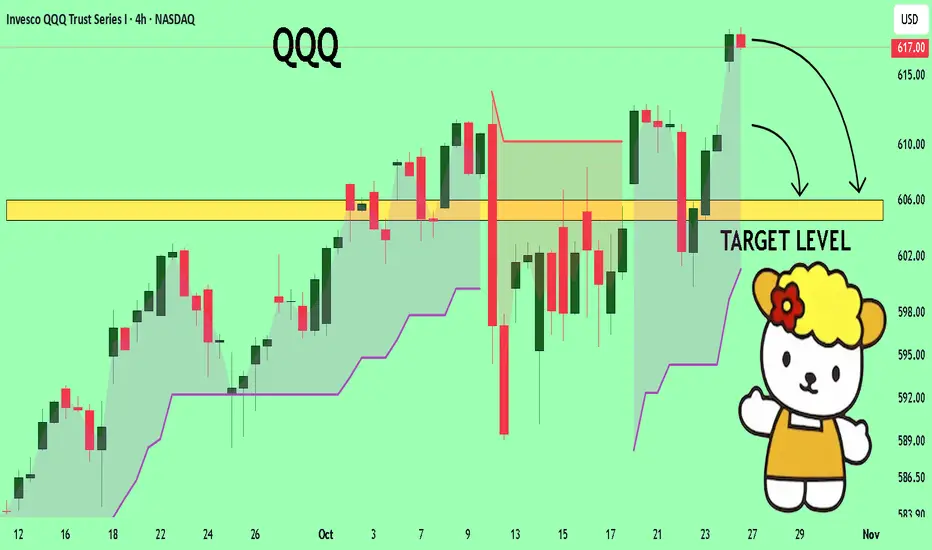
QQQ: Short Trading Opportunity
QQQ
- Classic bearish formation
- Our team expects fall
SUGGESTED TRADE:
Swing Trade
Sell QQQ
Entry Level - 617.00
Sl -620.43
Tp - 610.34
Our Risk - 1%
Start protection of your profits from lower levels
Disclosure: I am part of Trade Nation's Influencer program and receive a monthly fee for using their TradingView charts in my analysis.
❤️ Please, support our work with like & comment! ❤️
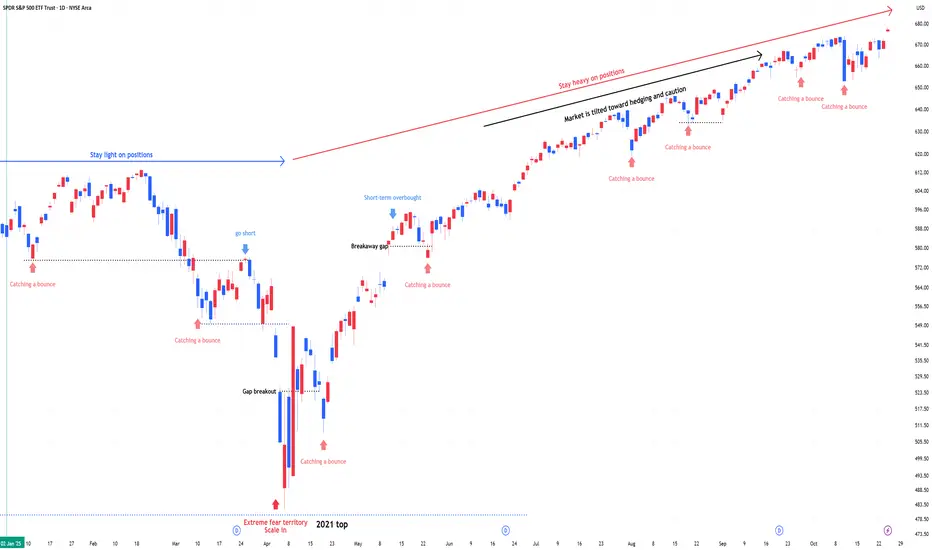
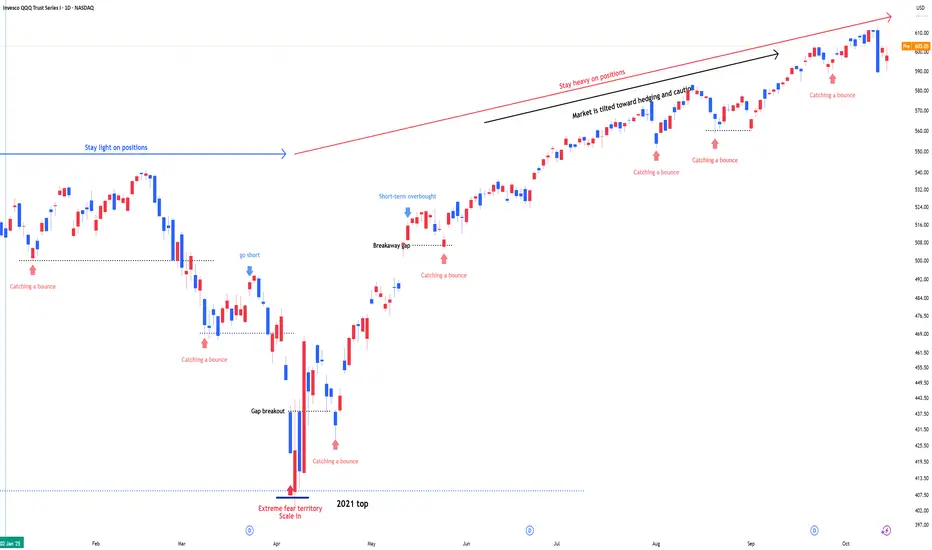
QQQ : Stay heavy on positionsQQQ : Stay heavy on positions (QLD, TQQQ)
Entering a risk-on, high-volatility zone.
In stay light on positions zones, I hold QQQ and reduce exposure.
In stay heavy on positions zones, I increase allocation using a mix of QLD and TQQQ.
** This analysis is based solely on the quantification of crowd psychology.
It does not incorporate price action, trading volume, or macroeconomic indicators.

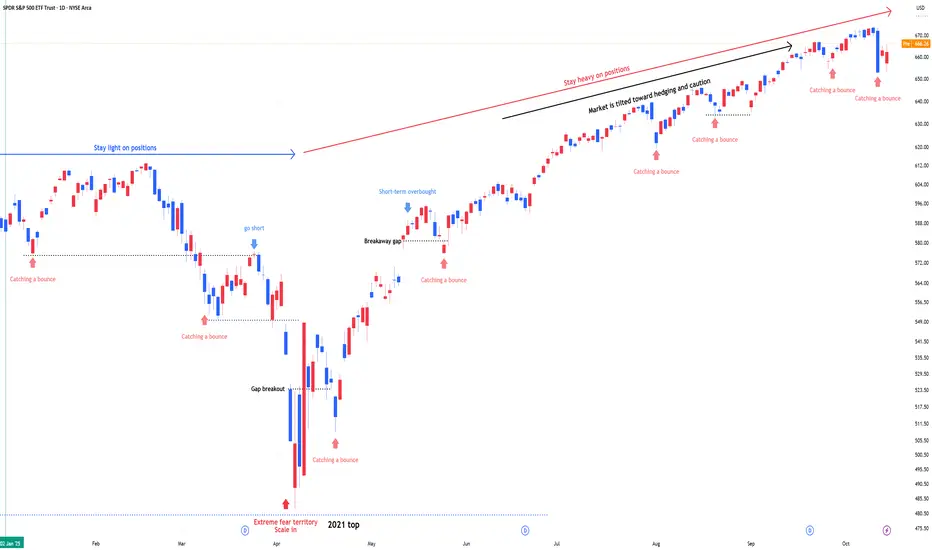
SPY : Stay heavy on positionsSPY : Stay heavy on positions (2x leverage)
Entering a risk-on, high-volatility zone.
In stay light on positions zones, I hold SPY(+QQQ) and reduce exposure.
In stay heavy on positions zones, I increase allocation using a mix of SSO(+QLD) and TQQQ.
** This analysis is based solely on the quantification of crowd psychology.
It does not incorporate price action, trading volume, or macroeconomic indicators.
$PLTR Basing Analysis: 3-Month Technical OutlookFor the past twelve weeks, NASDAQ:PLTR has been consolidating near its all-time high (ATH). This prolonged basing period has resulted in the formation of a distinctive wedging pattern, commonly known as a Volatility Contraction Pattern (VCP). This pattern, popularized by Mark Minervini, is characterized by decreasing price swings and tightening ranges.
Technical Pattern and Implications
The VCP that has emerged on NASDAQ:PLTR 's chart typically signals a potential continuation in the direction of the prevailing trend. In this instance, the trend leading into the pattern has been upward, suggesting that a breakout to the upside could be the most likely scenario.
Trading Plan
To prepare for a possible breakout, an alert has been set just below the horizontal resistance area. If this alert is triggered, the plan is to initiate a new position in anticipation of further upward movement. While price targets are not usually set, in this case, an estimated gain of approximately 18% is anticipated following a breakout. This projection is based on the depth of the pullback from the ATH.
Risk Management and Disclaimer
Readers are strongly encouraged to conduct their own analysis and to adhere to their personal trading rules. Investing in the stock market always carries risk, and it is essential to make informed decisions with your own capital.

GOLD Bull Market Price Target is 7 500 USD accumulate on dips🏆 Gold Market Long-Term Update 12/24 months
📊 Technical Outlook Update
🏆 Bull Market Overview
▪️2weeks/candle price chart
▪️Gold Bull market in progress
▪️1976/1979 650% gains - Bull Market 1
▪️1999/2012 650% gains - Bull Market 2
▪️2016/2027 650% gains- Bull Market 3
▪️Price Target BULLS 7500 USD
▪️650% gains off the lows
▪️will hit in 2026/2027
⭐️Recommended strategy
▪️BUY/HOLD accumulate dips
▪️BUY/HOLD physical gold
▪️BUY/HOLD GLD/GDX

QQQ - NASDAQ Has Never Been This ExpensiveQQQ relative to the money supply reveals that markets have never been this expensive in history. Despite the significant amount of money pumped in during the COVID-19 pandemic, the economy has not kept pace with all the zeros added to Gov debt.
If we can't lower deficits now at max employment, when will we?
Tulips!
Caution is in order despite what "experts" may tell you.
Click like Follow Subscribe, let's get to 5,000 followers.

S&P 500 Elliott Wave Analysis: Approaching the End of Wave 5I believe the S&P 500 is nearing the end of wave 5, possibly complete already or very soon, based on ES future and SPX charts. The wave 4 low from April 2025 (~5000) should be retested in a 3-wave ABC pullback, targeting late 2026 to early 2027, aligning with Fibonacci time frames. RSI divergence and ending patterns support this. Thoughts?

S&P Stalls, Gold & Silver Reality Check, US vs China WatchGold and Silver finally correcting - and I'm dollar cost averaging into dips
US Indexes (S&P, Nasdaq, Dow, Russell) stalling just off of all-time highs
Sideways is a behavior and it might seem boring, but it's certainly better than
the market rolling over and falling hard for 5-10% corrections (TBD)
AI Narrative remains optimistic
-I like the utilities, energy, and physical goods side of AI over software and hype
Financials and CAPEX spending remains firm
-money continues to flow into this AI buildout
Trump vs China is likely noise and eventual concessions and agreements
are likely the outcome - but the market is waiting for proof for now
US CPI data hitting Friday (first real US news in weeks) - does the market react?
Watch for broadening pattern and fakeouts, but the big tell with this market
pushing for more upside is the massive drop in VIX last week and once again
flirting with all-time highs
Thanks for watching!!!
-Chris

SANTA RALLY OR BLACK FRIDAY ..... ZOOMThis is a zoom into the 1hour detail up til the predicted November low (dead cat bounce zone)

SANTA RALLY OR BLACK FRIDAY ...... THOUGHTS?This is this weekend's whiteboard projections for the next 6months.
This shows a slight reclaim this week but a continuation of lower highs and lower lows.
Then a drop to the bottom of the narrower channel when China tariffs & rare earth restrictions are reflected in earnings guidance as Mag7 reports Q3 results.
Dead cat bounce into Thanksgiving after the market pullback on guidance.
Then only a Trump tweet can give us a Santa Rally, otherwise the other shoe falls and we get a Black Friday/Monday after Thanksgiving.
Followed by a controlled selloff through Q4/Q1 earnings & poor guidance.
Chart forecasts finding a bottom in April 2026.
Please share your charts/forecasts into April 2026. (I am pretty new to this if you can't tell by my charts)

Stock Market Forecast | TSLA NVDA AAPL AMZN META MSFTStock Market Forecast | CME_MINI:NQ1! CME_MINI:ES1! SP:SPX NASDAQ:NDX
MAG 7 | TSLA NVDA AAPL AMZN META MSFT GOOGL

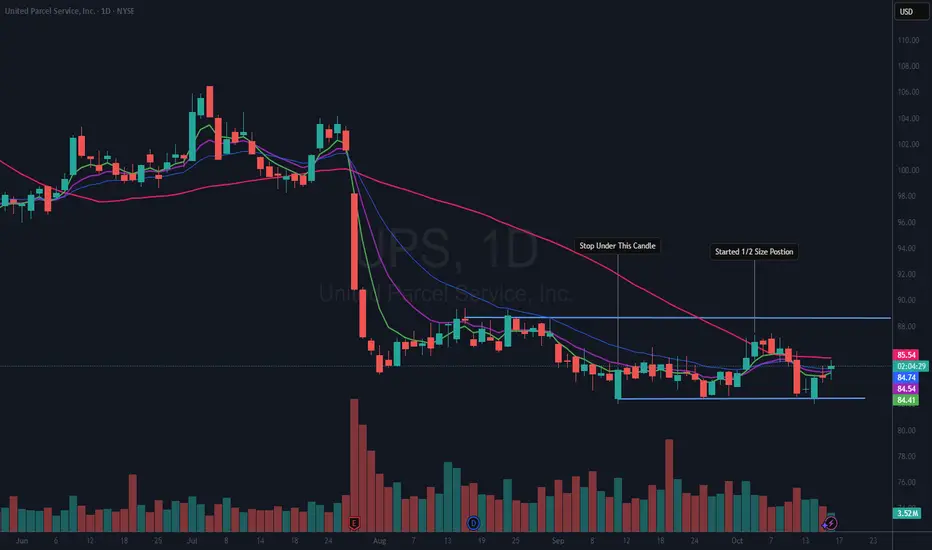
$UPS Stock Analysis and Trading StrategyOverview of UPS Price Movements
UPS reached an all-time high (ATH) of $198.25, with a 52-week high at $145.01 and a 52-week low at $82.00. The stock experienced a significant decline, falling more than 58% from its ATH and over 43% from its 52-week high. After monitoring the company’s steady downward trend for several years, a sharp drop following the latest earnings report renewed interest in its performance.
Initial Entry and Position Management
Interest in a long position was sparked when the 50-day moving average (DMA) caught up with the stock’s price. On October 3rd, a half-sized position was initiated after observing three consecutive up days, which suggested a potential bottom. This move was confirmed as the price closed above both the 21-day exponential moving average (EMA) and the 50 DMA. The stop-loss was set just below the recent lowest low of $82.00.
Current Trade Status and Analysis
The trade remains active, although currently underwater, as the original stop-loss has not been triggered. The double bottom theory now guides the position, since the low on October 14th also touched the $82.00 level and rebounded. Presently, the price is slightly below my buy point but continues to test the 50 DMA, which has now leveled out.
Future Trading Strategy
The plan is to hold the position until either a breakout above the blue resistance area occurs—at which point the position would be increased in anticipation of a stage 2 breakout—or until the price falls below $82.00, activating the stop-loss. If not currently in this trade, the preferred approach would be to wait for the stock to close above the 50 DMA again or for a breakout above the upper horizontal resistance area before entering.
Disclaimer
Readers are encouraged to conduct their own analysis and adhere to personal trading rules. Investing always involves risk, so it is crucial to make informed decisions with your own capital.
TESLA EARNINGS OCT 16 2025Price action for Tesla is here. I have clearly explained my plan on how to trade tesla considering every factor in market.
STAY AWAY FROM TRADING TESLA
NOTE: OPTION WILL BURN YOUR CAPITAL

$ETSY: Ready for Stage 2 Breakout?Technical Analysis
ETSY appears to be developing two significant technical patterns. The first is a Volatility Contraction Pattern (VCP), which often signals a potential breakout as volatility diminishes and price tightens. The second pattern is a Base on Base formation, suggesting a period of consolidation that can precede strong upward movement. Additionally, the stock is currently trading at or above all major moving averages, further supporting a bullish technical outlook.
Fundamental Highlights
• NYSE Transition: On September 29, 2025, Etsy announced its intention to move its stock listing to the New York Stock Exchange, with the transition becoming effective on October 13, 2025. CEO Josh Silverman explained that this move aims to enhance transparency and attract a wider range of institutional investors.
• OpenAI Partnership: Also on September 29, Etsy revealed a new partnership with OpenAI. This collaboration will power AI-driven shopping experiences, including the integration of advanced product discovery tools into mobile platforms and enabling visual search capabilities to help shoppers find similar items on Etsy.
• Executive Reorganization: On September 4, 2025, Etsy announced changes in its executive team, with Rafe Colburn being promoted to Chief Product and Technology Officer.
Trading Considerations
An alert is set at $73.50, anticipating an early entry if the stock breaks above the Flat Base pattern identified on the chart. This level may indicate the start of a new upward trend.
Disclaimer
Readers are encouraged to conduct their own analysis and follow personal trading rules. Investing always carries risk, so it is important to make informed decisions using your own capital.

Weekly LIQUIDITY CYCLES under Elliot WAVE The post posted is my thesis for Risk as to flow of money under my theory of Velocity of money flow !
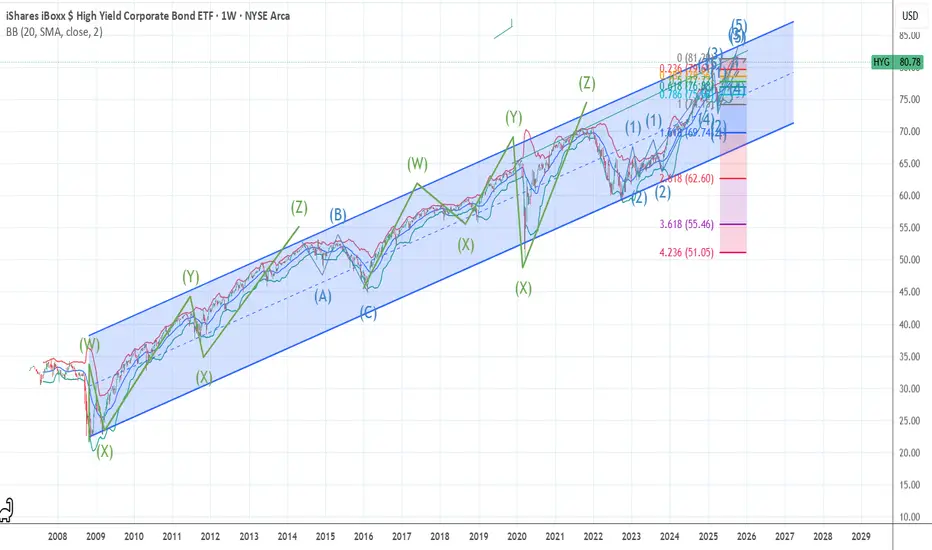
FINAL WAVE IN LIQUIDITY CYCLE WORLD WIDE Chart posted of High yield ETF is my thesis as to the liquidity cycle in the risk assets I will post the weekly in a few mins Then the wheels come off the bus .

QQQ : Stay heavy on positionsQQQ : Stay heavy on positions (QLD, TQQQ)
Entering a risk-on, high-volatility zone.
In stay light on positions zones, I hold QQQ and reduce exposure.
In stay heavy on positions zones, I increase allocation using a mix of QLD and TQQQ.
** This analysis is based solely on the quantification of crowd psychology.
It does not incorporate price action, trading volume, or macroeconomic indicators.
SPY : Stay heavy on positionsSPY : Stay heavy on positions (2x leverage)
Entering a risk-on, high-volatility zone.
In stay light on positions zones, I hold SPY(+QQQ) and reduce exposure.
In stay heavy on positions zones, I increase allocation using a mix of SSO(+QLD) and TQQQ.
** This analysis is based solely on the quantification of crowd psychology.
It does not incorporate price action, trading volume, or macroeconomic indicators.
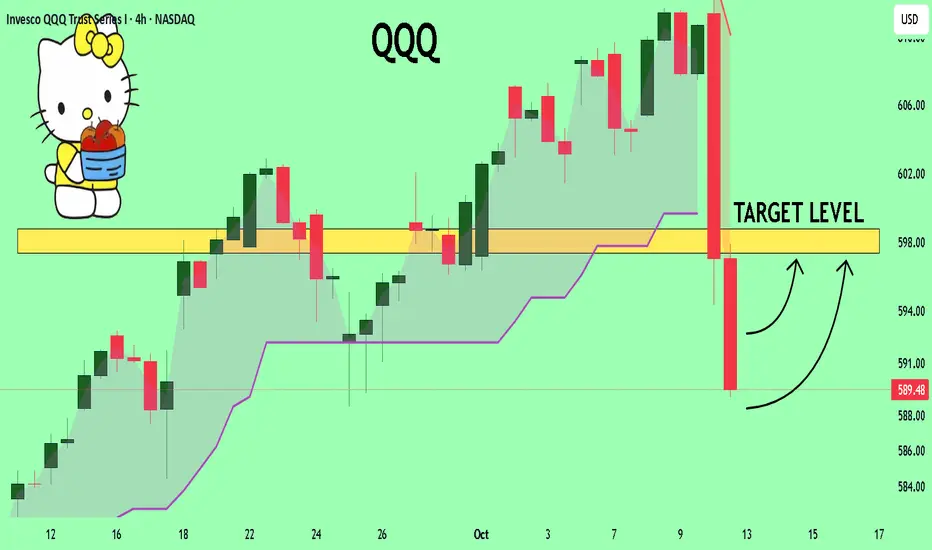
QQQ Set To Grow! BUY
My dear friends,
QQQ looks like it will make a good move, and here are the details:
The market is trading on 569.48 pivot level.
Bias - Bullish
Technical Indicators: Supper Trend generates a clear long signal while Pivot Point HL is currently determining the overall Bullish trend of the market.
Goal - 597.36
About Used Indicators:
Pivot points are a great way to identify areas of support and resistance, but they work best when combined with other kinds of technical analysis
Disclosure: I am part of Trade Nation's Influencer program and receive a monthly fee for using their TradingView charts in my analysis.
———————————
WISH YOU ALL LUCK
Stock Market Forecast | TSLA NVDA AAPL AMZN META MSFTStock Market Forecast | CME_MINI:NQ1! CME_MINI:ES1! SP:SPX NASDAQ:NDX
Mag 7 | TSLA NVDA AAPL AMZN META MSFT GOOGL

QQQ: Growth & Bullish Continuation
It is essential that we apply multitimeframe technical analysis and there is no better example of why that is the case than the current QQQ chart which, if analyzed properly, clearly points in the upward direction.
Disclosure: I am part of Trade Nation's Influencer program and receive a monthly fee for using their TradingView charts in my analysis.
❤️ Please, support our work with like & comment! ❤️