Building Better Inputs: The Foundation of AI Trading Success
The Best Algorithm in the World Can't Fix Bad Inputs
Here's a secret that separates amateur AI traders from professionals:
The model architecture matters far less than the features you feed it.
Feature engineering - the art of transforming raw data into meaningful inputs — is where the real edge lives.
---
What Is Feature Engineering?
Definition:
Feature engineering is the process of creating input variables (features) from raw data that help machine learning models make better predictions.
In Trading:
Transforming raw price, volume, and other data into signals that capture market behavior.
The Core Principle:
Raw data (OHLCV) contains information, but it's often hidden. Features extract and highlight that information.
---
Why Feature Engineering Matters
1. Models Learn from Features, Not Raw Data
A model seeing learns little
A model seeing learns patterns
Features encode the relationships that matter
2. Domain Knowledge Becomes Computable
"Price is extended" → Z-score feature
"Volume is unusual" → Volume ratio feature
"Trend is strong" → ADX feature
3. Reduces Noise, Amplifies Signal
Raw prices contain noise
Well-designed features filter noise
Model focuses on what matters
4. Enables Simpler Models
Good features + simple model often beats
Bad features + complex model
Interpretability improves
---
Categories of Trading Features
Category 1: Price-Based Features
Returns:
Simple returns: (Close - Previous Close) / Previous Close
Log returns: ln(Close / Previous Close)
Multi-period returns: 5-day, 20-day, 60-day
Price Relationships:
Distance from high/low
Distance from moving average
Price relative to range (where in today's range)
Candle Features:
Body size: |Close - Open|
Upper wick: High - max(Open, Close)
Lower wick: min(Open, Close) - Low
Body to range ratio
---
Category 2: Trend Features
Moving Average Features:
Price above/below MA (binary)
Distance from MA (continuous)
MA slope (trend direction)
MA crossover signals
Trend Strength:
ADX value
Consecutive higher highs/lower lows
Linear regression slope
R-squared of price trend
Trend Duration:
Bars since trend started
Bars since last MA cross
Time in current regime
---
Category 3: Momentum Features
Oscillators:
RSI value
RSI zone (oversold/neutral/overbought)
Stochastic %K and %D
CCI value
Rate of Change:
ROC over various periods
Momentum acceleration/deceleration
Momentum divergence from price
Relative Momentum:
Performance vs benchmark
Sector relative strength
Percentile rank of momentum
---
Category 4: Volatility Features
Range-Based:
ATR (Average True Range)
ATR ratio (current ATR / historical ATR)
Range expansion/contraction
Standard Deviation:
Rolling standard deviation
Bollinger Band width
Z-score of price
Volatility Regime:
High/low volatility classification
Volatility percentile
Volatility trend (increasing/decreasing)
---
Category 5: Volume Features
Volume Ratios:
Volume / Average volume
Volume trend (increasing/decreasing)
Relative volume by time of day
Price-Volume Relationships:
Up volume vs down volume
Volume on up days vs down days
OBV (On-Balance Volume)
Volume-price trend
Volume Patterns:
Volume spike detection
Volume climax signals
Accumulation/distribution
---
Category 6: Time Features
Calendar Features:
Day of week
Month of year
Quarter
Days until/since events (earnings, FOMC)
Session Features:
Time of day
Session (Asian, European, US)
Minutes since open/until close
Cyclical Encoding:
Sin/cos transformation for cyclical features
Preserves cyclical relationships
Day of week: sin(2π × day/7), cos(2π × day/7)
---
Category 7: Cross-Asset Features
Correlation Features:
Rolling correlation with benchmark
Correlation regime changes
Beta to market
Relative Features:
Spread between assets
Ratio between assets
Relative performance
Market Context:
VIX level and change
Sector performance
Market breadth
---
Feature Engineering Best Practices
Practice 1: Normalize Features
Raw values vary wildly across assets and time.
Methods:
Z-score: (value - mean) / std
Min-max scaling: (value - min) / (max - min)
Percentile ranking
Why: Models work better with normalized inputs.
---
Practice 2: Handle Look-Ahead Bias
Features must only use data available at prediction time.
Common Mistakes:
Using future data in calculations
Normalizing with full dataset statistics
Including target information in features
Solution: Always use rolling/expanding windows.
---
Practice 3: Create Interaction Features
Combine features to capture relationships.
Examples:
RSI × Trend direction
Volume ratio × Price change
Volatility × Momentum
Why: Captures conditional relationships.
---
Practice 4: Lag Features Appropriately
Include historical values of features.
Examples:
RSI 1 bar ago, 5 bars ago, 20 bars ago
Return over last 1, 5, 20, 60 periods
Volatility change over time
Why: Captures temporal patterns.
---
Practice 5: Test Feature Importance
Not all features help. Some hurt.
Methods:
Correlation with target
Feature importance from tree models
Ablation studies (remove and test)
Why: Reduces overfitting, improves interpretability.
---
AI-Powered Feature Engineering
1. Automated Feature Generation
AI can generate thousands of feature combinations:
Mathematical transformations
Interaction terms
Lagged versions
2. Feature Selection
AI identifies which features actually help:
Removes redundant features
Identifies most predictive features
Optimizes feature set for model
3. Dynamic Feature Weighting
AI adjusts feature importance over time:
Some features work better in certain regimes
Adaptive weighting based on recent performance
Regime-specific feature sets
4. Deep Learning Feature Extraction
Neural networks can learn features automatically:
Convolutional layers for pattern detection
Recurrent layers for sequence patterns
Attention mechanisms for importance weighting
---
Feature Engineering Mistakes
Too Many Features - More features ≠ better model. Overfitting risk increases. Curse of dimensionality. Start simple, add complexity only if needed.
Highly Correlated Features - Multiple features measuring the same thing. Redundancy without benefit. Check correlation matrix, remove duplicates.
Unstable Features - Features that change dramatically with small data changes. Unreliable in live trading. Test stability across time periods.
Ignoring Domain Knowledge - Letting AI generate features without trading logic. May find spurious patterns. Combine AI generation with human curation.
Not Testing Out-of-Sample - Features that work in-sample may fail out-of-sample. Always validate on unseen data.
---
Building Your Feature Library
Step 1: Start with Fundamentals
Returns (multiple timeframes)
Volatility (ATR, std dev)
Trend (MA relationships)
Momentum (RSI, ROC)
Volume (ratios, trends)
Step 2: Add Domain-Specific Features
What do you look for when trading?
Encode your analysis into features
Test if they add predictive value
Step 3: Create Derived Features
Combinations of base features
Regime indicators
Cross-asset relationships
Step 4: Continuously Refine
Monitor feature performance
Remove degraded features
Add new features as markets evolve
---
Key Takeaways
Feature engineering transforms raw data into meaningful model inputs
Good features often matter more than model complexity
Categories include price, trend, momentum, volatility, volume, time, and cross-asset
Always normalize, avoid look-ahead bias, and test out-of-sample
AI can automate feature generation and selection, but domain knowledge guides the process
---
Your Turn
What features do you find most predictive in your trading?
Have you experimented with creating custom features?
Share your feature engineering insights below 👇
Quanttrading

RSI SMA Cross – BTC & ETH Multi-Timeframe TestThe RSI SMA crossover is a simple and widely used TradingView strategy, often assumed to behave consistently once “good” parameters are selected. Rather than evaluating it on a single symbol or timeframe, I tested how the same logic performs across different market environments.
For this test, I ran a parameter sweep across multiple symbols and timeframes, keeping the strategy logic fixed while varying only RSI length and SMA length within reasonable ranges. The test covered BTCUSDT and ETHUSDT across 4H, 1D, 3D, and 1W timeframes, resulting in 160 total combinations.
The goal was not to find a single optimal configuration, but to observe whether performance is driven more by indicator parameters or by the trading environment itself.
Representative Results (Risk-Adjusted)
Below are four configurations that best illustrate the results and support the overall conclusions. These were selected for balance between profitability, drawdown, and trade frequency rather than headline return alone.
1) BTCUSDT — 1D (Most Stable Overall)
RSI Length: 28
SMA Length: 50
Profit Factor: ~1.77
Trades: ~109
This configuration showed the most consistent risk-adjusted behavior across nearby parameter sets and was less sensitive to small changes than others.
2) BTCUSDT — 1D (Lower Drawdown Variant)
RSI Length: 21
SMA Length: 50
Profit Factor: ~1.70
Trades: ~121
Slightly lower profitability than the first configuration, but meaningfully lower drawdown, highlighting a trade-off between responsiveness and stability.
3) ETHUSDT — 1D (Best ETH Environment)
RSI Length: 28
SMA Length: 40
Profit Factor: ~1.55–1.60
Trades: ~110–120
ETH showed acceptable performance on the daily timeframe, but drawdowns were consistently higher than BTC under similar settings.
4) BTCUSDT — 4H (Higher Activity, Lower Stability)
RSI Length: 28
SMA Length: 40
Profit Factor: ~1.55–1.60
Trades: 400+
Lower timeframes increased trade frequency substantially but introduced significantly more drawdown and instability.
Takeaway
Across all tests, performance varied far more by symbol and timeframe than by RSI or SMA length. Small parameter changes often mattered less than the environment the strategy was applied to. Some symbol/timeframe combinations remained relatively stable, while others deteriorated quickly despite using identical logic.
The broader takeaway is that strategy performance is often environment-dependent rather than parameter-dependent. Evaluating a strategy on a single symbol or timeframe can give a misleading sense of robustness. Testing across multiple environments provides a clearer view of where a strategy holds up and where it breaks down.
I’m documenting these tests to better understand robustness, sensitivity, and how commonly used TradingView strategies behave under different market conditions.

I backtested over 1,000 Delta-RSI combinations on BTCDelta-RSI is a widely used momentum strategy on TradingView, particularly in its filtered variants.
Rather than evaluating it through a single backtest or relying on default settings, I tested the strategy by exploring its parameter space more broadly.
For this run, I swept 1,080 Delta-RSI parameter combinations on BTCUSDT (1D). Parameters varied included RSI length, signal smoothing, polynomial order, volume filter period, and long/short logic, all within reasonable, non-extreme ranges. The goal was not to find a single “optimal” setup, but to understand how performance behaves as assumptions shift slightly.
Best-Performing Configurations (by risk-adjusted outcomes)
Below are the three most balanced configurations observed during the sweep, selected for a combination of return, drawdown, and consistency rather than headline profit alone:
1)
RSI Length: 21
Signal Length: 6
Polynomial Order: 3
Length (> Order): 45
Avg. Volume Over Period: 50
Long: true
Short: false
Profit: +82.42%
Max Drawdown: −20.68%
Win Rate: 46.4%
Profit Factor: 1.62
Trades: 138
2)
RSI Length: 14
Signal Length: 6
Polynomial Order: 3
Length (> Order): 40
Avg. Volume Over Period: 10
Long: true
Short: false
Profit: +79.85%
Max Drawdown: −15.86%
Win Rate: 51.5%
Profit Factor: 1.62
Trades: 138
3)
RSI Length: 14
Signal Length: 6
Polynomial Order: 3
Length (> Order): 40
Avg. Volume Over Period: 30
Long: true
Short: false
Profit: +79.85%
Max Drawdown: −15.86%
Win Rate: 51.5%
Profit Factor: 1.62
Trades: 138
These configurations form a small cluster of relative stability, but even within this cluster, performance remained sensitive to modest parameter changes. Nearby configurations often produced meaningfully different drawdown profiles despite similar profitability.
The takeaway is less about Delta-RSI specifically and more about strategy evaluation in general. Single backtests can be misleading. When examining the full distribution of outcomes, parameter fragility becomes much harder to ignore, and apparent performance often depends more on tuning than on structural robustness.
I’m documenting these tests to better understand the difference between headline performance and true stability when evaluating commonly used TradingView strategies.

AI in Trading: Hype, Hope, and Hard Truths# TradingView Post: AI in Trading (TradingView Formatting)
"I just made a ChatGPT trading bot that's up 300% in backtests!"
I see this exact post at least 5 times a week. And every time, I know exactly how it ends—blown account, confused trader, and another person convinced that "AI doesn't work in trading."
Here's the uncomfortable truth: AI absolutely works in trading. Just not the way most people think.
The problem isn't the technology—it's that everyone's obsessed with the sexiest part (predicting the next candle) while ignoring the parts that actually make money.
After building dozens of systematic strategies for clients across crypto, forex, and equities, I've learned this: the hard part of trading isn't generating signals. It's managing risk, optimizing execution, and knowing when your edge has disappeared.
Let me show you where AI actually creates alpha—and why your "predictive model" probably won't.
━━━━━━━━━━━━━━━━━━━━━━
The Real Problem With AI Signal Generation
Before we get to what works, let's talk about why most AI trading bots fail:
The Data Problem:
Markets are non-stationary (the game changes constantly)
You need 10,000+ samples for reliable ML models
But market regimes shift every 200-500 bars
You're essentially training on data from a different game
The Overfitting Trap:
Your LSTM "learned" patterns that existed once and may never repeat
95% backtest accuracy? That's usually a red flag, not a green light
Walk-forward testing reveals most models have zero predictive power out-of-sample
The Competition Reality:
Renaissance Technologies has PhDs, decades of data, and billions in infrastructure
Your GPU and 2 years of OHLCV data isn't competing with that
By the time a pattern is obvious enough for simple ML to find, it's arbitraged away
Can pure signal generation work? Yes—but it's the hardest application of AI in trading, not the easiest.
━━━━━━━━━━━━━━━━━━━━━━
Where AI Actually Adds Value (The Unsexy Truth)
Here's what nobody tells you: institutional quant funds use AI heavily, just not for predicting price direction. They use it for the operational advantages that compound over thousands of trades.
1. Position Sizing & Risk Management
Traditional fixed-percentage position sizing (risk 2% per trade) ignores market reality. Sometimes 2% is too aggressive, sometimes it's leaving money on the table.
I've tested reinforcement learning models that dynamically adjust position sizes based on:
Current market volatility regime (VIX, ATR percentiles)
Correlation breakdown between portfolio assets
Recent strategy performance and drawdown depth
Portfolio heat distribution across sectors
Real result from a client system: 23% reduction in maximum drawdown vs. fixed sizing, with nearly identical total returns. The AI wasn't predicting price—it was predicting when the edge was strongest and sizing accordingly.
2. Execution Optimization
This is where prop shops and hedge funds actually deploy ML. Not for signals—for getting better fills.
What ML handles:
Predicting optimal order slicing (VWAP vs. TWAP vs. aggressive IOC)
Detecting liquidity windows in crypto markets (when to place limit orders vs. market orders)
Minimizing slippage on larger positions
Predicting short-term volatility spikes that would hurt execution
Practical example: A simple gradient boosting model analyzing order book depth, bid-ask spread, and recent volume patterns can save 5-15 basis points per trade. On a $100K position, that's $50-150 saved per execution. Over 1,000 trades per year? That's $50K-150K in improved performance.
3. Regime Detection & Strategy Allocation
Stop trying to predict the next candle. Instead, predict the type of market environment you're in.
Use unsupervised learning (K-means clustering, Hidden Markov Models, Gaussian Mixture Models) to identify:
High volatility vs. low volatility regimes
Trending vs. mean-reverting environments
Risk-on vs. risk-off sentiment periods
Correlation expansion/contraction across assets
Why this matters: A moving average crossover that prints money in trending markets will destroy your account in choppy, range-bound conditions. A mean reversion strategy that works beautifully in low volatility will get steamrolled during breakouts.
Implementation: Train an ensemble model on market features (volatility, correlation, volume patterns, momentum indicators). When it detects Regime A, allocate to Strategy Set 1. When it detects Regime B, switch to Strategy Set 2. When confidence is low, reduce exposure across the board.
4. Feature Engineering & Dynamic Signal Weighting
You have 50 technical indicators on your chart. Which ones actually matter right now ?
This changes constantly:
RSI works until the market trends hard, then it's a disaster
Volume patterns matter way more in crypto than traditional equities
Correlation indicators are useless until suddenly they're everything (crisis periods)
Different lookback periods perform differently across volatility regimes
ML solution: Use ensemble methods (Random Forests, XGBoost) to dynamically weight and combine signals based on recent regime and performance.
Instead of: "Buy when RSI < 30"
You get: "Buy when the ensemble model says momentum + volume + volatility features align, weighted by recent regime performance"
Client example: Combined 12 traditional strategies (each with proven edge) with an ML meta-strategy that allocated capital between them. The ML didn't find new edges—it figured out which existing edges to use when. Result: Sharpe ratio improved from 1.1 to 1.7 over 3 years live.
━━━━━━━━━━━━━━━━━━━━━━
The Hybrid Approach That Actually Works
After building systems that survive real markets (not just backtests), here's the architecture that works:
Layer 1 - Core Signals (Traditional Quant):
Mean reversion strategies based on statistical patterns
Momentum breakout systems with volume confirmation
Arbitrage opportunities and structural edges
These are your "alpha generators" with proven statistical edge
Layer 2 - AI Risk Management:
Reinforcement learning for dynamic position sizing
ML models for stop-loss placement and profit-taking
Volatility prediction for exposure adjustment
Layer 3 - AI Strategy Allocation:
Regime detection to switch between strategy sets
Performance-based weighting of different approaches
Correlation analysis for portfolio construction
Layer 4 - AI Execution:
Order optimization based on current liquidity
Slippage prediction and mitigation
Timing of trade execution within the day
Real system I deployed for a crypto client:
Core: 8 different mean reversion + momentum strategies (all traditionally backtested)
AI Layer: Reinforcement learning for position sizing based on volatility regime
ML Layer: Random forest classifier for regime detection (trending vs. ranging vs. high volatility)
Execution: Gradient boosting model for order placement timing
Result: Sharpe ratio improved from 1.2 to 1.8 over 3 years of live trading, max drawdown reduced by 31%
The AI didn't find magic price prediction patterns. It made better decisions about when to trade , how much to risk , and how to execute .
━━━━━━━━━━━━━━━━━━━━━━
What You Should Actually Build
If you're serious about AI in trading, here's my recommendation:
Start here (High ROI, Lower Difficulty):
Build a regime detection system first
Create position sizing rules that adapt to volatility
Optimize your execution (especially in crypto)
Test strategy allocation across different market conditions
Only then consider (High Difficulty, Questionable ROI):
Pure price prediction models
Red flags to avoid:
Any model with >90% backtest accuracy (probably overfit)
Systems that don't account for transaction costs and slippage
Strategies that haven't been walk-forward tested
Anything that can't explain why it should work
━━━━━━━━━━━━━━━━━━━━━━
The Bottom Line
If someone's selling you an AI system that "predicts market direction with 95% accuracy," run away. That's either overfitted garbage or a scam.
If someone's using AI to dynamically manage risk, optimize execution, detect regime changes, and intelligently allocate between proven strategies? That's actually how professionals use it.
The unsexy truth: The best use of AI in trading isn't prediction—it's decision-making around the edges that already exist.
Stop chasing the signal generation hype. Start thinking about the full trading pipeline. That's where the real alpha is hiding.
━━━━━━━━━━━━━━━━━━━━━━
💬 Question for the community: Are you using AI for signal generation or operational optimization? What's been your experience?
🔔 Follow for more quant reality checks—no hype, just data and systems that work in production
📩 Building systematic strategies that need to survive real markets? I specialize in risk-aware ML systems, hybrid quant approaches, and turning backtests into production-ready code. DM me to discuss your project.
━━━━━━━━━━━━━━━━━━━━━━

EURUSD - LongEURUSD – BUY Setup
📊 H4 Timeframe Analysis by Nii_Billions
🔹 Outlook: BULLISH
Using multiple timeframe confirmation for direction.
Strategy blends technicals, fundamentals, and sentiment.
Entry, SL, and TP structured with risk management in mind.
🟢 Educational purposes only 🟢
❤️ Like & comment if this helps your trading journey.
👉 Follow for more swing trade ideas.

Signal-to-Noise Ratio: The Most Misunderstood Truth in Trading█ Signal-to-Noise Ratio: The Most Misunderstood Truth in Quant Trading
Most traders obsess over indicators, signals, models, and strategies.
But few ask the one question that defines whether any of it actually works:
❝ How strong is the signal — compared to the noise? ❞
Welcome to the concept of Signal-to-Noise Ratio (SNR) — the invisible force behind why some strategies succeed and most fail.
█ What Is Signal-to-Noise Ratio (SNR)?
⚪ In simple terms:
Signal = the real, meaningful, repeatable part of a price move
Noise = random fluctuations, market chaos, irrelevant variation
SNR = Signal Strength / Noise Level
If your signal is weak and noise is high, your edge gets buried.
If your signal is strong and noise is low, you can extract alpha with confidence.
In trading, SNR is like trying to hear a whisper in a hurricane. The whisper is your alpha. The hurricane is the market.
█ Why SNR Matters (More Than Sharpe, More Than Accuracy)
Most strategies die not because they’re logically flawed — but because they’re trying to extract signal in a low SNR environment.
Financial markets are dominated by noise.
The real edge (if it exists) is usually tiny and fleeting.
Even strong-looking backtests can be false positives created by fitting noise.
Every quant failure story you’ve ever heard — overfitting, false discoveries, bad AI models — starts with misunderstanding the signal-to-noise ratio.
█ SNR in the Age of AI
Machine learning struggles in markets because:
Most market data has very low SNR
The signal changes over time (nonstationarity)
AI is powerful enough to learn anything — including pure noise
This means unless you’re careful, your AI will confidently “discover” patterns that have no predictive value whatsoever.
Smart quants don’t just train models. They fight for SNR — every input, feature, and label is scrutinized through this lens.
█ How to Measure It (Sharpe, t-stat, IC)
You can estimate a strategy’s SNR with:
Sharpe Ratio: Signal = mean return, Noise = volatility
t-Statistic: Measures how confident you are that signal ≠ 0
Information Coefficient (IC): Correlation between forecast and realized return
👉 A high Sharpe or t-stat suggests strong signal vs noise
👉 A low value means your “edge” might just be noise in disguise
█ Real-World SNR: Why It's So Low in Markets
The average daily return of SPX is ~0.03%
The daily standard deviation is ~1%
That's signal-to-noise of 1:30 — and that's for the entire market, not a niche alpha.
Now imagine what it looks like for your scalping strategy, your RSI tweak, or your AI momentum model.
This is why most trading signals don’t survive live markets — the noise is just too loud.
█ How to Build Strategies With Higher SNR
To survive as a trader, you must engineer around low SNR. Here's how:
1. Combine signals
One weak signal = low SNR
100 uncorrelated weak signals = high aggregate SNR
2. Filter noise before acting
Use volatility filters, regime detection, thresholds
Trade only when signal strength exceeds noise level
3. Test over longer horizons
Short-term = more noise
Long-term = signal has more time to emerge
4. Avoid excessive optimization
Every parameter you tweak risks modeling noise
Simpler systems = less overfit = better SNR integrity
5. Validate rigorously
Walk-forward, OOS testing, bootstrapping — treat your model like it’s guilty until proven innocent
█ Low SNR = High Uncertainty
In low-SNR environments:
Alpha takes years to confirm (t-stat grows slowly)
Backtests are unreliable (lucky noise often looks like skill)
Drawdowns happen randomly (even good strategies get wrecked short-term)
This is why experience, skepticism, and humility matter more than flashy charts.
If your signal isn’t strong enough to consistently rise above noise, it doesn’t matter how elegant it looks.
█ Overfitting Is What Happens When You Fit the Noise
If you’ve read Why Your Backtest Lies , you already know the dangers of overfitting — when a strategy is tuned too perfectly to historical data and fails the moment it meets reality.
⚪ Here’s the deeper truth:
Overfitting is the natural consequence of working in a low signal-to-noise environment.
When markets are 95% noise and you optimize until everything looks perfect?
You're not discovering a signal. You're just fitting past randomness — noise that will never repeat the same way again.
❝ The more you optimize in a low-SNR environment, the more confident you become in something that isn’t real. ❞
This is why so many “flawless” backtests collapse in live trading. Because they never captured signal — they captured noise.
█ Final Word
Quant trading isn’t about who can code the most indicators or build the deepest neural nets.
It’s about who truly understands this:
❝ In a world full of noise, only the most disciplined signal survives. ❞
Before you build your next model, launch your next strategy, or chase your next setup…
Ask this:
❝ Am I trading signal — or am I trading noise? ❞
If you don’t know the answer, you're probably doing the latter.
-----------------
Disclaimer
The content provided in my scripts, indicators, ideas, algorithms, and systems is for educational and informational purposes only. It does not constitute financial advice, investment recommendations, or a solicitation to buy or sell any financial instruments. I will not accept liability for any loss or damage, including without limitation any loss of profit, which may arise directly or indirectly from the use of or reliance on such information.
All investments involve risk, and the past performance of a security, industry, sector, market, financial product, trading strategy, backtest, or individual's trading does not guarantee future results or returns. Investors are fully responsible for any investment decisions they make. Such decisions should be based solely on an evaluation of their financial circumstances, investment objectives, risk tolerance, and liquidity needs.

Why the Best Strategies Don’t Last — A Quant TruthOver the years, I’ve built strong connections with traders on the institutional side of the market.
One of the most interesting individuals I met was a former trader at Lehman Brothers. After the collapse, he transitioned into an independent quant. I flew to Boston to meet him, and the conversations we had were eye-opening, the kind of insights retail traders rarely get exposed to.
We didn’t talk about indicators or candlestick patterns.
We talked about how fast and aggressive algorithmic trading really is.
He told me something that stuck:
" People think hedge funds build one algorithm, run it for years, and collect returns. That’s rarely the case. Most algos are extremely reactive. If something stops working, we don’t fix it — we delete it and move on. That’s how the process works."
This isn’t an exception — it’s standard practice.
What stood out most in our talks was how adaptable these algorithms are. If market conditions shift — even slightly — the logic adapts immediately. These systems aren’t built on beliefs or opinions.
They’re built to respond to liquidity, volatility, and opportunity — nothing more.
This level of responsiveness is something most retail traders never factor into their approach, but it’s core to how modern markets operate.
█ How Quant Funds Use Disposable Strategies — And What Retail Can Learn
One of the most misunderstood realities in modern trading is how top quantitative funds like Two Sigma, Citadel, and Renaissance Technologies deploy, monitor, and replace their strategies.
Unlike traditional investors who develop a strategy and stick with it for years, many quant funds take a performance-first, outcome-driven approach. They:
Build hundreds of strategies,
Deploy only the ones that currently work, and
Retire or deactivate them the moment performance drops below their internal thresholds.
This is a deliberate, statistical, and unemotional process — and it's something that most retail traders have never been taught to think about.
█ What This Means
Quantitative firms often run:
100s of models simultaneously,
Each targeting a specific edge (e.g. trend-following, mean reversion, intraday order flow),
With tight risk controls and performance monitoring.
When a model:
Falls below a minimum Sharpe ratio (risk-adjusted return),
Starts underperforming vs benchmark,
Experiences a breakdown in statistical significance…
…it is immediately deprecated (removed from deployment).
No ego. No "fixing it."
Just replace, rebuild, and redeploy.
█ It runs live… until it doesn’t.
If slippage increases → they pull it.
If volatility regime changes → they pull it.
If too many competitors discover it → they pull it.
If spreads tighten or liquidity dries → they pull it.
Then? They throw it away, rebuild something new — or revive an old one that fits current conditions again.
█ Why They Do It
⚪ Markets change constantly
What worked last month might not work this week — due to regime shifts, volatility changes, or macro catalysts. These firms accept impermanence as part of their process.
⚪ They don’t seek universal truths
They look for temporary edges and exploit them until the opportunity is gone.
⚪ Risk is tightly controlled
Algorithms are judged by hard data: drawdown, volatility, Sharpe ratio. The moment a strategy fails to meet these metrics, it’s shut off — just like any risk engine would do.
⚪ They don’t fix broken models — they replace them
Time spent “tweaking” is time lost. New strategies are always in the pipeline, ready to rotate in when older ones fade.
█ Research & Real-World Validation
"Modern quantitative funds must prioritize real-time adaptability and accept that any statistical edge has a short shelf life under competitive market pressures." Adaptive Trading Agents” (Li, 2023)
Donald MacKenzie’s fieldwork on HFT firms found that algos are treated like disposable tools, not long-term investments.
Studies on adaptive algorithmic trading (e.g., Li, 2023; Bertsimas & Lo, 1998) show that funds constantly evaluate, kill, and recycle strategies based on short-term profitability and regime changes.
A former Two Sigma quant publicly shared that they regularly deploy hundreds of small-scale models, and once one fails risk thresholds or decays in Sharpe ratio, it’s immediately deprecated.
Walk-forward optimization — a method used in quant strategy design — is literally built on the principle of testing a strategy in live markets and discarding it if its forward performance drops.
█ Why Retail Rarely Hears This
Retail traders are often taught to:
“Stick with a system”
“Backtest 10 years”
“Master one setup”
But in the real quant world:
There is no perfect system. There are only edges that work until they don’t. And the moment market structure shifts — new volatility, different volume profile, regime change — the strategy is gone, no questions asked.
█ What This Means for Retail Traders
⚪ Don’t idolize “one perfect system.”
What worked in April might not work in June. Treat your strategies as temporary contracts, not lifelong beliefs.
⚪ Build modular logic.
Create systems you can tweak or retire quickly. Test new regimes. Think in frameworks, not fixed ideas.
⚪ Learn from regime shifts.
Volatility, spread, volume profile, macro tone — track these like a quant desk would.
⚪ Use metrics like:
- Win streak breakdown
- Market regime tracker
- Edge decay time (how long your setups last)
█ Final Thought
The best traders — institutional or retail — understand that there’s no such thing as a permanent edge. What matters is:
Having a repeatable process to evaluate strategy performance,
Being willing to shut off or rotate out what’s no longer working,
And staying adaptable, data-driven, and unemotional.
If you start treating your strategies like tools — not identities — you’ll begin operating like a professional.
-----------------
Disclaimer
The content provided in my scripts, indicators, ideas, algorithms, and systems is for educational and informational purposes only. It does not constitute financial advice, investment recommendations, or a solicitation to buy or sell any financial instruments. I will not accept liability for any loss or damage, including without limitation any loss of profit, which may arise directly or indirectly from the use of or reliance on such information.
All investments involve risk, and the past performance of a security, industry, sector, market, financial product, trading strategy, backtest, or individual's trading does not guarantee future results or returns. Investors are fully responsible for any investment decisions they make. Such decisions should be based solely on an evaluation of their financial circumstances, investment objectives, risk tolerance, and liquidity needs.

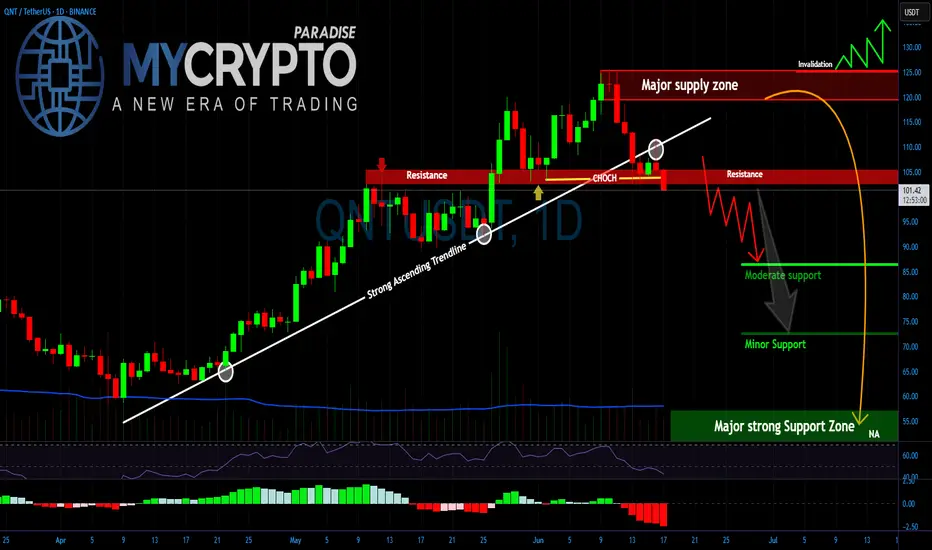
QNT Is Breaking Down — Are You ReadyYello Paradisers, Have you seen what just happened with #QNTUSDT? After weeks of grinding higher, the structure has cracked and that crack could turn into a landslide if you're not ready. This isn’t the time for hope or guesswork. It's the time for strategy.
💎#Quant has broken below a major ascending trendline that’s held since April, marking a pivotal shift in its momentum. The market just printed a clean Change of Character (CHoCH) around the $105–106 level, right at the confluence of a key support-turned-resistance zone. That CHoCH level, once a strong foundation for bullish continuation, has now flipped into a headwind. As long as the price stays below this range, we remain in the danger zone.
💎 Adding fuel to the fire is the major supply zone looming above, from $122 to $128. This area has already triggered rejection in the past and will now serve as the final invalidation for any short-term bullish dreams. A reclaim of this zone is highly unlikely in the near term, given the structure and momentum.
💎Now with the trendline cleanly broken and the market unable to hold higher lows, all eyes are on the lower support zones. The $85 region may provide a temporary cushion, but the real magnet lies deeper. We are closely watching the $72–75 area for signs of temporary relief, but the main high-probability reaccumulation zone is sitting all the way down at $55–60. This zone will likely attract smart money accumulation if the market gets there, it will not be by accident.
💎 This isn’t the time to be catching falling knives. Unless #QNT can reclaim the broken trendline and push back above the $106–110 range with conviction, the path of least resistance is down. That also means every lower high that prints now is an opportunity for trained eyes.
Stay ready. Stay focused. And always play the long-term game like a pro.
MyCryptoParadise
iFeel the success🌴
Quant (qnt)Qnt usdt analysis
Time frame hourly
Risk rewards ratio >2
First target 114$
We have a resistance area in 98$
If qnt can break this resistance range , it can hit my first target on 114 $ and qnt has no pressure to 135 $
The next strong resistance is on 135 $

Algorithmic vs. Quantitative Trading: Which Path Should You TakeI’ve always wondered why anyone would stick to traditional trading methods when algorithms and mathematical models could do all the heavy lifting.
I started questioning everything:
• Why do so many mentors still swear by discretionary trading when algorithms could handle all the heavy lifting?
• Do they really have solid proof of their “own” success, or is it just talk?
• Or are they keeping things complex and discretionary on purpose, to confuse people and keep them as members longer?
• Why deal with the stress of emotions and decisions when an algorithm can take care of it all?
• Imagine how much further ahead you could be if you stopped wasting time on manual trades and instead focused on market research and developing your own models.
When I first got into trading, I thought Algorithmic Trading and Quantitative Trading were basically the same thing. But as I dug deeper, I realized they’re two completely different worlds.
Algorithmic Trading: It’s simple – you set the rules and the algorithm executes the trades. No more sitting in front of the screen “controlling your emotions” and trying to manage every little detail. Instead, you let the algorithm handle it, based on the rules you’ve set. It frees up your time to focus on other things rather than staring at price charts all day.
But here’s the thing – it’s not perfect. You’ll still need to test the rules to make sure the data and results you’re getting aren’t overfitted or just random.
Quantitative Trading: A whole different level. It’s not just about executing trades; it’s about understanding the data and math behind market movements. You analyze historical price, economic, and political data, using math and machine learning to predict the future. But it can be complex – techniques like Deep Learning can turn it into a serious challenge.
The upside? This is the most reliable way to trade, and it’s exactly what over 80% of hedge funds do. They rely on quant models to minimize risk and to outperform the market.
So, which path should you choose?
Quantitative Trading can feel overwhelming at first, I recommend starting with the basics. Begin with Pine Script coding in TradingView—start building a foundation with simple strategies and indicators. As you grow more confident, start coding your own ideas into rules and refining your approach to eventually automated your trading strategy.
TradingView is a great tool for this, and I’d highly suggest grabbing the Premium plan. This will give you access to more data and features to make your learning journey smoother.
Dive into the Pine Script documentation , and begin bringing your ideas to life.
I promise, the more you focus on this, the better and more independent you’ll become in trading.
Every day, aim to get just 1% better.
To Your success,
Moein

QNTUSDT 1WQNT ~ 1W
#QNT Getting the lowest price is extremely rare.
now is the right time to buy COINBASE:QNTUSD , This is the lowest price so far.

Quant LongDoing a TA on quant over the last few weeks and the baseline price of 113 is the best price to pull a long. TP at 125-135.

China Stock - Uptrend until the end of November for 688395This stock is picked by my app, please search qingxuantang/chinese_stock_picker on Github.
There will be a short-term uptrend that may end by the end of November. The target price may be around 25-25.3.

$BNB LONG. Bossco Algo caught every $BNB bullrun.
BINANCE:BNBUSDT long entry has been in play. Bossco Algo caught every BINANCE:BNBUSDT bullrun.
Pity that TV took down my old post since it referenced an outside URL where entries are called in real time ...
Model Architecture:
• 1,000+ hours of quantitative research.
• 1,000+ machine hours of backtesting & forward testing.
• Based on pure price action, zero bias, zero emotions (see methods tested 👇)
• Long & Short, Execution on 4H timeframe
All methods tested:
Why share?
• It's my model, so I get the model signals first. I'll already be positioned in my longs, so I don't really care if you enter or not. Hedge fund PMs literally have dinners where they talk their own book after positioning.
• Signals are on a high timeframe on liquid assets, so you should be able to get in at the same price. You can't stop hunt me, because I don't post stop losses.
I will never give away the code or the techniques selected . No one gives away proprietary quant models that actually work. Please don't ask.
I don't plan on ever making signal access paid, since I want a public record of proof that the signals are real. I make my money through trading, not scam discords or courses.
Model output is for research purposes only. Not financial advice.

$LINKUSDT LONG. Bossco Algo caught every $LINK bullrun
BINANCE:LINKUSDT long entry has been in play. Bossco Algo caught every BINANCE:LINKUSDT bullrun.
Pity that TV took down my old post since it referenced an outside URL where entries are called in real time ...
Model Architecture:
• 1,000+ hours of quantitative research.
• 1,000+ machine hours of backtesting & forward testing.
• Based on pure price action, zero bias, zero emotions (see methods tested 👇)
• Long & Short, Execution on 4H timeframe
All methods tested:
Why share?
• It's my model, so I get the model signals first. I'll already be positioned in my longs, so I don't really care if you enter or not. Hedge fund PMs literally have dinners where they talk their own book after positioning.
• Signals are on a high timeframe on liquid assets, so you should be able to get in at the same price. You can't stop hunt me, because I don't post stop losses.
I will never give away the code or the techniques selected . No one gives away proprietary quant models that actually work. Please don't ask.
I don't plan on ever making signal access paid, since I want a public record of proof that the signals are real. I make my money through trading, not scam discords or courses.
Model output is for research purposes only. Not financial advice.

$ETH LONG. Bossco Algo caught every $ETH bullrun.
BINANCE:ETHUSDT long entry has been in play. Bossco Algo caught every BINANCE:ETHUSDT bullrun.
Pity that TV took down my old post since it referenced an outside URL where entries are called in real time ...
Model Architecture:
• 1,000+ hours of quantitative research.
• 1,000+ machine hours of backtesting & forward testing.
• Based on pure price action, zero bias, zero emotions (see methods tested 👇)
• Long & Short, Execution on 4H timeframe
All methods tested:
Why share?
• It's my model, so I get the model signals first. I'll already be positioned in my longs, so I don't really care if you enter or not. Hedge fund PMs literally have dinners where they talk their own book after positioning.
• Signals are on a high timeframe on liquid assets, so you should be able to get in at the same price. You can't stop hunt me, because I don't post stop losses.
I will never give away the code or the techniques selected . No one gives away proprietary quant models that actually work. Please don't ask.
I don't plan on ever making signal access paid, since I want a public record of proof that the signals are real. I make my money through trading, not scam discords or courses.
Model output is for research purposes only. Not financial advice.

$DOGE LONG. Bossco Algo captured every $DOGE bullrun.
BINANCE:DOGEUSDT long entry has been in play. Bossco Algo caught every BINANCE:DOGEUSDT bullrun.
Pity that TV took down my old post since it referenced an outside URL where entries are called in real time ...
Model Architecture:
• 1,000+ hours of quantitative research.
• 1,000+ machine hours of backtesting & forward testing.
• Based on pure price action, zero bias, zero emotions (see methods tested 👇)
• Long & Short, Execution on 4H timeframe
All methods tested:
Why share?
• It's my model, so I get the model signals first. I'll already be positioned in my longs, so I don't really care if you enter or not. Hedge fund PMs literally have dinners where they talk their own book after positioning.
• Signals are on a high timeframe on liquid assets, so you should be able to get in at the same price. You can't stop hunt me, because I don't post stop losses.
I will never give away the code or the techniques selected . No one gives away proprietary quant models that actually work. Please don't ask.
I don't plan on ever making signal access paid, since I want a public record of proof that the signals are real. I make my money through trading, not scam discords or courses.
Model output is for research purposes only. Not financial advice.

$SOL LONG in play. Bossco Algo captured every $SOL bullrun.
BINANCE:SOLUSDT long entry has been in play. Bossco Algo caught every BINANCE:SOLUSDT bullrun.
Pity that TV took down my old post since it referenced an outside URL where entries are called in real time ...
Model Architecture:
• 1,000+ hours of quantitative research.
• 1,000+ machine hours of backtesting & forward testing.
• Based on pure price action, zero bias, zero emotions (see methods tested 👇)
• Long & Short, Execution on 4H timeframe
All methods tested:
Why share?
• It's my model, so I get the model signals first. I'll already be positioned in my longs, so I don't really care if you enter or not. Hedge fund PMs literally have dinners where they talk their own book after positioning.
• Signals are on a high timeframe on liquid assets, so you should be able to get in at the same price. You can't stop hunt me, because I don't post stop losses.
I will never give away the code or the techniques selected . No one gives away proprietary quant models that actually work. Please don't ask.
I don't plan on ever making signal access paid, since I want a public record of proof that the signals are real. I make my money through trading, not scam discords or courses.
Model output is for research purposes only. Not financial advice.

China Stock - Uptrend in this week for 688433This stock is picked by my app, please search qingxuantang/chinese_stock_picker on Github.
The uptrend has begun since last week and may continue for another week. The selling date is set to be between 13-15 Nov.

thenexxtrade Alpha portfolio
Annualized Return : 17.9%
Sharpe Ratio : 1.27
Sortino Ratio : 2.67
Max DD : -11.4%
Volatility : 10.5%
In October 2023, we want to update you on our current investment strategy. We've been maintaining an 80% cash position over the past few months, a decision you can verify by visiting our Twitter account.
Our approach involves rebalancing on a monthly basis, steering clear of shorter time frames that often resemble gambling. We're integrating the returns generated by our proprietary system, compounding our gains with the alpha it produces.
Watch this space. We will bark when it time to allocate 100%.
Those who said don't time the market are those without the Alpha.

Understanding the Profitability of Trading.In the trading world, there are various methods to make money. However, in the fundamental approach to trading itself to earn money, we need to know that it has to be when you win bigger and lose smaller. Then, you might think about whether you should focus on winning more often or bigger. This article explores how to assess the profitability of the trading system with a simple formula.
Winning Rate and Risk-Reward Ratio
Two crucial factors affecting a trading signal's profitability are the winning rate and the risk-reward ratio. The winning rate is the percentage of trades that turn a profit.
A high winning rate can mean steady profits, but it doesn't guarantee overall profitability. The risk-reward ratio is the relationship between potential gains and losses in a trade.
A higher risk-reward ratio can lead to bigger profits, but it also demands a higher rate of correctness to stay profitable.
How They Impact Profitability
Let's use a simple example to understand how these factors affect profitability. Imagine a trading signal with a 60% winning rate and a risk-reward ratio of 2:1.
This means for every $1 risked, the potential profit is $2. If applied to 100 trades with a $100 risk per trade, the total risk is $10,000. Winning 60 trades would yield $12,000 in profit while losing 40 would result in a $4,000 loss.
The net profit in this case would be $8,000. This illustrates how the winning rate and risk-reward ratio impact a trading signal's profitability.
Evaluating Signal Effectiveness
To gauge the effectiveness of a trading signal, you need to consider a few factors.
Firstly, backtest the signal using historical data to assess its performance(Minimum 100 trading signals). Ensure the backtesting period covers various market conditions.
Secondly, forward test the signal using real-time data to evaluate its live performance. Finally, assess the signal's consistency and reliability over time(Real-time experience is different from backtesting). Signals that consistently generate profits are more reliable.
Key Aspects for Profitability
When assessing a trading signal's profitability, focus on a high winning rate and a favorable risk-reward ratio. The signal should adhere to sound trading principles, avoiding subjective factors for consistency and reliability.
The formula for Winning Rate and Risk-Reward Ratio
Here are simple formulas to calculate the winning rate and risk-reward ratio:
Winning rate = (Number of winning trades / Total number of trades) x 100
Risk-reward ratio = (Average profit per trade / Average loss per trade)
The higher these values are, the greater the potential for earning money through trading. However, having high values in isolation isn't enough for profitable trading.
Let's delve into a few examples to fully grasp this concept:
Example 1:
Consider Person A , who has a stellar winning rate of 90%, yet a risk-reward ratio of a meager 0.1. Now let's ask, will this individual amass wealth or rack up losses?
With his current risk-reward ratio, when luck favors, Person A walks away with a hefty $1,000. However, when faced with defeat, he incurs a significant loss of $10,000!
Their trading pattern? Win 9 times with a total earnings of $9,000, only to lose a much larger sum of $10,000 later. While this strategy may appear profitable in the short-run, it's unsustainable in the long-run, often resulting in accumulating losses.
Example 2:
Now, let's consider another scenario. Person B , with a winning rate of only 10% but a remarkable risk-reward ratio of 8. The same question arises - will this person amass wealth or rack up losses?
With their risk-reward ratio, when placed in favorable circumstances, Person B earns an impressive $8,000. Conversely, a bad day costs them a $1,000 loss.
Now, their trading pattern may seem paradoxical. They win once, earning a massive $8,000, then lose 9 times in a row for a total loss of $9,000. Despite the high-risk reward ratio, the low winning rate fails to buoy their profits. Ultimately making it a non-profitable strategy.
Determining Profitability
To assess whether you can make money based solely on the winning rate and risk-reward ratio, consider a formula called the required winning rate. It's defined as:
Required Winning Rate = 100 / (Risk-Reward Ratio + 1)
Let's look at two examples:
Person A has a 90% winning rate and a risk-reward ratio of 0.1. The required winning rate is 100 / (0.1 + 1) = 90.91%. Person A needs to maintain a winning rate of 90.91% to break even.
Person B has a 10% winning rate and a risk-reward ratio of 8. The required winning rate is 100 / (8 + 1) = 11.1%. Person B must achieve an 11.1% winning rate to avoid losses.
This formula helps determine the minimum winning rate needed to profit based on a strategy's risk-reward ratio. It emphasizes that both factors are critical for trading success. If the required winning rate isn't met, it may be wise to pause and further study the markets.
Assessing the profitability of a trading signal is essential for successful trading. Consider the winning rate, and risk-reward ratio, evaluate the signal's effectiveness, and emphasize key aspects. Use the required winning rate formula to understand the minimum winning rate needed for profitability. By making informed decisions, traders can improve their chances of consistent profits over time.
Follow and Boost for your financial success !
Write your thoughts in the comment section.

How much should the order amount be in quantitative trading ?First, you need to determine how your strategy calculates the order quantity, which can be based on:
1. Quantity of shares
2. Amount of money
3. Percentage
This article elaborates on the points of using "Fixed Order Amount" .
The amount of margin required for a trade depends on your risk tolerance.
Using "BOT | Trend" as an example,
In the backtested performance, a fixed "initial capital leveraged by 1x" is used as the order amount for each trade,
with a maximum drawdown of 25%, meaning the assets decrease by 25% from the "peak performance point" to the subsequent lowest point (1000 ➡️ 750).
Therefore, there are two key points to note here:
* The amount of margin required should consider “How much risk you can bear? ”
Assuming you currently have 1000 to operate "BOT | Trend," and you can tolerate a maximum loss of 500 (-50%), then the total amount of each trade (margin * leverage) can be set as 2000, and so on.
Example: Now you have 2000, and you can tolerate a maximum loss of 400 (-20%), then the total amount of each trade (margin * leverage) is 1600.
Practice: Now you have 5000, and you can tolerate a maximum loss of 2000 (-40%), then the total amount of each trade (margin * leverage) is ______ (Hint: What is 25% of 2000?).
* Timing to start running quantitative trading.
Running a "trend-following" quantitative trading strategy should not start during a continuous profitable period but rather when the strategy incurs losses (relative low point of equity). This is because for trend strategies, sideways market conditions can cause the strategy to go long at highs and short at lows, resulting in a depletion of funds during this period. Starting during a continuous profitable period is likely to encounter fund depletion right after entering because markets alternate between trending and ranging phases.
Answer: 8000

AUDUSD Selling opportunity Good day, traders. The Australian dollar, which is now in a correction phase, may shortly hit the support and resistance level of 0.680. Right now, the trend is downward. We'll be monitoring AUDUSD during the current trading week and the one after it in case a selling opportunity arises at the 0.680 area.
