Fade 112k, buy 109.5/108k on signals__________________________________________________________________________________
Market Overview
__________________________________________________________________________________
BTC is consolidating mid‑range within 104k–116k after a clean rejection below the weekly pivot high (~112k). Intraday momentum tilts bearish while higher timeframes remain range‑bound.
Momentum: 📉 Bearish within a range — sellers active at 111.95–112.15, defensive bids lower.
Key levels:
• Resistances (HTF/MTF) : 111.95–112.15 (weekly), 113.5–114.0 (MTF), 115.5 (gate before 118k/121k).
• Supports (HTF/MTF) : 110.2–110.5 (MTF), 109.3–109.8 (MTF), 107.9–108.1 (HTF).
Volumes: Overall normal; moderate pickup on 1H retests of range edges.
Multi-timeframe signals: 2H–6H point Down; 12H–1D more neutral; LTF (15–30m) show range rebounds — consistent with selling 112k rejections and tactical buys at 109.3–109.8 / 107.9–108.1.
Risk On / Risk Off Indicator: SELL (mild risk‑off) — aligns with the bearish bias as long as 112k caps price.
__________________________________________________________________________________
Trading Playbook
__________________________________________________________________________________
In a range with MTF selling pressure, favor sell‑the‑rip and defensive buys on absorption. 🎯
Global bias: NEUTRAL SELL below 112k; key invalidation on a strong close >112.5k.
Opportunities:
• Tactical sell : Fade 111.95–112.15 on signal; target 110.5 then 109.6. (Stop >112.5)
• Defensive buy : Bid 109.3–109.8 on wick/absorption; target 111.1 then 111.9. (Stop <109.3)
• Breakout buy : Only above 112.5 on confirmed retest; target 114.0 then 115.5. (Stop ≈112.0)
Risk zones / invalidations:
• A reclaim >112.5 invalidates the sell bias and opens 114k–116k.
• A clean break <109.3 exposes 108.0 then 106.8/104k.
Macro catalysts (Twitter, Perplexity, news):
• Fed: Waller favors a cut vs Kashkari cautious; Beige Book “little change” — dovish tone would favor 112k/114k tests.
• US labor: ADP/claims/ISM Services today — strong surprises can trigger a break of the 110.3–111.3 micro‑range.
• Inflation mix: Oil <$60 (disinflation) but US tariff risks linger — likely keeps us ranging until 114k–116k is reclaimed.
Action plan:
• Short 112k rejection : Entry 111.95–112.15 / Stop 112.6 / TP1 110.5, TP2 109.6, TP3 108.0 → R/R ≈ 2.0–3.0.
• Defensive long 109.5 : Entry 109.3–109.8 / Stop 109.2 / TP1 111.1, TP2 111.9, TP3 112.5 → R/R ≈ 2.0–2.5.
__________________________________________________________________________________
Multi-Timeframe Insights
__________________________________________________________________________________
HTFs are range‑bound while MTFs (2H–6H) drift lower; LTFs attempt technical rebounds.
1D/12H: Range 104k–116k intact; 111.95–112.15 capping; 107.9–108.1 as base — below 112k, risk skew toward 110.5 then 109.5.
6H/4H/2H: Lower highs in place; prefer selling retests 111.3–111.6 and 111.95–112.15 toward 110.5/109.5.
1H/30m/15m: Micro‑range 110.3–111.3; long scalps from 110.3–110.6 with confirmation ; moderate volume pickup on edge retests.
Key divergences/confluences: Mild risk‑off + MTF Down = bearish confluence below 112k; absence of extreme volume tempers squeeze risk until 114k–116k triggers.
__________________________________________________________________________________
Macro & On-Chain Drivers
__________________________________________________________________________________
Macro is dovish‑but‑uncertain while on‑chain points to a digestion range — a setup favoring tactics over trends.
Macro events: Fed split (Waller pro‑cut, Kashkari cautious), Beige Book steady; JOLTS down with ADP/claims/ISM due — directional volatility risk. Oil <$60 and soft Swiss CPI = disinflation, but US tariffs keep inflation risks alive.
Bitcoin analysis: Broke below daily Ichimoku and retested as resistance; hesitation under a double‑top neckline; 30‑day realized vol low = uncertainty without panic. US spot ETF net inflows +$300.5M (Sept 3) with muted price response.
On-chain data: Accumulation 108k–116k (URPD) and lost high cost‑basis → 104.1k–114.3k corridor; STH ~60% in profit = fragile; neutral funding and slowing ETF intake = capped momentum.
Expected impact: While 112k isn’t reclaimed with volume, bias stays NEUTRAL SELL ; above 114k–116k, risk‑on resumes.
__________________________________________________________________________________
Key Takeaways
__________________________________________________________________________________
A controlled range persists with an active 112k ceiling and selective dip‑bidding lower.
- Overall trend: 📉 tactical bearish within a HTF range.
- Top setup: Fade 111.95–112.15 with invalidation >112.5 and targets 110.5/109.6/108.0.
- Macro key: Fed‑lean dovish but labor/ISM data could swing momentum toward 112k or down to 109.5.
Stay disciplined: trade the range, protect stops, and let closes above 112.5 and 114–116k speak. 🧭
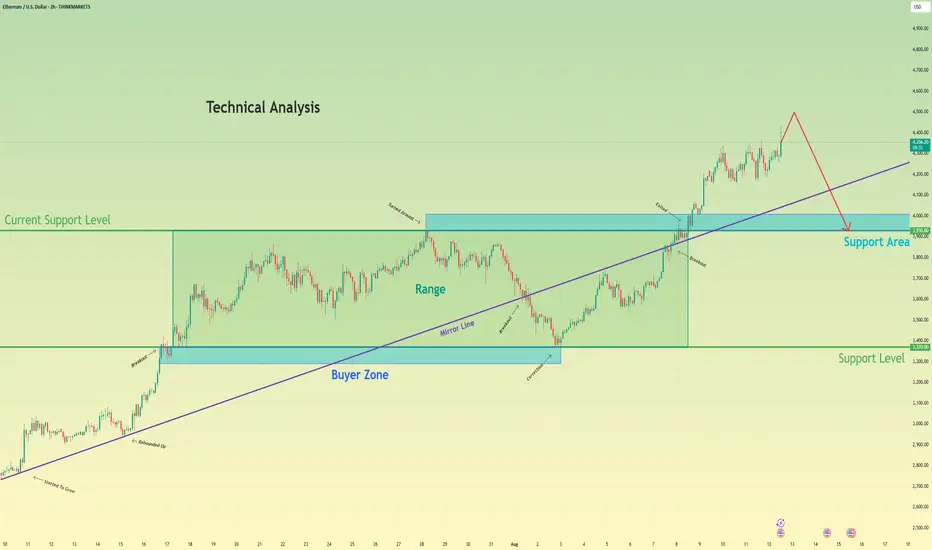
Range

Ethereum 4H Range As we approach nearly a month in the range from $4000-4800 it looks like ETH is making a move once again.
Previously once hitting $4800 price gradually sold off back towards range low creating a bearish trendline, once the price broken above that level a rapid move up to range high within two candles.
Now looking at the chart we have a similar setup, strong breakout from the bearish trendline up into midpoint. Bitcoin currently retesting a key level of $112,000, should BTC flip this level I could see alts getting the greenlight to move up and Ethereum up to the highs.
Should BTC reject from $112,000 it makes sense that ETH range midpoint would be strong resistance, rejection could lead to a range low retest. Anything else that isn't either range high, range low or midpoint is noise and for me no action required, no need to over complicate it.

EURUSD: Price Exit from Pennant and DropHello everyone, here is my breakdown of the current Euro setup.
Market Analysis
From a broader perspective, the price has been consolidating in a wide range between the 1.1600 support level and the 1.1720 resistance level. This extended period of balance has now tightened, leading to the current, more compressed pattern where a significant move is becoming more likely.
Currently, the price action is coiling within a pennant pattern. This compression of volatility suggests that energy is building for a breakout. The price is now trading very close to the apex of this pennant, testing the upper boundary near the major horizontal Resistance Zone.
My Scenario & Strategy
While a breakout from a pennant might seem likely, the overhead resistance at the 1.1720 level is historically significant. I'm watching for a situation where the market fakes a move to the upside to trap optimistic buyers before revealing its true intention.
Specifically, I'm watching for a brief dip, followed by a rally that pushes the price just above the pennant's resistance line and into the 1.1720 - 1.1730 resistance area. The key signal would be a swift and forceful rejection from this area, pushing the price back below the breakout point. And the primary target for the resulting decline is the 1.1600 level, which aligns with the major horizontal support zone.
That's the setup I'm tracking. Thank you for your attention, and always manage your risk.

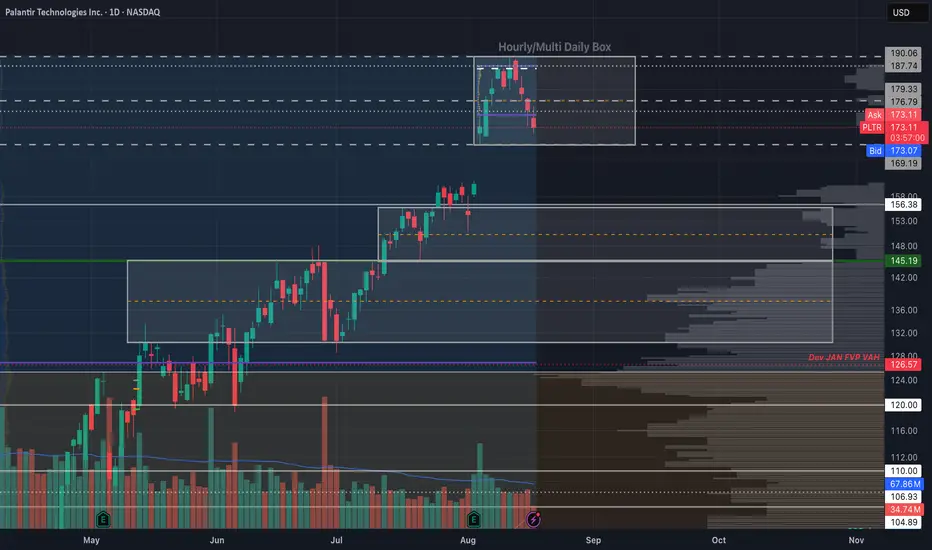
Palantir - The Box Calls The ShotsI recently posted a palatir chart with clean levels of where I'd look to DCA. While those dip-buy levels can easily be used to trade the name, I think it would also help to be mindful of the box ranges as we trade into them. As you'll see, Palantir loves to play with box as much as I do.
If you are familiar with how to trade box set-ups, you can take advantage immediately; otherwise, you may want to do some research on how to trade these.
~The Villain
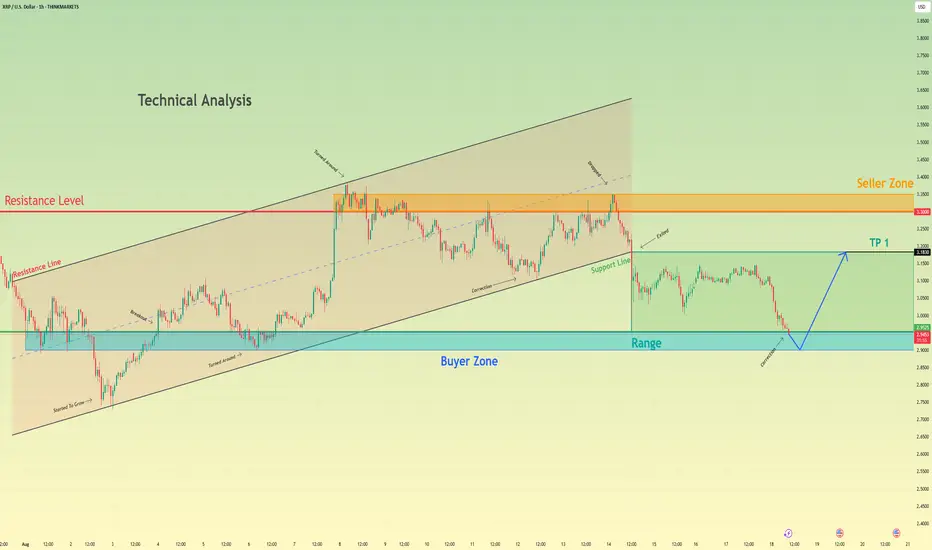
Ripple may bounce up from buyer zone to top part of rangeHello traders, I want share with you my opinion about Ripple. The market for Ripple has undergone a significant structural shift, with the prior upward channel giving way to a new phase of horizontal consolidation following a decisive breakdown. This event signaled a pause in the strong bullish momentum and established a new trading range, with the major buyer zone around the 2.9525 support level now acting as the foundational floor for the price. After the initial drop, the price has been trading within this new, more contained range, undergoing a series of corrective movements. Currently, the asset is in another downward leg, heading towards the critical buyer zone for what could be a decisive test of this support. The primary working hypothesis is a long scenario, based on the expectation that demand will overcome supply within this 2.9525 - 2.9000 area. A confirmed and strong rebound from this key support would indicate that the corrective phase is over and that buyers are ready to initiate a new rotation to the upside. Therefore, the TP for this range-based play is logically set at the 3.1830 level. This target corresponds with the top of the current consolidation range and represents the most probable objective for a bullish swing originating from the established support base. Please share this idea with your friends and click Boost 🚀
Disclaimer: As part of ThinkMarkets’ Influencer Program, I am sponsored to share and publish their charts in my analysis.
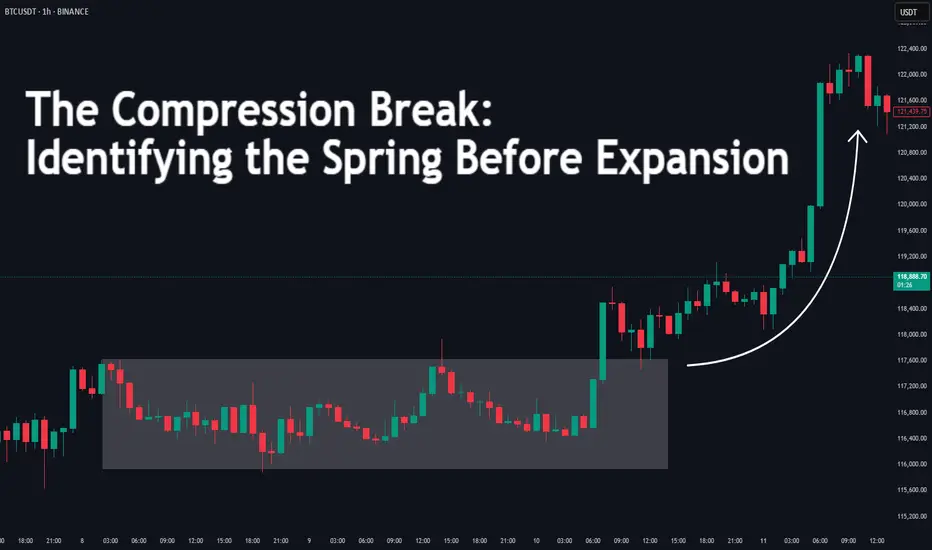
The Compression Break: Identifying the Spring Before ExpansionDifficulty: 🐳🐳🐳🐋 (Intermediate)
This article is for traders who want to recognize and trade explosive moves that form after periods of tight price compression. Perfect for those familiar with structure, volume, and volatility concepts.
🔵 INTRODUCTION
Price doesn’t move in a straight line — it breathes. It expands when there’s imbalance, and it compresses when the market is building energy. The most powerful moves often start with a compression phase — a tight, controlled price range — before a sudden breakout.
Learning to spot these “springs” before they snap can give you trades with excellent risk/reward ratios and clear invalidation points.
🔵 WHAT IS COMPRESSION?
Compression occurs when price volatility shrinks, and each swing becomes smaller than the last. It looks like price is being “squeezed” between converging support and resistance levels.
Common causes of compression:
Liquidity build-up before a major session open
Market waiting for a news release or key event
Institutional positioning before a drive
The tighter the range, the bigger the potential release.
🔵 WHY IT MATTERS
Compression is important because:
It reveals where the market is balanced and undecided
It creates a high-energy environment — a small push can trigger big moves
It offers tight stop-loss placement and clear breakout targets
Think of it like a coiled spring: the more it’s compressed, the more explosive the release.
🔵 HOW TO IDENTIFY COMPRESSION
1️⃣ Price Action Clues
Consecutive smaller candles with overlapping ranges
Lower highs + higher lows (triangle formation)
Reduced wick size in the final stages before breakout
2️⃣ Volume Clues
Declining volume during the squeeze
Sudden volume spike as breakout begins
3️⃣ Volatility Clues
ATR (Average True Range) dropping to local lows
Bollinger Bands narrowing (optional)
🔵 TRADING THE COMPRESSION BREAK
Step 1: Define the Box
Mark the high and low of the compression range. This will be your breakout reference.
Step 2: Wait for Volume Confirmation
Avoid jumping in on the first tick outside the box. Wait for a volume surge or strong close beyond the boundary.
Step 3: Trade in the Breakout Direction
Entry: After confirmed breakout close
Stop Loss: Inside the compression range
Target: Equal to the height of the compression box or previous swing high/low
🔵 EXAMPLE SCENARIO
Price compresses for more then 10 bars into a tight range
Volume steadily declines → ATR hits a local low
A big body bullish candle breaks above range high with 2× average volume
Entry at breakout close, stop inside range, target = box height projected upward or 1:2 RR
🔵 ADVANCED TIPS
Align with higher timeframe trend for higher probability
Watch for false breakouts (liquidity sweeps) before real move
Combine with order blocks or VWAP to refine entries
Use session timing — many compression breaks happen at market opens
🔵 CONCLUSION
Compression is the market’s way of loading a trade with potential energy. When you spot it, you’re seeing the buildup before the burst. Trade it with patience, volume confirmation, and proper structure, and it can become one of your highest-probability setups.
Have you traded compression breaks before? Share your best example in the comments!
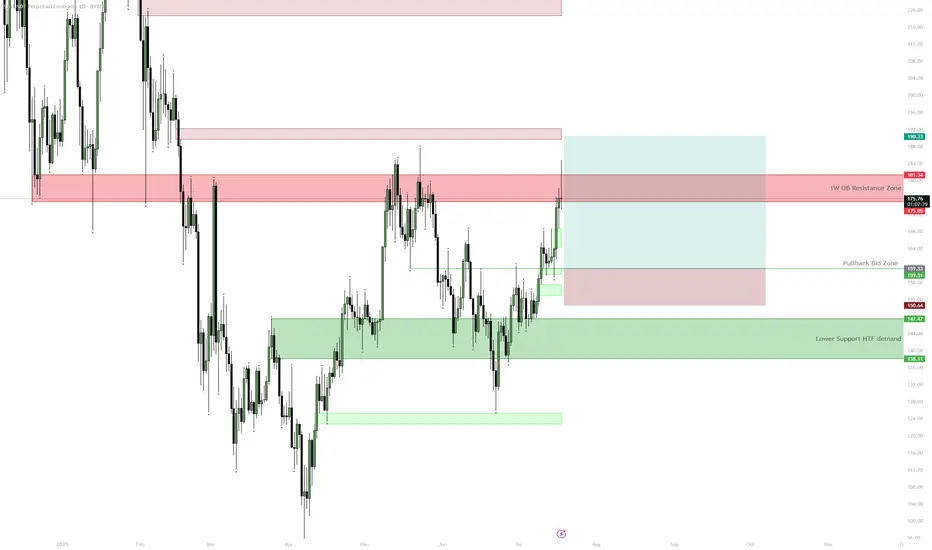
SOL — $180 HTF Resistance | Consolidation ExpectedSOL is approaching a key HTF resistance zone at $175–$181 with 1D RSI close to overbought. Unless price cleanly breaks above this area, a pullback to $160 or even the $138–$147 demand zone is likely before further upside. The setup provides a better risk/reward for longs on pullbacks after consolidation rather than chasing at resistance.
CPOOLUSDT Daily Chart Analysis | Momentum Surge & Key TargetsCPOOLUSDT Daily Chart Analysis | Momentum Surge & Key Targets
🔍 Let’s dive into the CPOOL/USDT 1D chart and break down the latest price action that’s catching attention, with an eye on bullish setups and critical zones.
⏳ Daily Overview
The chart shows a dynamic breakout above the accumulation box (range), with price riding a clear yellow trendline and volume spiking hard — classic momentum signals. RSI is entering the overbought zone, which confirms surging buying interest and the possibility for rapid moves.
🔺 Long Setup:
- The breakout from the range box suggests accumulation and fresh interest. Immediate upside looks at the mid-range target of $0.26010.
- Next, if momentum holds, price could rally towards $0.34350, which lines up with the risk-reward (RR1) from the box.
- Sustained momentum and continued volume spikes could unlock even higher targets beyond these levels.
📊 Key Highlights:
- Yellow trendline supports the move, tracking bullish sentiment.
- Volume spikes show real participation — this isn’t a low-liquidity fakeout.
- RSI entering the overbought zone is a momentum engine, but keep an eye out for possible pullbacks or cooling periods as price tests higher levels.
- Fake breakout earlier in the range now confirmed by the strong candle and volume surge.
🚨 Conclusion:
Momentum is accelerating. If buyers stay in control above current support, price could climb to the mid-box target of $0.26010, with $0.34350 as the next bullish destination. This setup favors longs as long as volume and trendline support remain intact. Aggressive momentum could push price even further — time to watch those critical resistance levels.

10yr yield rangesSupport Zones (Bounce Potential):
First Support: Around 4.16% (the lower boundary of the channel and the 0.786 Fib level). If yields drop toward here, watch for a reaction or bounce.
Major Support: Near 3.96% (1.618 Fibonacci extension)—historically, such extensions offer strong bounce candidates if tested.
Resistance Zones (pullback potential):
Immediate Resistance: 4.42%–4.45% (upper channel and multiple EMA clusters). This is the first hurdle for upward moves.
Previous Top Target: Yields could rally toward 5.20% if resistance zones are cleared (marked by the big, bold orange arrow). That’s the previous cycle high where sellers may reappear.
Price Structure: The moving averages are tightly grouped, suggesting indecision. A breakout from this cluster—especially upward—could spark momentum toward 5%.
Channel Guide: The descending channel (yellow lines) acts like a garden fence; a move above the top suggests a break in trend and potential for a run higher.
Fibonacci Extensions: Not just mystical numbers! They help map out calculated support and resistance. See chart's blue/red lines for reference levels—each marks a potential turning point.
Bullish Scenarios: Two orange arrows show possible rally paths, indicating upward bias if supports hold.

Ethereum will rise a little and then drop to support levelHello traders, I want share with you my opinion about Ethereum. Following a sustained upward trend, Ethereum entered a prolonged consolidation phase, forming a wide range between the buyer zone near 3370 and local resistance. Throughout this period, a key ascending mirror line provided consistent support, underpinning the bullish market structure and allowing for accumulation before the next major move. Recently, a decisive breakout from the top of this range occurred, propelling the asset to a new local extremum and confirming the strength of the buyers. However, the price action following this breakout has shown signs of potential exhaustion, with momentum appearing to wane at these elevated levels. The primary working hypothesis is a short, corrective scenario, which anticipates that after a potential final push to a new high, the price will undergo a sharp reversal. A key component of this thesis is the expected break of the main ascending mirror line, an event that would signal a significant shift in short-term market dynamics and confirm that sellers are taking control. Therefore, the tp for this anticipated downward move is logically placed at the 3930 level. Please share this idea with your friends and click Boost 🚀
Disclaimer: As part of ThinkMarkets’ Influencer Program, I am sponsored to share and publish their charts in my analysis.
BTC Broke the downtrendCRYPTOCAP:BTC has broken a descending trendline and is pushing toward the mid-range resistance at 119,500. Above that sits a liquidity pocket at 121,000, with the range high at 123,250.
Momentum signals on higher timeframes remain bullish, with accumulation patterns in place, but lower timeframes show bearish RSI divergences, suggesting the potential for a pullback before continuation.
Bullish scenario:
Hold above 117,000 – 117,454 (4H Bull FVG) keeps bullish momentum intact.
Break and close above 119,500 sets up a liquidity sweep at 121,000.
If momentum sustains, an extension toward 123,250 (Range High) becomes possible.
Bearish / Invalidation scenario:
Rejection from 119,500 followed by a break below 117,000 could pull price back toward 115,750 (Range Low).
Loss of 115,750 exposes deeper retrace into 1W Bull FVG 110,655 – 115,900.
Trading plan:
Watch for breakout + retest of 119,500 to target 121k.
Take partial profits into 121,000; leave runner toward 123,250.
Protect downside if price loses 117,000.

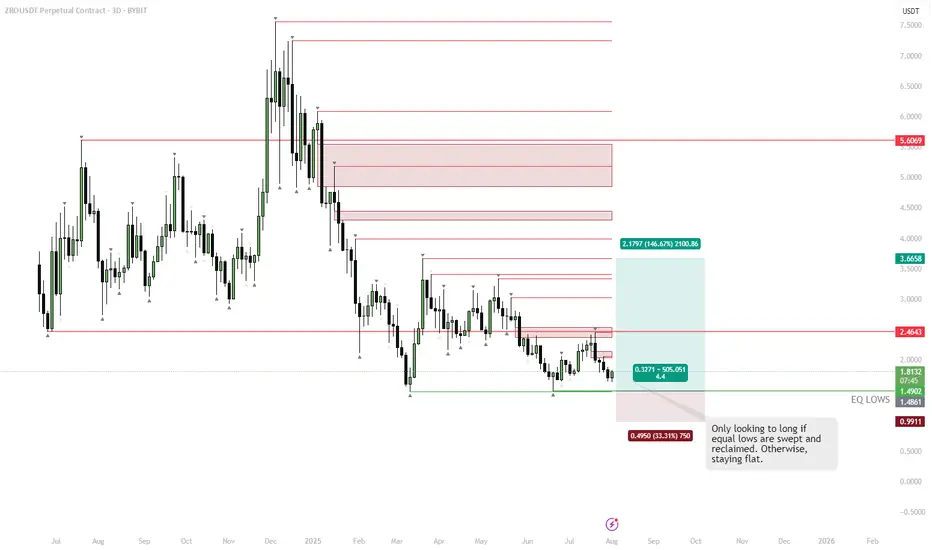
ZRO – Best SetupPrice is consolidating near key equal lows around $1.48–1.50. Liquidity likely sits below these lows, making a sweep into that zone attractive for larger players. Chasing longs here is risky without confirmation.
Plan:
• Wait for a clean sweep below the equal lows
• Look for a strong reclaim of the range back above $1.50 (failed breakdown)
• Entry trigger is confirmation of buyers stepping in after the sweep
If these conditions are met, targeting $2.46 and higher makes sense. No sweep/reclaim = no trade.
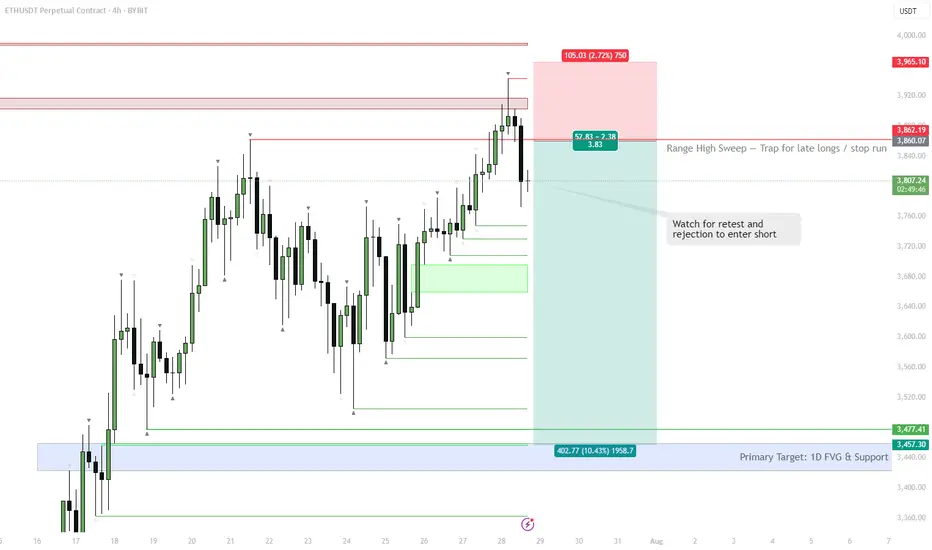
ETH | #4h #short — Range High Sweep & Short SetupScenario:
ETH swept the range high at $3,860, trapping late buyers and triggering stops. Watching for a retest of this level — if it holds as resistance and we see rejection, that’s a short trigger.
Target:
Main target is the 1D FVG at $3,457–$3,477. Possible extension: sweep of range low if selling accelerates.
Why:
Failed breakout setups are classic mean reversion triggers, especially when supported by a visible liquidity pool (FVG) below.
Plan:
Wait for a retest and rejection to confirm short. Partial TP at the FVG zone, manage risk above the sweep high.
SUI | Spot Buy Zone for PullbackPrice has pulled back after a local top and is heading toward a clear demand zone.
Key buy area sits around $3.12, aligned with 0.618 retracement and recent consolidation.
Strong structure below—if majors keep retracing, this is where risk/reward for new spot buys becomes attractive.
Plan:
Waiting for price to reach the green zone to accumulate spot.
Invalidation below $2.80, targeting a move back toward $4.45 and higher if momentum returns.

BTC | Short Bias — Targeting $113kPrice rejected perfectly off the 0.5 retracement and is now filling the previous imbalance.
Yesterday's daily close was decisively bearish, confirming downside momentum.
There’s a lack of convincing reversal signals at current levels.
Plan:
Main expectation is continued downside toward the $113k support.
Not interested in longs until price stabilizes at or below that level.

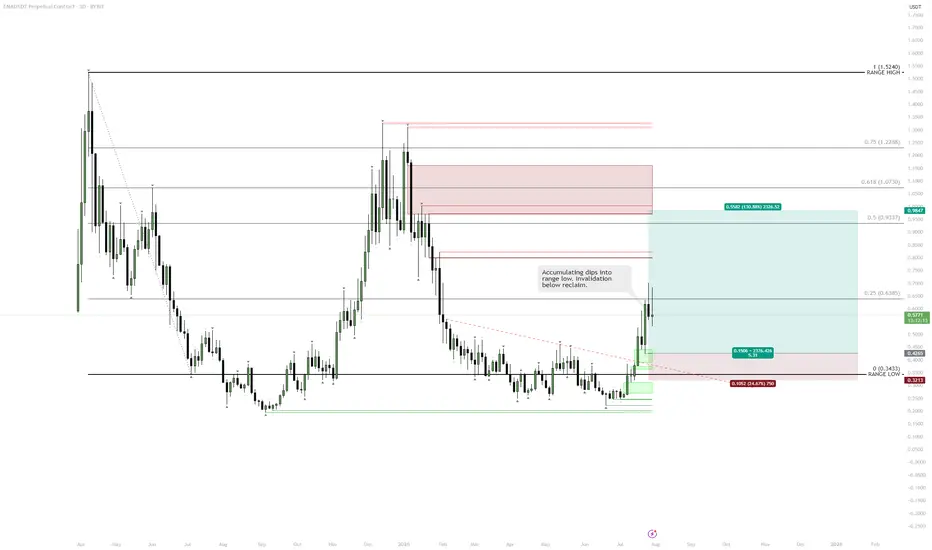
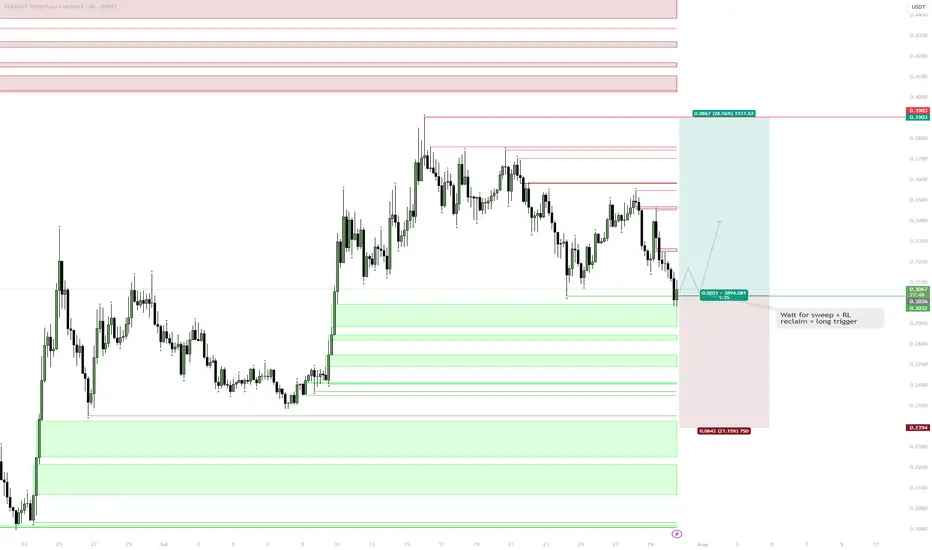
ENA | Range Low Reclaim — Targeting Midrange and AboveClear reclaim of the range low and a strong daily close confirm a bullish market structure shift.
Printing a higher high signals potential for continuation.
Dips toward the reclaimed range low are healthy, providing buy-the-dip opportunities.
Accumulation at the range low with invalidation below keeps risk tight.
Plan:
Accumulate pullbacks toward the range low.
Hold for midrange ($0.83) and upper range/major resistance.
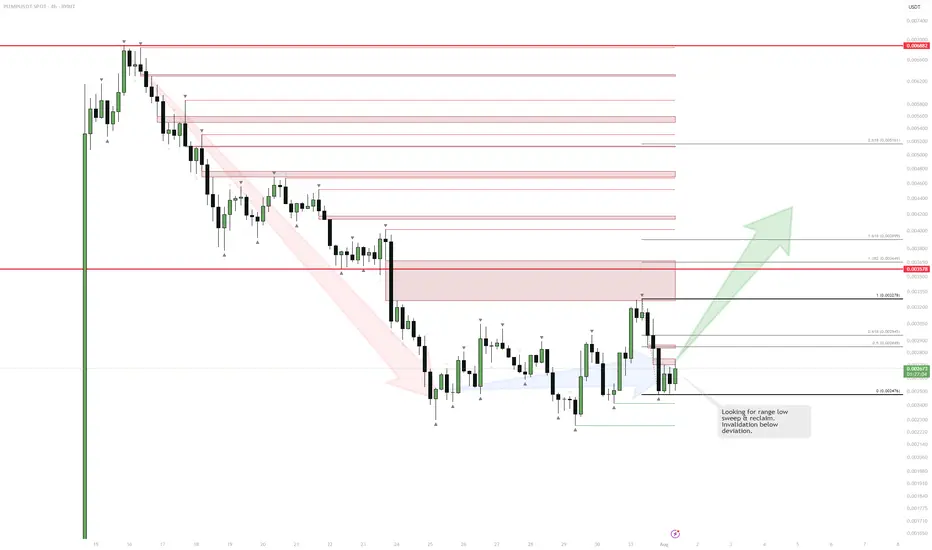
PUMP | Watching for Base ConfirmationThe sharp downtrend is showing signs of exhaustion as price starts to consolidate and build a potential range.
If we see a sweep and reclaim of the range low, that would confirm the start of a new accumulation phase and signal a potential reversal.
The invalidation for any long attempt is a confirmed breakdown below the deviation or the origin of the reclaim.
Plan:
Wait for a clean sweep and reclaim of the range low to trigger a long entry.
Target resistance levels above, with stops set below the reclaim origin.
Bitcoin Facing Macro Volatility: Key Supports Hold Firm__________________________________________________________________________________
Technical Overview – Summary Points
__________________________________________________________________________________
Momentum: Dominant bullish bias on higher timeframes (1D to 2H).
Key Supports/Resistances: Key pivot zone at 114.7K–115.8K defended across all timeframes; major resistances at 119.7K, upside extension to 122.3K.
Volume: Peaks on breakout, normal to high volumes depending on TF, no signs of seller capitulation.
Behavioral Indicators: Risk On / Risk Off Indicator remains strong on all strategic TFs; ISPD DIV neutral except for a defensive buy signal on 1H.
Multi-timeframe summary: Broad horizontal consolidation, no panic or euphoria detected. Major supports overlap, confirming structural strength amid macro volatility.
__________________________________________________________________________________
Strategic Summary
__________________________________________________________________________________
Overall bias: Bullish above 114.7K; neutral/slightly bearish below this key level.
Opportunities: Longs via scalping/range trading on reactions at 114.7–115.8K; swing accumulation on daily/4H stabilization above 115K.
Risk: Break below <114.7K, macro volatility around NFP/PMI, false breakouts.
Macro catalysts: Expanded US tariffs (Trump), NFP, PMI, Fed status.
Action plan: Reactivity on pivots, reduce exposure during macro events, hard stops <114.5K H4.
__________________________________________________________________________________
Multi-Timeframe Analysis
__________________________________________________________________________________
1D: Working the 114723 pivot support. Bullish momentum, no excessive selling, Risk On / Risk Off Indicator “STRONG BUY”.
12H-6H: Building a bottom on the daily base; sustained volumes during sell-off, no panic, technical buy signals emerging.
4H-1H: Vigorous support defense, 1H ISPD DIV “buy” signal. Healthy range pattern; volumes up during rebound attempts.
30min-15min: Slow recovery after high-volume drop, no euphoria or capitulation. No “trap” or imminent squeeze, favorable for tactical trades.
Risk On / Risk Off Indicator: Higher TFs (1W/1D/12H/4H) show strong bullish signals, boosting risk confidence. Decorrelation with lower TFs allows flexible management, controlled accumulation, tight stops at 114.7K.
__________________________________________________________________________________
Macro & BTC Context Summary (Twitter)
__________________________________________________________________________________
Macro: US tariff shock, max volatility likely, amplified moves in equities and crypto.
Bitcoin: Sharp correction post-record close, but solid supports remain, no sign of trend end.
Integration: Technical status quo; favor defensive accumulation, caution on NFP/PMI.
__________________________________________________________________________________
Actionable Synthesis: Plan & Risk Management
__________________________________________________________________________________
Strategies: Longs/scalp >114.7K; swing/accumulate post daily/4H confirmation; partial TPs near 119.7K/122.3K.
Risk Zones: Hard stop <114.5K. Tight monitoring around NFP for volatility spikes.
Reward: Risk-to-reward >2 if buying lower range with strict stops.
__________________________________________________________________________________
Key Macro Events to Watch
__________________________________________________________________________________
2025-08-01: US NFP, unemployment, hourly wages – High volatility expected, possible swings
2025-08-01: ISM Manufacturing PMI – Short-term trend confirmation or invalidation
2025-07-30: FED conference – Range-bound / Moderate volatility
US Tariffs (Trump) – Global risk-off, caution BTC & tech
__________________________________________________________________________________
Conclusion
__________________________________________________________________________________
BTC consolidates steadily between 114.7K–122.3K despite macro shocks
Daily/H4 supports robust, Risk On / Risk Off Indicator strong on higher TFs
Accumulation/scalping favored as long as supports defended
Main risk = break of 114.7K, imminent macro volatility
SEI | Setup: Sweep & Reclaim Scenario:Wait for a sweep of the range low (RL) into the Daily FVG (gray box).
Look for a reclaim of RL as the trigger for a long.
Reasoning:
Sweep into FVG traps late sellers and sets up liquidity for a reversal.
Reclaiming RL after the sweep signals strength and confirms a local bottom.
No need to chase entries—best R:R is after liquidity is cleared and level is retaken.
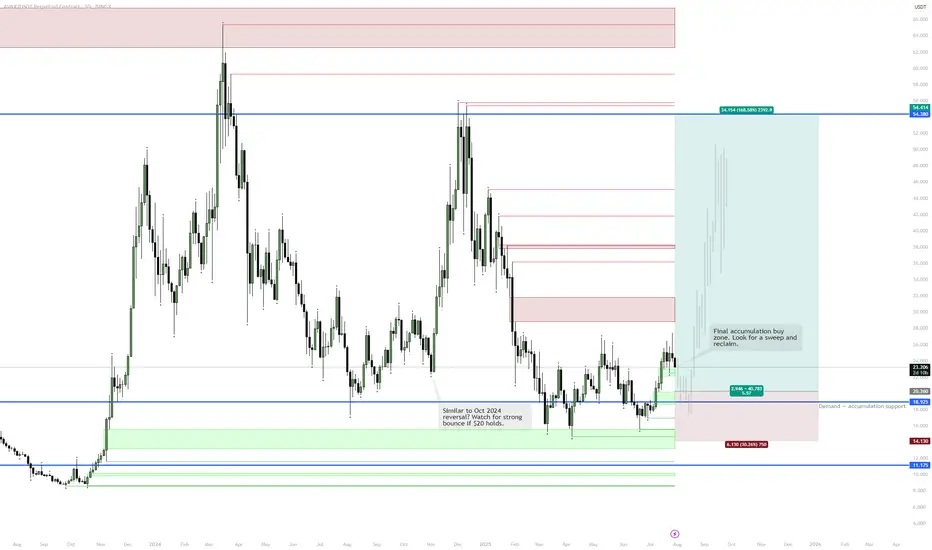
AVAX | Final Accumulation & Potential ReversalContext:
Price is in a major accumulation range, showing similarities to the October 2024 setup.
Green zones indicate strong demand/support; blue is key structural support.
Step-by-Step Scenario:
Accumulation Phase:
Price is consolidating above the $20 level, with repeated defenses of the support zone.
Spot Buys:
Orders set in the $19–$20 area to capture a potential “final shakeout.”
Spring/Reversal:
If price sweeps below $20 and quickly reclaims the level, this signals the final flush before reversal — mirroring the October 2024 bottom structure.
Upside Target:
First major resistance at $38, but the big objective is the $54–55 range, marking previous macro highs and supply.
Invalidation:
A sustained close below $14.1 would break the accumulation structure and invalidate the bullish scenario.
GBPAUD - Trading The Range - AGAIN!Hello TradingView Family / Fellow Traders. This is Richard, also known as theSignalyst.
📈GBPAUD has been hovering within a big range.
Last week, as per our previous analysis, GBPAUD rejected the upper bound of the range and traded lower.
This week, GA is retesting the lower bound of the range acting as a support.
As long as the support holds, we will be looking for longs on lower timeframes, targeting the upper bound of the range.
📚 Always follow your trading plan regarding entry, risk management, and trade management.
Good luck!
All Strategies Are Good; If Managed Properly!
~Rich
Disclosure: I am part of Trade Nation's Influencer program and receive a monthly fee for using their TradingView charts in my analysis.

ETH — Perfect Long Play: Pullback & 1W Breaker Reclaim
After the strong move, price is likely to retrace as longs get trapped and late buyers take profit.
Best scenario: ETH pulls back to the 1W breaker zone ($3,141–$3,456), which previously acted as resistance and could now flip into support.
Watch for bullish reaction and confirmation in the 1W breaker zone.
If support holds, enter long — targeting a return to the range high and then the liquidity zone ($4,108+).
Invalidation if ETH closes below the 1W breaker or loses range low ($2,876) support.
ETH has rallied hard. After such a move, it’s normal for price to pull back and test old resistance as new support. The ideal long is on confirmation of a bounce from the 1W breaker zone, which keeps risk controlled and sets up for a continuation move higher. This approach avoids FOMO and protects against reversal if the breakout fails.

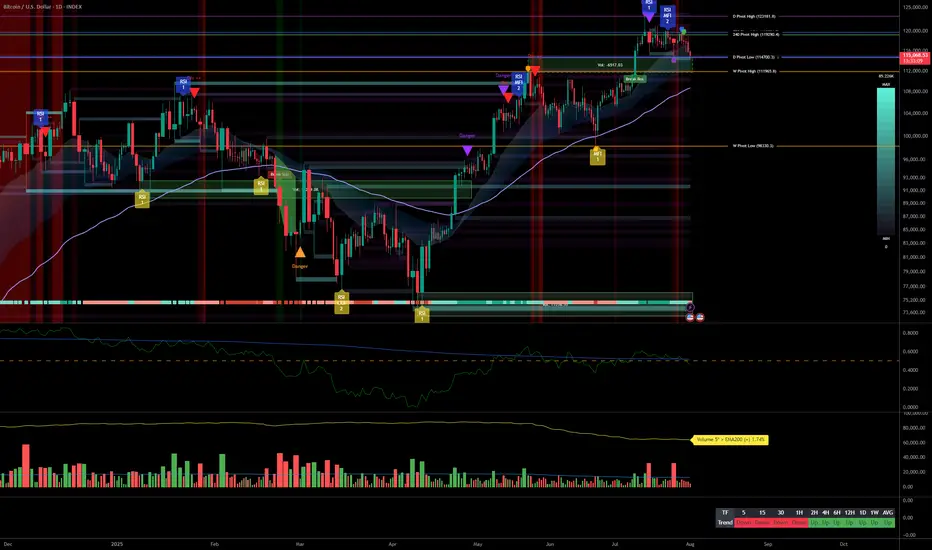
BTC Dominance — Bounces, Chop, and Next Wave Setup
BTC.D reached strong support, confirming euphoria top for now.
Currently, BTC.D is at the first key support (green zone 59.8–61.1%). This is a logical bounce zone where dominance could chop or rebound short-term.
If BTC.D holds and bounces here, expect more range-bound action, potentially retesting 64–65% (red zone).
If this support breaks, the next area of interest is the 54–55% green box. This would open the door for more sustained altcoin strength (altseason continuation).
Ultimately, a decisive break below both green boxes signals the start of a major altcoin expansion phase, with BTC.D trending lower toward 48–50% support.
BTC Dominance (BTC.D) is at a critical inflection point after rejecting at strong resistance and reaching daily support. Bounces from this area are typical as traders rotate profits, but sustained breakdown below support would mark a shift in market regime, favoring alts. Watching for confirmation — the next parabolic move in alts begins if BTC.D loses these green boxes.
