GOLD Strong Bullish Bias! Buy!
Hello,Traders!
GOLD is trading in a strong uptrend and the players are now accumulating volume in a range structure, so we are waiting for a breakout which will be a sign of a further bullish continuation. Time Frame 12H.
Buy!
Comment and subscribe to help us grow!
Check out other forecasts below too!
Disclosure: I am part of Trade Nation's Influencer program and receive a monthly fee for using their TradingView charts in my analysis.
Range

EURUSD Short: Correction Deepens — Market Targets at 1.1590Hello, traders! The current EURUSD price action shows a well-structured reaction between the Supply and Demand zones, with price respecting key levels and channel formations. Earlier, the market traded inside a Range phase, signaling indecision before breaking the range to the upside and forming a clean bullish leg. However, this upward move was capped by the major Supply Zone near 1.16800, where sellers stepped in and pushed price lower. After the rejection from supply, EURUSD broke below the ascending channel, confirming a shift in short-term momentum. The pair then retested the mid-structure area, where another breakout occurred, indicating sustained bearish pressure. With each channel break, sellers strengthened their control, creating a series of lower highs within a corrective structure.
Currently, EURUSD is trading below the most recent ascending channel, aiming toward the 1.15900 Demand Zone, which remains the key area where buyers previously generated strong bullish impulses. This level aligns with the next major liquidity pool and stands as the primary downside target.
My scenario as long as price stays below 1.16800 supply and continues respecting the bearish breakout structure, the expectation is for the market to move lower toward 1.15900 Demand. A clear reaction from demand could initiate a bullish corrective move, but without a confirmed breakout above supply, any upside remains limited. A firm break below 1.15900 would invalidate potential reversal scenarios and open the path for deeper downside continuation. Manage your risk!

BTCUSDT Long: Demand Line Holds — Path Toward 96,500 Opens UpHello, traders! BTCUSDT is respecting the Triangle Demand Line after completing a full bearish cycle inside the descending channel earlier. Sellers maintained control for an extended period, pushing price steadily lower until it reached the pivot point near 88,800, where buyers finally stepped in and broke the bearish structure. This pivot zone became the foundation for a new bullish sequence, with price forming higher lows along the Triangle Demand Line. After the breakout from the descending channel, BTCUSDT entered a consolidation Range, where multiple fake breakouts occurred on both sides. This range acted as a transition phase before buyers regained momentum. Following the range, price made another bullish attempt, but faced resistance near the 96,500 Supply Zone — an area where sellers have shown strong activity in the past.
Currently, BTCUSDT is moving toward the Triangle Demand Line once again, retesting it as support. As long as buyers defend this trendline and price remains above the Demand Zone at 88,800, the bullish structure stays intact.
My scenario: if the trendline holds, BTCUSDT may bounce and continue moving toward the 96,500 resistance, which remains the main upside target for the current bullish leg. A clean breakout above 96,500 would open the path for stronger continuation. However, if price fails to hold the demand line, a corrective pullback toward the lower demand region becomes possible. For now, the market structure remains bullish while price respects the Triangle Demand Line. Manage your risk!

BTCUSD Buyers Defend Support — Market Targets $91,5K — $93K ZoneHello traders! Here’s my technical outlook on BTC/USD based on the current market structure. After a strong bullish recovery from the lower demand area near $83,500–$85,000, the price formed a steady impulsive move upward and entered a consolidation phase inside the marked range below the key $93,000 resistance level. Multiple breakout attempts from the range were followed by corrective pullbacks, showing active participation from both buyers and sellers. Once BTC broke above the range, the price initiated another bullish leg but quickly transitioned into a symmetrical triangle structure, defined by the descending Triangle Resistance Line and the rising Triangle Support Line. Currently, BTC is compressing inside this triangle while holding above the critical $89,500 Support Level, which is acting as the main short-term demand zone. Buyers continue to defend this area, keeping the bullish bias technically valid. The price is now approaching the upper triangle resistance again, hinting at a possible volatility expansion. As long as BTC remains above $89,500, the bullish scenario stays in play. I expect a breakout from the triangle toward TP1 at $91,500, followed by a potential continuation toward TP2 at $93,000, which is the major resistance zone. However, a breakdown below the triangle support would invalidate the setup and may trigger a deeper corrective move. For now, the market remains in a compression phase, preparing for its next directional impulse. Please share this idea with your friends and click Boost 🚀

EURUSD Rising Channel Intact as Price Targets 1.16800 ResistanceHello traders! Here’s my technical outlook on EUR/USD based on the current market structure. After an earlier breakout from the lower consolidation area, the price entered a steady ascending channel, forming a sequence of higher highs and higher lows while respecting the rising Support Line. The previous bullish impulse was followed by a corrective phase, where EURUSD consolidated inside the marked range, allowing the market to release pressure before continuing higher. After the range breakout, the pair resumed its upward movement and is now trading inside a new rising price channel. At the moment, price is holding above the 1.16400 support level, which is acting as a key demand area and the lower boundary of the current ascending structure. Buyers continue to defend this zone, keeping the short-term bullish bias intact. The market is now pressing toward the major 1.16800 resistance level, which aligns with the upper channel boundary and serves as the next critical obstacle for the bulls. As long as EURUSD remains above the 1.16400 support, the bullish scenario stays valid. I expect a continuation toward the TP1 target at 1.16800, where strong seller reaction is likely. A clean breakout above this resistance could open the door for further upside continuation. However, a failure to hold the current support may lead to a deeper pullback toward the lower channel area. For now, the structure favors buyers, with resistance at 1.16800–1.17000 as the main upside objective. Please share this idea with your friends and click Boost 🚀

EURUSD Short: Supply Holds — Pullback to 1.1610 in FocusHello, traders! The price action on EURUSD is unfolding within a well-defined technical structure shaped by an ascending Trend Line, with the market transitioning from consolidation into a corrective pullback. After a prolonged bullish advance, the pair formed a Head and Shoulders pattern near the upper Supply Zone around 1.16660, signaling exhaustion of buying momentum. Following this distribution phase, price broke below the neckline and started moving lower, showing a clear shift in short-term control toward sellers.
Currently, EURUSD spent time consolidating inside the highlighted Range, where multiple false breakouts occurred before bullish continuation resumed. However, the recent rejection from supply and the breakdown from the pattern suggest that upside momentum is weakening. Currently, the price is trading below the former range support and is approaching the Demand Zone near 1.16100, which also aligns with a key horizontal support level.
My scenario for the next move is a continuation toward the 1.16100 demand area, where buyers may attempt to slow the decline. A strong bullish reaction from this zone could trigger a corrective rebound back toward the broken structure. However, if the price fails to hold this demand, the bearish pressure may intensify and open the door for a deeper pullback. As long as the market remains below the 1.16660 supply, the short-term bias stays bearish. Manage your risk!

XAUUSD Bullish Trend in Play — Path Open Toward 4,300 TargetHello traders! Here’s my technical outlook on XAU/USD (Gold) based on the current market structure. Gold remains in a broader bullish trend, supported by a clearly defined rising Trend Line that has guided price action since the beginning of the impulsive move. After the initial breakout from the Support Level, the market formed a well-structured range, followed by a corrective pullback and another consolidation phase, confirming healthy bullish rotation. Price is currently trading above the key Support Level near 4,140, while attempting to stabilize above the rising Support Line, which keeps buyers in control of the short-term structure. The recent breakout from the second range indicates renewed bullish momentum, with price now approaching the major Resistance Level around 4,260–4,270. As long as Gold holds above the support zone and respects the ascending trendline, the bullish scenario remains valid. The structure suggests continued pressure toward the upside, with TP1 positioned near 4,300, which aligns with the next key resistance area. A clean breakout above this level could open the door for further trend continuation and higher upside targets. However, a failure to hold the Support Line could lead to a deeper pullback toward the lower support zone. For now, the technical structure favors the buyers, with bulls aiming for a retest and breakout of the 4,260–4,300 resistance zone. Please share this idea with your friends and click Boost 🚀

ETHUSD — Bearish Retracement Toward Demand ZoneETHUSD is currently trading inside a broader distribution structure, with price repeatedly rejecting the strong supply zone near the 3,230–3,260 area. Multiple seller zones, along with the breakdown from the recent range, indicate weakening bullish momentum.
Price has shifted from an earlier UTA uptrend channel into a more corrective DTA structure, showing clear signs of distribution. After failing to break above supply, the market is forming lower highs and consolidating near 3,120—suggesting bearish pressure is building.
If the current range fails to reclaim upside levels, ETHUSD is likely to continue its downward corrective move toward the marked support around 3,030. A deeper drop could extend to the 2,910–2,950 demand zone, which is the next strong liquidity pocket. This is where buyers previously stepped in aggressively, making it a high-reaction area.
Overall, structure favors downside continuation unless price reclaims the upper seller zone with strong bullish momentum.
If this chart helped you understand the market structure more clearly, show some support! Like the post, drop a comment, and follow the profile to get more consistent updates, smart money concepts, and high-quality trade setups.

BTCUSDT Long: Buyers Defend 91K Zone – Targeting 96K ExpansionHello, traders! The current BTCUSDT price action is developing within a strongly structured bullish environment after a prolonged decline driven by the Descending Channel. Earlier, the market broke down from the upper supply region and continued to move lower while respecting the descending channel boundaries. After reaching a pivot low near the demand zone around 91,000, buyers stepped in, initiating a reversal and shifting momentum to the upside. Following this, Bitcoin formed a clean Ascending Channel that confirmed growing bullish pressure. Price then entered a Range phase, indicating temporary equilibrium before the next impulsive move. After completing this consolidation, BTCUSDT created a clear Head and Shoulders reversal structure near demand, signaling a strong bullish reversal. Buyers took control and pushed price sharply upward, breaking through the range and reclaiming higher structure levels.
Currently, BTCUSDT is trading inside a new Ascending Channel, steadily climbing toward the 96,000 supply level, where sellers previously reacted. As long as price remains above the 91,000 demand zone and continues to respect the ascending channel structure, the bullish scenario remains valid. The next upside target is the 96,000 resistance area, aligned with the upper channel boundary.
My scenario is a continuation toward 96,000 as long as buyers maintain control of the channel. However, a strong rejection from this supply zone may trigger a corrective pullback back toward demand before buyers attempt another move upward. Manage your risk!

XAUUSD: Triangle Breakdown Setup Points Toward $4,160 SupportHello everyone, here is my breakdown of the current Gold setup.
Market Analysis
Gold has recently moved out of a strong upward channel, where price previously showed consistent bullish momentum supported by higher lows and clean breakouts. After breaking out of the first channel, XAUUSD formed a consolidation range, signaling temporary equilibrium between buyers and sellers. This range acted as a base for the next impulsive bullish leg, which drove price back into a new upward channel. However, after the strong rally, gold formed a fake breakout near the $4,240 resistance area, which coincides with the upper boundary of the triangle resistance line. This false breakout indicated weakening bullish pressure and exhaustion near the top of the structure. Once price failed to hold above the resistance, it rotated downward and began forming a tightening triangle pattern between the descending resistance line and the rising support line.
Currently, XAUUSD is trading inside this triangle structure, with price gradually compressing. The $4,160 support level remains a key reference point, as it previously acted as a major demand zone during the last correction and is now aligned with the triangle’s lower boundary.
My Scenario & Strategy
My scenario is bearish as long as gold stays below the triangle resistance line and continues to respect the lower highs forming within the pattern. If price maintains this structure and fails to reclaim $4,240, I expect a downward move toward the $4,160 support zone.
Therefore, a clean breakdown below the triangle support line would confirm bearish continuation and could open the door for a deeper correction. On the other hand, if price rejects the support and breaks above the triangle resistance, the bearish setup becomes invalid, and buyers may attempt another retest of the $4,240 level. For now, the structure favors a short bias with the main objective being a move toward the $4,160 support level, which remains the next significant target for sellers.
That's the setup I'm tracking. Thank you for your attention, and always manage your risk.

Bullish Breakout Still Intact but Showing First Signs of ExhaustCAD/JPY 1H – Bullish Breakout Still Intact but Showing First Signs of Exhaustion at 111.95–112.00 Supply
Quick Professional Update & Current Status
Pair: CAD/JPY
Timeframe: 1-hour
Current Price: ≈111.78–111.83 (pulling back slightly from the 111.95 intraday spike)
What Has Changed in the Last ~13 Minutes:
Price spiked aggressively to 111.953 (new 2025 high) → hit the exact top of the annotated Strong Supply Zone (112.00–112.40).
Immediate sharp rejection with a long upper wick (shooting star–style candle) and a fast 15–20 pip drop.
Volume spiked on the rejection — clear evidence of heavy supply entering at that level.
Current Technical Picture:
The ascending triangle breakout remains 100 % valid — we are still above the former resistance (now support) at 111.40–111.60.
First real test of the breakout’s strength is happening right now.
Momentum indicators (RSI 1H) are rolling over from overbought territory for the first time since the breakout.
Key Levels Right Now (as of this candle):
Immediate support cluster: 111.60–111.70 (must hold for bulls)
Stronger support: 111.40–111.50 (breakout zone — critical)
Resistance overhead: 111.95–112.00 (today’s spike high + supply)
Next upside targets still in play: 112.20 → 112.70–112.80 (only if 112.00 is cleared decisively)
Updated Bias & Trade Management (Professional View)
Bias: Still bullish / LONG, but caution warranted — no longer “aggressive buy-the-dip” mode.
Active Scenarios:
Bullish continuation (70 % base case):
Healthy 30–50 pip pullback into 111.50–111.70, consolidates, then resumes higher toward 112.20+.
→ Add or hold longs on a successful retest of 111.60–111.70.
Failed breakout / bearish trap (30 % risk):
If we lose 111.40 on a closing basis → high probability of a fast drop back into the prior range (111.00–110.60).
→ Tighten stops or take partial/full profits.
Immediate Actionable Levels (next 1–4 hours):
Protective stop for fresh breakout longs: 111.38 (just below breakout zone)
Aggressive re-entry / add zone: 111.58–111.68
Take-profit scaling: 50 % off at 112.00, trail the rest

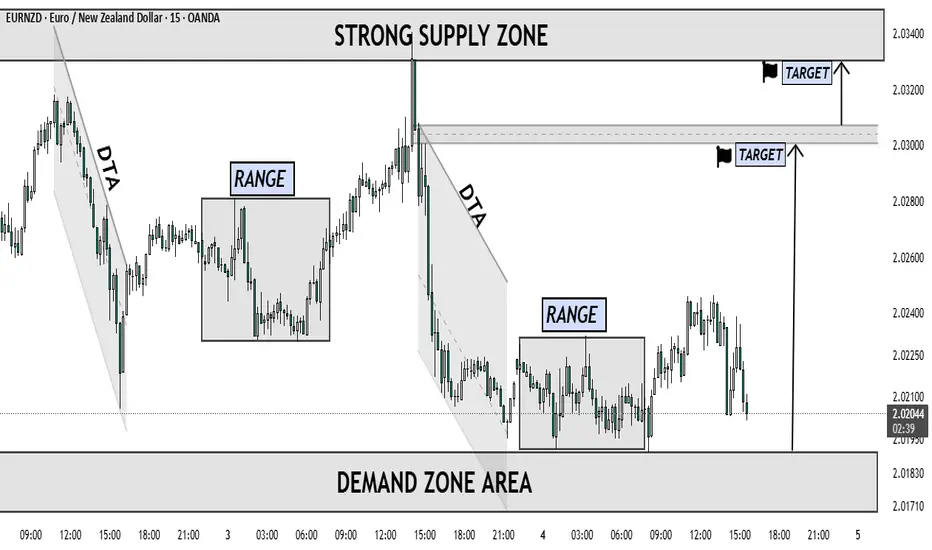
EURNZD – Demand Zone Rejection with Upside Targets AheadEURNZD is currently trading inside a well-defined Demand Zone Area, where price has shown multiple signs of rejection after a prolonged DTA (Drop–Trapped–Accumulation) structure. The market previously formed a clear Range Phase, indicating liquidity buildup before directional movement.
Price has tapped deeply into the demand zone, showing slowing bearish momentum and early signs of accumulation. If buyers continue to defend this zone, a bullish reversal toward the upside becomes likely.
The first objective sits at the minor supply / internal liquidity zone, marked as the first Target. If momentum strengthens, price may extend toward the Strong Supply Zone, which aligns with the second Target area. This zone is where major sellers previously stepped in, so strong reactions may occur once reached.
Overall, the chart suggests:
Demand Zone holding → potential bullish reaction
First target: internal supply
Second target: major supply zone where a larger reversal could form
A bullish continuation is favored as long as price remains above the demand zone area.
EURUSD Long: The 1.16200 Support Holds – Path to 1.17000 is OpenHello, traders! The price action for EURUSD is unfolding inside a corrective structure after a prolonged bearish phase that was guided by the descending Triangle Supply Line. The market previously formed a consolidation Range on the left side of the chart before breaking down and continuing lower. Price respected both the descending supply line and the ascending Triangle Demand Line, creating a compression phase that ultimately resulted in a bearish breakout to the downside. After forming a pivot low, EURUSD initiated a strong bullish recovery, breaking back above the former structure and confirming a shift in short-term momentum. The market then formed a clear Head and Shoulders reversal pattern near the Triangle Demand Line, reinforcing buyers’ strength. Following this, price successfully broke through the key Demand Zone around 1.16200, confirming the transition from corrective to bullish conditions.
Currently, EURUSD is retesting this demand area after the breakout, showing signs of support holding. As long as price remains above the 1.16200 demand zone, the bullish scenario remains valid. The next upside objective is the 1.16650–1.17000 Supply Zone, where sellers previously showed strong activity.
My scenario is a clean continuation toward Supply 2 at 1.17000 becomes likely if buyers maintain control. However, a rejection from this supply region could trigger a corrective pullback back toward demand before any further upside continuation. Manage your risk!

Gold Bulls Hold Control — Targeting $4,320 ResistanceHello traders! Here’s my technical outlook on XAU/USD (Gold) based on the current market structure shown on the chart. After a strong bullish impulse earlier in the period, Gold formed a distribution Range below the main Resistance Level, where multiple upside attempts were rejected and the price eventually turned around from the upper range boundary. This rejection initiated a corrective decline that respected the descending Resistance Line, while buyers gradually began to defend the Support Line, leading to a compression structure that later transitioned into a reversal phase. Following this consolidation, Gold successfully broke above both the internal range and the descending resistance, confirming a shift in market structure. Price then entered a well-defined ascending channel, forming higher highs and higher lows along the rising Support Line. Several clean breakouts inside the channel confirm sustained bullish momentum, with buyers clearly in control as long as the channel structure remains intact. Currently, price is consolidating just above the $4,160–$4,140 support zone, holding above former breakout levels and respecting the lower boundary of the ascending channel. This behavior suggests a healthy bullish pullback rather than trend exhaustion. As long as Gold remains above this support area and holds inside the channel, the bullish scenario remains valid. My expectation is for a continuation move toward the upper boundary of the channel, with the main upside target at TP1 around $4,320, where the previous resistance and projected channel resistance converge. A clean breakout above this level would open the door for further bullish expansion. However, a sustained break below the $4,140 support or a drop out of the channel would weaken the bullish structure and could trigger a deeper corrective move. Please share this idea with your friends and click Boost 🚀

Bullish Expansion from Demand to Supply Zone .The chart shows a clean price delivery sequence moving from a Demand Zone Area toward a Strong Supply Zone, following a classic market-structure progression of trend → range → breakout → mitigation → target.
Price initially declines through a DTA (Downtrend Area) before stabilizing inside a range, where liquidity builds up. After multiple tests of the demand zone, buyers gain control, causing a strong upward trend acceleration (UTA).
A breakout occurs above the mid-range, confirming a shift from accumulation to upward expansion. Price then revisits the Buyer Zone, mitigating previous imbalances and validating the breakout. From this retest, the market rallies cleanly toward the Strong Supply Zone, where sellers finally step in.
The chart identifies two potential targets—one at the upper supply reaction level and another at the lower seller zone—showing both bullish continuation and possible pullback scenarios. Overall, the structure reflects efficient price movement with well-defined institutional levels, trend phases, and liquidity points.
If this chart helped you understand the market structure more clearly, show some support! Like the post, drop a comment, and follow the profile to get more consistent updates, smart money concepts, and high-quality trade setups.

XAUUSD Long: Channel Support Holding — Buyers Target 4,300 ZoneHello, traders! The price auction for XAUUSD has been unfolding within a clearly structured bullish progression after a period of heavy distribution inside the Supply Zone. Earlier, gold established a wide Range between the Supply and Demand areas, with multiple sharp rejections forming the top of the structure. Eventually, sellers pushed the price lower, initiating a corrective decline that developed into a well-defined Triangle Pattern, marked by a descending Triangle Supply Line and a rising Triangle Demand Line. This compression ended with a clean breakout to the upside, signaling the beginning of a new bullish phase. Following the breakout, XAUUSD formed a Pivot Point near the mid-range level, where price briefly rejected before continuing its upward trajectory. Another notable phase was the formation of an inverse Head-and-Shoulders structure, confirming buyer strength after a fake breakout below the neckline. This reversal pattern provided the foundation for the current bullish continuation.
Currently, gold is trading inside a strong Ascending Channel, respecting both channel boundaries with consistent higher highs and higher lows. The latest breakout from the mid-channel zone has kept the bullish structure intact, and after a corrective pullback to the lower channel boundary, price is attempting to resume upward movement. As long as price holds within this channel, the market dynamics favor a continuation toward the 4,300 resistance target, which aligns with the upper boundary of the channel and the previously broken structure.
My scenario for the development of events is bullish, with expectations of a rebound from the lower channel boundary followed by a continuation toward the 4,300 resistance level. In my opinion, maintaining structure within the ascending channel supports further upside as long as buyers defend the 4,110 support region below. Manage your risk!

Premium vs Discount Zones: Where Smart Money PositionsPrice doesn’t move in a straight line. It oscillates within swings, creating areas where buying or selling becomes more favourable.
Understanding premium and discount zones is how professionals identify where the market offers opportunity and where it carries unnecessary risk. It is a simple framework, but it shifts your mindset from chasing movement to positioning with intention.
Every significant swing in price has two halves. The upper half of a swing is the premium zone; the lower half is the discount zone. Premium is where smart money distributes or looks for short exposure. Discount is where accumulation and long positioning become attractive.
These zones reflect nothing more than logic: buy lower than average, sell higher than average.
To identify these areas, start by marking a clear swing high and swing low. The midpoint between them creates an equilibrium.
Above that midpoint, the market trades at premium; below it, at discount. This doesn’t guarantee reversal points, but it provides structure for understanding where traders with size can enter with reduced risk.
In an uptrend, the goal is to position within discount zones.
Buying in premium exposes you to deeper retracements, failed impulses, and weaker continuation. Discount buying aligns you with the dominant direction while keeping your risk defined.
In downtrends, the logic reverses: premium becomes the ideal zone to sell into, not chase.
What elevates this concept is combining it with liquidity and structure. A discount zone with a strong higher low carries far more weight than discount alone. A premium zone paired with equal highs or a liquidity sweep becomes a cleaner short.
These layers create clarity on where the market is likely to react, rather than relying on individual candles.
Premium and discount zones also prevent emotional trading. When price is in premium during an uptrend, the temptation to chase a breakout is high. The framework reminds you that continuation is less probable and patience often pays.
When price enters discount, the market offers a logical window to build positions without relying on prediction.

GBPCAD — Potential Breakout Zone / Support‑Resistance BattleGBPCAD is currently approaching a key horizontal support zone that has historically acted as a strong reversal area. Price has respected this level multiple times, indicating potential for a bullish bounce.
Bullish Scenario: If the support holds, the pair could start a significant upward move targeting recent swing highs. Traders should look for bullish candlestick patterns such as pin bars, engulfing candles, or strong rejections at the support level as confirmation of buying interest.
Momentum & Confirmation: Supporting indicators like RSI, MACD, or moving averages may provide additional confirmation of a bullish trend continuation. A rising momentum or positive divergence could strengthen the probability of a successful long setup.
Trade Considerations: Entry near the support zone can provide a favorable risk-to-reward ratio, while stops can be placed just below the support to manage risk. Monitoring volume and price action around the support can help filter false breakouts and validate the strength of the bounce.
Outlook: A confirmed bullish bounce from this zone could lead to a continuation toward higher resistance levels, offering short-term and medium-term trading opportunities. Traders should watch for any signs of trend reversal, but the current structure favors long positions.
Summary: GBPCAD shows a clear bullish setup near a critical support area. With proper confirmation and risk management, this level could offer a high-probability long trade opportunity.

BTCUSD Long: Volatility Rising — Retest of 90,000 ExpectedHello, traders! The price auction for BTCUSD has been in a corrective phase, forming a broad descending structure guided by the major Trend Line. This bearish pattern has been defined by a sequence of lower highs and lower lows, with price repeatedly getting rejected from the Supply Zone and consolidating inside the highlighted range. The market has respected both the descending supply line and the rising Demand Line, creating a well-defined compression of price action.
Currently, the auction is at a critical inflection point, with BTC retesting the Demand Line near the 85,600 demand level. After a series of volatile moves inside the range, the price is attempting to stabilize at this structural support while gradually approaching the descending trendline once again. This tightening of volatility between supply and demand suggests that a significant directional move is likely to occur soon.
My scenario for the development of events is a bullish rebound from the Demand Line, followed by a test of the descending supply line. I expect the price to attempt an impulsive breakout toward the major Supply Zone. In my opinion, a successful breakout above this zone may carry BTC toward the 92,300 resistance target marked on the chart. Manage your risk!

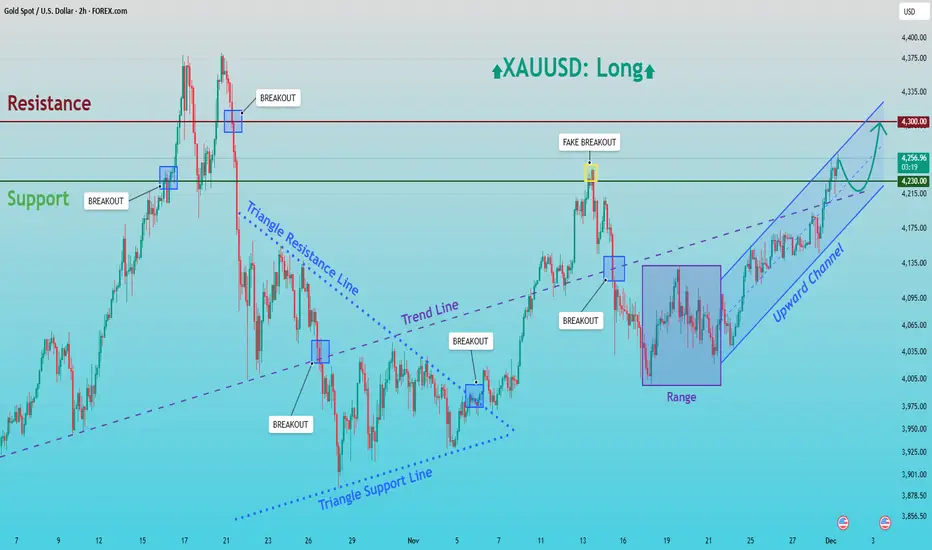
XAUUSD: Buyers Eye Retest of the $4,300 Resistance ZoneHello everyone, here is my breakdown of the current XAUUSD setup.
Market Analysis
Gold continues to trade within a well-structured bullish environment following a strong recovery from the lower Triangle Support Line earlier in the month. After a prolonged corrective phase inside a symmetrical triangle, price eventually broke above the Triangle Resistance Line, shifting the market structure from consolidation into bullish continuation. This breakout created a clear trend shift, supported by a steady sequence of higher highs and higher lows. After the breakout, XAUUSD entered a temporary Range phase, suggesting accumulation from buyers before the next impulsive move. Once price broke out of that range to the upside, the market formed a clean Upward Channel, showing sustained bullish pressure. A notable fake breakout above the Resistance Zone around 4,260 occurred recently, indicating strong seller activity at the top of the zone, but buyers quickly regained control and continued to push price upward within the channel.
Currently, gold is trading near the mid-upper area of the Upward Channel, approaching the 4,300 key Resistance Zone. The broader technical picture shows clear bullish market structure, with trendline support and channel dynamics favoring further upside as long as the channel remains intact.
My Scenario & Strategy
My scenario is bullish, supported by the strong rebound within the Upward Channel and the consistent higher-low structure. As long as price remains above the 4,215–4,230 Support Zone and respects the channel’s lower boundary, buyers hold a clear advantage. My expectation is that XAUUSD may make a minor pullback toward the mid-channel zone near 4,230 to gather liquidity before continuing the upward movement.
Therefore, the primary bullish target remains the 4,300 Resistance Zone, where a retest is highly probable. A clean breakout above 4,300 would open the door for a stronger rally and signal continuation of the broader bullish cycle. However, if gold fails to break the resistance and forms a deeper correction, the Upward Channel support and the prior breakout zone at 4,215 will be key levels to watch. The bullish bias remains valid as long as these supports hold. For now, the structure favors a long scenario with attention on the move toward 4,300 and potential bullish continuation beyond that level.
That's the setup I'm tracking. Thank you for your attention, and always manage your risk.
BTCUSD Short-Term Setup: Buyers Defend Support, TP1 at $89,200Hello traders! Here’s my technical outlook on BTC/USD based on the current market structure. After reaching the Seller Zone near $92,000, the price once again faced strong rejection, forming a clear reversal right under the descending Trend Line. This confirms that sellers continue to defend this area and keep Bitcoin within a broader corrective structure. From there, BTC pulled back toward the Buyer Zone around $86,000–$85,500, which has acted as a reliable support multiple times in the recent sessions. The market is now forming a potential short-term recovery after a fake breakout below this zone, highlighting attempts from buyers to regain control. However, as long as the price trades below the Seller Zone and the descending Trend Line, bearish pressure still dominates the chart. The structure suggests that Bitcoin may attempt a move toward TP1 at $89,200, where the market previously consolidated and faced resistance. A clean rejection from the Trend Line could send the price back toward support for another test, while a confirmed breakout above $92,000 would shift short-term sentiment and open the way for stronger bullish continuation. On the other hand, a breakdown below $85,500 could expose BTC to deeper declines toward lower support lines. Please share this idea with your friends and click Boost 🚀

NZD/USD — Swing Zone Key Support & Resistance for a BreakoutNZD/USD — Swing Zone Key Support & Resistance for a Breakout or Reversion
It appears to show candlesticks (or candles) over a given timeframe — each candle representing price action over a set period (the timeframe isn’t specified in the snapshot). The chart provides a visual of highs, lows, opens, and closes for that period.
If there are any indicators or overlays (e.g. moving averages, support/resistance zones, trend‑lines), they are not clearly visible in the shared snapshot — so analysis must rely on raw price action (see below).
🧠 Price Action & Structure
From the visible segment of the chart:
Trend bias: The price history seems to show swings — there may have been a recent downward move followed by some consolidation or attempt to rebound. The pattern suggests possible correction or consolidation rather than a clean, strong uptrend or downtrend.
Support and resistance zones: Given the swings, there are likely to be key price levels (swing highs as resistance, swing lows as support). Traders often draw horizontal lines at these pivots to anticipate reactions.
Volatility and uncertainty: The visible swings suggest volatility — price is not moving in a straight line, which means participants should be cautious; the market might be swinging between support and resistance rather than trending.
If you were to trade or follow NZD/USD based on this chart:
Watch for breakouts above recent swing‑high (would signal bullish momentum) or breakdowns below swing‑low (possible bearish continuation).
Use support/resistance zones — since price seems to bounce between highs and lows, trading reversals or breakouts could be viable.
Avoid entering during consolidation or “chop” — when price action is indecisive, risk is higher; wait for clearer structure or confirmation. This echoes general chart–reading best practices.

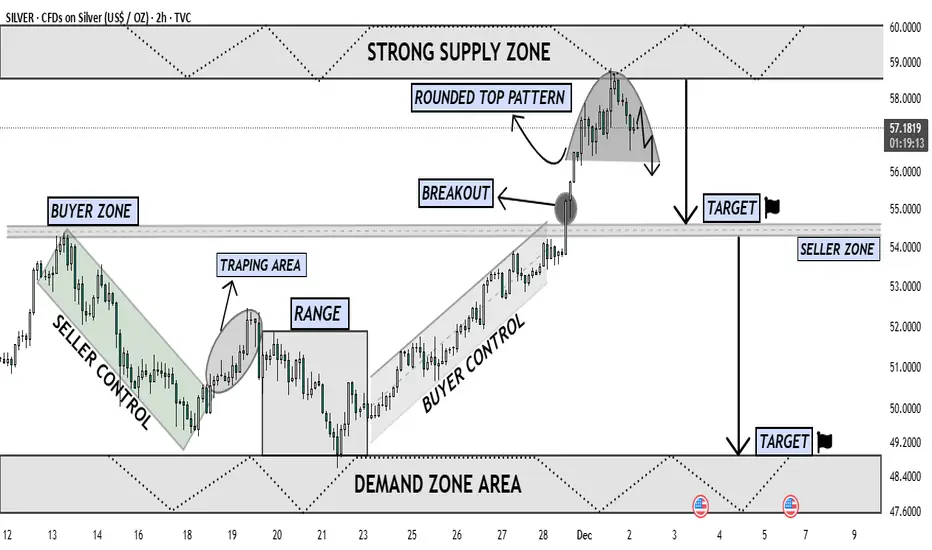
Silver Forming Major Top Near Supply Downside Retracement LikelyThe chart shows Silver reaching a major Strong Supply Zone near the 58–60 level, where price has reacted multiple times in the past. After a strong impulsive rally driven by Buyer Control, the market broke above the previous Buyer Zone, confirming bullish strength. However, once price entered the upper supply region, momentum started to fade, forming a clear Rounded Top Pattern — a classic distribution structure indicating exhaustion of buyers.
Following the breakout retest, buyers failed to continue upward, and sellers stepped in aggressively from the supply zone. The chart now shows a shift from buyer dominance to seller pressure, with price beginning to curve downward inside the rounded top. This shape reflects decreasing highs, weakening demand, and early reversal signals.
The projected move suggests that once the neckline of the rounded top breaks with strong bearish candle confirmation, price is likely to fall toward the first Target Zone around 54, which aligns with the Seller Zone and previous breakout structure. If bearish continuation remains strong, the next logical target lies in the Demand Zone Area between 48–49, where liquidity is expected to support a potential reversal or consolidation.
Overall, this chart indicates a high-probability corrective phase, with sellers preparing to reclaim control as the market rejects the supply zone and transitions into a deeper pullback phase. Buyers must show strong defense at the mid-support; otherwise, Silver could decline further toward the lower demand region.