AUDCAD Potential Bearish MovementAUDCAD Potential Bearish Movement
we are waiting for a momentum candle close below 0.890 to sell this one
Reason:
1- Regular Bearish Divergence on MACD (in red)
2- Objective Wedge Pattern (in blue)
3- Resistance / Round number in purple 0.910
Three confluences are enough to consider Selling AUDCAD, after a break below 0.890 (in gray)
Rejection

EURUSD SHORT IDEAAs seller's pressure rejected the price from breaking the resistance zone, we a cool to go short.

USD/CAD, Heading Towards Major Resistance ZoneIf we see USDCAD rejecting the resistance zone on the 4h chart, we can look for short entry confirmations on the hourly chart.

USDCAD Long Trade *SUPPORT ZONE*USDCAD has reached the 1.38600 support zone and is showing signs of rejection. If bullish candle closures remain then I can see buying at these levels should prove profitable.
There is a 1hr bearish trend in play (trendline shown) so watch for price reactions there. If that TL breaks to the upside then 1.40200 and even 1.42500 could be achieved.
The dollar us always in demand in times of global uncertainty and we are definitely in that right now.
Stop losses should be placed conservatively below the wicks testing this support zone.

USDCHF Update! This is a full breakdown of my perception of price action on higher time frames! I take my entries using smaller time frame confirmation and you should, too. If you have any questions about this trade or my strategies feel free to ask them in the comment section below!
Let’s make some money together!


EURUSD Potential Bullish MovementEURUSD Potential Bullish Movement
we are waiting for a momentum candle close above our gray zone 1.0895 to buy this one
Reason:
1- Divergence on MACD (in red)
2- Objective Inverse Head and Shoulders (in orange)
3- Support Zone from Daily
Three confluences are enough to consider Buying EURUSD, after a break above our gray zone 1.0895
** meanwhile, this pair is overall bearish until the buy setup is activated

Ethereum - ETHUSD Potential Bearish MovementEthereum - ETHUSD Potential Bearish Movement
we are waiting for a momentum candle close below 185.0 to sell this one
Reason:
1- Regular Bearish Divergence on MACD (in red)
2- Objective Trendline (in blue)
4- Supply / Round number in purple 200.0 (in purple)
Three confluences are enough to consider Selling ETHUSD, after a break below 185.0 (in gray)
** meanwhile, this one is overall bullish until the sell is activated

NZD/USD SHORTbeen rejecting trend line consistently as it broke the uptrend and created the down trend rejecting of multiple spots to create the down trend , looking to take this the bottom trend line to create the 3rd touch .

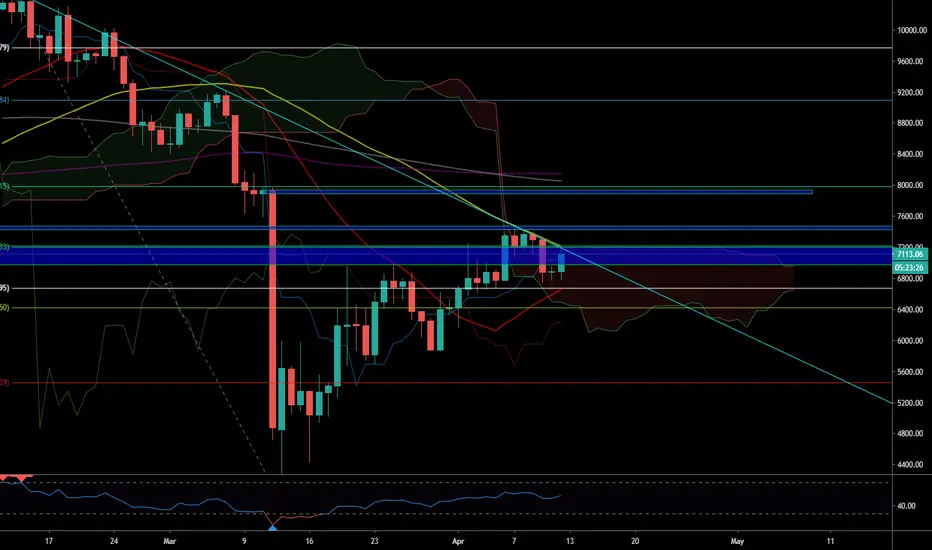
BTC Key Zones & Market ComparisonWe've been trading in an upward channel for roughly 42 days now.
We're now approaching the .618 fib level of the last peak which is roughly $8k, which lines up with our longterm resistance zone as well. I wouldnt be surprised to see a move up to there before a pullback, but keep in mind we could trade up to the upper end of the channel as well considering it's still in our red resistance zone. Regardless, these are my short zones.
Traditional markets continue to rally upward.
You can see the correlation between BTC and S&P with regards to price action.
BTC broke down for an approximate 50% immediately following Trump's speech of a total shutdown, causing the S&P and other traditional markets to plummet down as well.
At this very moment although we had a breakout to the upside you can see possible rejection forming. We'll see if it continues to display signs of exhaustion or if we actually break further up.
Move up to 8.3k region is still in the cards for now.
I am pretty skeptical of new highs with regards to traditional markets. I'm anticipating another leg down in which I would expect the major move for BTC as well, likely to the downside for now and doesn't necessarily have to happen right now this instant.

EURGBP Possible Long back up to resistance levelEURGBP is rejecting the support level so I think that price will move up to around the resistance level

EURJPY LongWe have a possible long position here affter some rejection and the break of the trend line.
At the moment the price still having some bearish moment but in some hours maybe ready

EURUSD SHORTLooking at my previous EU sell which went as expected and fell past the target 2, having seen that the price has several times retested and failed to break the ascending trendline.
I would be looking at some further downside potential on this pair, hopefully down to my original target 3 area.

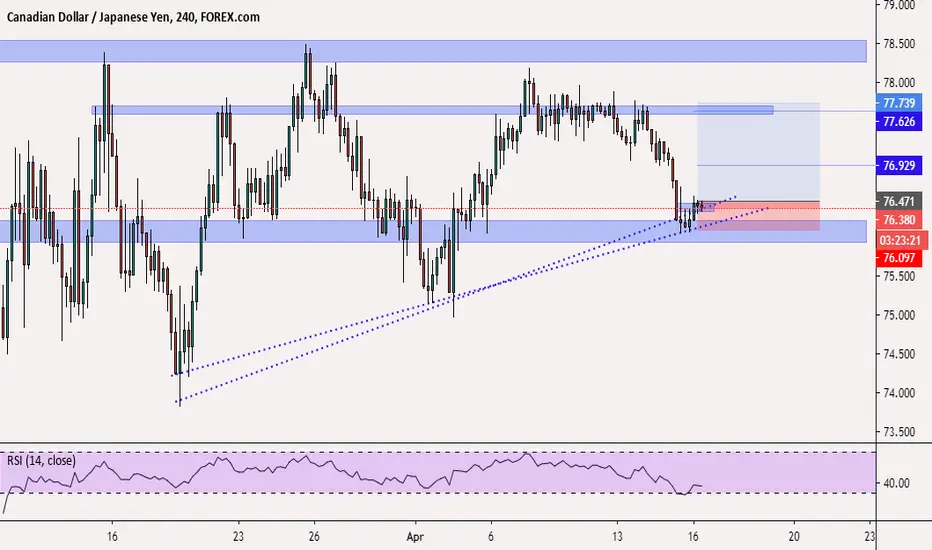
CADJPY Long (Affter some clear confirmation)We have a possible rejection from this point looking from the weekly time frame point of view. (this chart here is not the weekly)
More confluence of rejection!Daily ma,ob,ichimoku,fibonacci and trend line all rejected.
imo if we break up bullish as,but too much rejection atm at the same level
A relação entre as EMA de 9, 50 e 200 dias com ETH/USDC...Essa interação está realmente única...
Reparem como o preço usou a EMA de 9 dias como suporte, rompeu a EMA de 50 dias, sentiu resistência da EMA de 200 dias, depois usou a de 50 como suporte, e rompeu a de 50 novamente para usar a de 9 dias como suporte!
Vamos esperar algum tempo e ficarmos atentos para observar se a EMA de 9 dias irá ser rompida, o que seria uma indicaçã de baixa, ou se ela atuará como suporte para depois o preço romper as resistências das médias exponenciais de 50 e 200 dias.
Na minha opinião, existe uma boa probabilidade do preço movimentar-se um pouco dentro do canal, para depois ROMPER A EMA DE 9 DIAS E DESVALORIZAR!
AVISO LEGAL: o conteúdo postado nessa página não é conselho financeiro e não deve ser entendido como tel. O propósito dos posts é a INFORMAÇÃO. Invista e faça trocas de ativos baseado no seu próprio julgamento e risco!

Daily Bullish Divergence (ETHEREUM)Really loving this look right now.. Big bullish divergence on the daily time frame.. I truly believe in the technology that Ethereum has brought into the world..
However..
I do not like how we are approaching a long-term support and resistance zone..
I also do not feel comfortable with the volume..
I have a long-term holding position in Ethereum however if we have another drop I will certainly be putting more capital to work.. But maybe I already missed the opportunity.. Let's see..
--
MNLZ

good support area to wait forThe pairs has nearly reached for a good support level that we possibly are having a up trend if the price keep rejecting this support
please do your own research for any entry this is to share with you guys not an a signal by any mean

Unique Weekly Trend During BTC correctionI have noticed an odd yet unique pattern happening with Bitcoin ever since the crash sub 4k.
Bitcoin always starts the week off Really Strong following the stock market and is able to hold of most of its gains into Friday , then over the weekend when all markets but Bitcoin are open everything gets dumped back to square one at the 6k Baseline Support.
There is a strong case for this to occur again this week as Bitcoin failed to break higher despite the numerous attempts by the bulls to get bitcoin into the 7k region.
The Stochastic Rsi is showing a double top a bearish sell signal we haven't seen a while that has proven to be valid and of high probability for bitcoin.

BITCOIN BREAKOUT - Ascending triangle loversHey there,
Please support this idea with your likes and follow me on Tradingview.
As you can see we are most likeley in an ascending triangle in Bitcoin, which sends of strong bullish signals.
We had a breakout recently above 7k, but I already expected a rejections, since this breakout was
in my opinion premature. I expected a third touch of resistance, a retrace down to support, befor then
finally significantly breaking 7k. Also btw a perfect touch of the fib retracement from 3k drawn to 14k.
You would know all of that if you were watching my youtube videos.
If you arent't an accumulator down here, I would suggest thinking about your trading strategies and most likely
moving away from trading, since you obviously are a herd thinker and do what others tell you.
Of course this is not financial advice, but this is the time to buy Bitcoin heavily and buy more if it drops lower.
Although I think that this is very unlikely.
Cheers,
Konrad

GBPUSD SHORTSeveral rejections of the yellow resistance area, rejections of the descending trendline and 200sma. Lines up perfectly with the 'golden pocket' area of the fibonacci.


BITCOIN PRICE REJECTS $6.9K? WHAT NEXT ?The price of bitcoin has shown a strong surge over the past weeks as price rallied from $3750 to $6900, however we see a rejection at the $6900 level which confirms a resistance.
The daily chart is showing a clear rejection which is not a bullish perspective to look for, since price wasn't able to break $6900. We could be looking at lower support levels below at $5600-5800, $4750-$4900 and $4250-$4400. These levels are substantially higher timeframe support levels which could provide potential long opportunities, if price rejects these levels spotted on the Daily chart then BTCUSD could be heading lower !
The price of bitcoin lost an uptrend, which indicates that there's more downwards momentum to come .
Risk Warning : The risk of loss in trading Foreign Exchange (FOREX) can be substantial.
You should therefore carefully consider whether trading is suitable for you in the light of your financial condition.
Goodluck !
