Rising Wedge Pattern S&P 500There is clear a Rising Wedge Pattern formed on S&P 500 4h chart .
There was even a retracement from all-time highs of 6979 back inside the wedge before the weekend.
My suggested SL is 7030-7050 and TP 6500-6550 for the short-to-mid term.
On a larger scale, there is also a huge channel that we are testing the top of right now:
Going all the way back to 2008..
It could easily end up like this:
So for longer term I can see 6100, 5500, 5000 and if recession hits than even 3500.
There has never been such a major Fed hiking and cutting cycle that did not eventually cause a recession. Also, the labor market is weaker than the headline numbers make it seem. Lots of massive downward revisions on NFP. Even the unemployment number is growing slowly, mostly because Labor Force Participation is dropping. If we account for that, then the real unemployment rate is more like 5.5%.
Here are some more examples of rising wedges going back to the pandemic:
Rising Wedge

GBPCAD Triple Top Points To Potential Triple EventOANDA:GBPCAD on a multi-timeframe analysis allows us to breakdown this False Breakout of the Rising Wedge on the Weekly chart, lets check it out!
Price on the Weekly had made a Bearish Breakout of the Rising Wedge but price has had a great Bullish rally all week and undid all the Price Action following the Breakout of the Rising Support.
On the Daily since the Low of the Breakout @ 1.83238, OANDA:GBPCAD has begun to form an Expanding Range with Higher Highs laying out a Rising Resistance.
- MACD is signaling Bullish with lines just crossing 0 and Histogram forming green bars
Everything is saying Bullish but,
On the 4Hr we can see that Price has formed a Triple Top at the Resistance Level formed from the Highs of Dec. 4th around 1.86328 - 1.86675.
- RSI is showing a Divergence of Highs in Price
- Volume is waning as the Highs form
- MACD is signaling Bearish with a Crossover event and Histogram forming red bars
Now if Price falls below 1.85997, this will confirm the Triple Top and will mean we will be looking for Price to fall down to the AOV around 1.8546 - 1.8528.
If Price is able to find support around this level, this would Confirm the Bullish Bias on OANDA:GBPCAD on the Daily and Weekly.

Rising Wedge Signals Sell from HighGold (XAUUSD) – H1 Complete Analysis (Rising Wedge + RSI + Volume)
On the H1 timeframe, Gold is showing signs of a distribution phase. During the recent session, price has formed a Rising Wedge pattern, which is considered a bearish reversal or bearish continuation pattern, especially when it appears near the end of a move.
The Rising Wedge structure is clearly visible, where price is making higher highs and higher lows, but both trendlines are gradually converging. This indicates that although price is moving higher, buying strength is weakening. In many cases, the market uses this structure to collect liquidity at higher levels before breaking down to the downside.
The RSI analysis further confirms this weakness. RSI is trading around the 57–60 zone, close to overbought territory, but it is not showing strong bullish continuation. While price continues to move higher, RSI is failing to follow with the same strength, sign ling loss of momentum and increasing the probability of a bearish move. This behavior is commonly seen in sell-from-high setups.
Volume behavior provides an important confirmation. As price moved higher within the rising wedge, volume gradually declined, which suggests that smart money is not aggressively buying at higher levels but is instead distributing positions. In such conditions, once the lower support of the wedge is broken, a strong bearish move accompanied by a volume spike is often seen.
When all three factors are combined Rising Wedge (bearish pattern), weak RSI momentum, and declining volume the sell-from-high bias on Gold H1 becomes stronger.
Trade Idea:
The preferred approach is to look for sell opportunities near the upper boundary of the wedge or recent highs, but only after proper confirmation, such as a bearish candle close or a clear break below wedge support.
Targets: TP1: Midpoint of the wedge
Main Target: 4300 zone (next liquidity)
Stop Loss:
Above the recent high or above the wedge structure (tight risk management)

Why This 2022 Bitcoin Fractal Might Fail The 2022 bear‑market fractal 📉
The fractal taken from the 2022 bear market. Back then Bitcoin built a rising wedge pattern and then dropped about 60% in value from the breakdown.
What “everyone” expects now 😱
Many traders now expect Bitcoin to repeat that same pattern crash.
Social media, bears and even cautious bulls keep pointing to the old wedge and saying “this dump is next.”
Why this time can be different 💡
Markets rarely give the majority the easy trade; when everyone leans to one side, that scenario often gets crowded and fails.
If most traders are positioned for a huge crash, any sustained bid or positive macro surprise can squeeze them and send price higher instead.
My view based on the chart 📊🚀
I consider an alternative path: a choppy but upward trend, driven by forced short covering and new buyers stepping in as the crash fails to appear.
Key takeaway ✅
Yes, the 2022 fractal shows what could happen.
But because almost everyone already sees and trades that same pattern, the higher probability play now is that Bitcoin does not repeat the exact 60% wipeout and instead grinds higher while late bears get trapped.

Price-Action Analysis (Gold – Daily Chart)Price-Action Analysis (Gold – Daily Chart)
1. Rising Wedge Structure
The chart highlights a rising wedge, where price is moving higher but the slope of the highs and lows is converging.
This shows that although price is advancing, the momentum is slowing because each new high is made with decreasing strength.
The wedge boundaries show price repeatedly touching both the upper and lower trendlines.
2. Recent Price Behavior
Price moved from the lower wedge boundary upward and recently touched the resistance area near the upper boundary.
After this touch, the latest candle shows a pullback, indicating a pause in upward momentum.
This is consistent with price meeting the top of a tightening structure.
3. Interaction With EMAs
Price has been trading above the EMA 7, EMA 9, and EMA 21, reflecting short-term upward pressure.
The EMA 50 lies further below and has acted as a secondary dynamic support in earlier phases of the chart.
The clustering of EMAs under price indicates a generally constructive short-term trend.
4. Possible Breakdown Area (Structure-Based)
The dotted vertical measurement displayed on the chart illustrates the height of the wedge.
This height is often used to project a distance, not as a signal, but simply to visualize how the pattern size compares with nearby price areas.
The green “Target” box reflects this projected measurement placed below the wedge’s lower boundary, representing a hypothetical zone based solely on the wedge’s size.
5. Volume Context
Volume appears higher during strong downward candles earlier in the chart, then stabilizes during the wedge.
This fits a common observation where momentum can slow as patterns tighten.
📌 Summary (Neutral & Descriptive)
Gold has been moving inside a rising wedge, showing higher highs and higher lows within a narrowing structure. Recently, price touched the upper boundary of the wedge and showed a mild pullback, indicating reduced momentum at that level. Price remains above several EMAs, reflecting ongoing short-term strength, while the pattern itself shows compression. A measured-move projection is drawn underneath the wedge to illustrate how its height compares with lower price zones if the structure were to resolve downward.

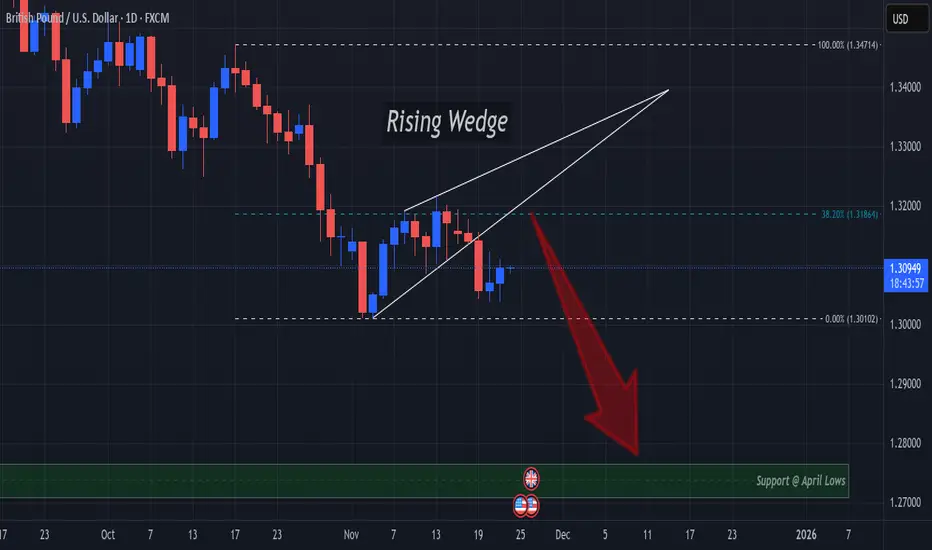
Rising Wedge Breakout Spells Decline Continuation For GUFX:GBPUSD delivered a Breakout of A Rising Wedge to end the week last week!
Next, we should suspect a Retest of this Breakout @ the 38.2% Retracement level around 1.31864.
This level proved to hold price below it through the formation of the pattern and would serve as a great area of opportunity to short the pair and ride Price down!
If the Retest of the Breakout is successful, Price would next find Support at the April Lows around the 1.28 - 1.27 area!
Fundamentally its a heavy week for USD with events for GBP littered throughout so keep a close eye on how the results end up affecting the markets!
Bitcoin Bear Market 2026 | Macro Cycle & Rising Wedge BreakdownBitcoin Macro Cycle Analysis (2013–2029) | Rising Wedge Breakdown • 2026 Bear Market Targets • Historical % Drops & Next Accumulation Zone
Bitcoin historical data strongly follows multi-year macro cycles , where each bull market has been followed by a deep bear market correction:
📉 2nd Cycle (2017–2018)
Top: 19,666 (17 Dec 2017)
Bottom: 3,122 (15 Dec 2018)
Correction: –84.23%
📉 3rd Cycle (2021–2022)
Top: 68,997 (8 Nov 2021)
Bottom: 15,479 (9 Nov 2022)
Correction: –76.64%
📉 4th Cycle (2025–2026 – Ongoing)
Top: 126,272 (6 Oct 2025)
Rising Wedge + Distribution Phase breakdown confirms bearish structure shift
Based on historical cycle behavior and on-chain indicators, Bitcoin has entered the 4th major bear market
📍 Projected Bottom Zone (2026)
Primary Support Zone:
➡️ $40,000 – $42,000 – $45,382
(Aligned with Wedge Breakdown + Macro Support)
Percentage-Based Targets:
–68.16% drop: → ≈ $40,000
–74% historical drop scenario: → ≈ $31,000 (max capitulation zone)
📅 Expected Bottom Window:
September – October 2026
→ Historically the strongest long-term buying opportunity .
📈 5th Cycle Expectations (2026–2029)
Bitcoin has been following a Long-Term Rising Wedge (Bearish Continuation / Reversal Pattern) since 2021.
This pattern is expected to fully complete by April 2029 → leading into a new long-term top and then the 5th bear market .
⭐ Why This Analysis Matters
Combines **cycle history**, **on-chain metrics**, **pattern analysis**, and **macro support zones**
Helps identify high-probability long-term Bitcoin accumulation levels
Useful for swing traders, long-term investors, and cycle-based portfolio strategies
🔔 If You Find This Analysis Helpful
👍 Like • 💬 Comment • ⭐ Save
It motivates me to share more high-quality Bitcoin cycle research!

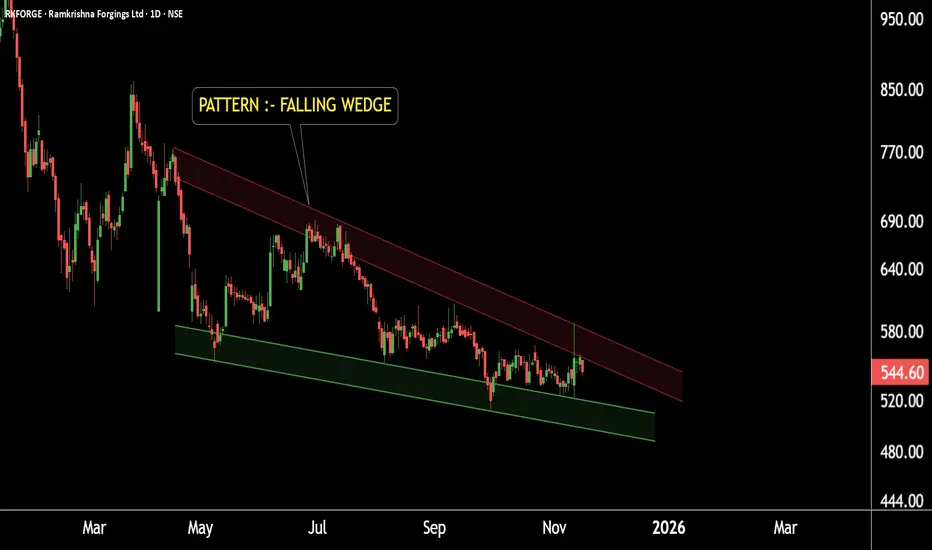
RK Forgings Showing a Clean Reversal Setup — Trend Change Ahead?This is the daily timeframe chart of Ramkrishna Forgings.
The stock is forming a well-defined pattern at a strong support zone near 490–510.
The pattern resistance is placed near 570, and a breakout above this level may open the path for a potential upside target toward the 710+.
If the support zone near 490–510 continues to sustain, we may witness higher prices in Ramkrishna Forgings.
THANK YOU !!
CDSL !! Time to Be Cautious! Bearish Signals Getting StrongerThis is the Daily Timeframe Chart Analysis of CDSL
CDSL is currently forming a Rising Wedge pattern near the key resistance zone of 1680–1700. A breakout above this level with strong volume could lead to an upside target around 1800.
However, if the stock fails to break this resistance and the zone holds, we may witness a downside move. In that case, CDSL could retrace towards the range-bound support area of 1500–1520.
Thank you.

TSLA 3-Drive & ABCD Pattern – Path to $500 Before a PullbackThis chart highlights multiple harmonic and Elliott structures aligning for a potential bullish extension in Tesla (TSLA). A well-defined ABCD pattern and 3-Drive pattern suggest momentum building toward the $500 zone, supported by Fibonacci projections and channel resistance.
The current wave structure points to an imminent 5-wave advance, likely completing the “Drive 3” and pattern D confluence area near $500–505. Following that move, a corrective pullback (ABC) is anticipated, possibly retesting prior support near $440–400.
Key elements featured:
ABCD completion zone: around $500
3-Drive pattern: confirming exhaustion at upper trendline
Elliott 5-wave projection: short-term bullish continuation
Possible corrective phase: after the final wave up
📈 Watching for confirmation of Wave iii and potential exhaustion signals near $500 before considering downside setups.

S&P500 | Mild CrashRisk assets looking to sell off as the stock market tops out around $6,800.
Current price action is only pulling back to test sellers again and we should see a continuation in selling until mid November and hopefully to see a Christmas rally to end the year off.
Since price action awfully looks similar to '24 - '25 Fractal we could say the SPX will look to top next year February/March also considering we're on correction 4 in the Elliott Wave Theory.
Would like to see the S&P bottom out around April - July months of next year at $5,600 if we can continue the bullish parallel trend.

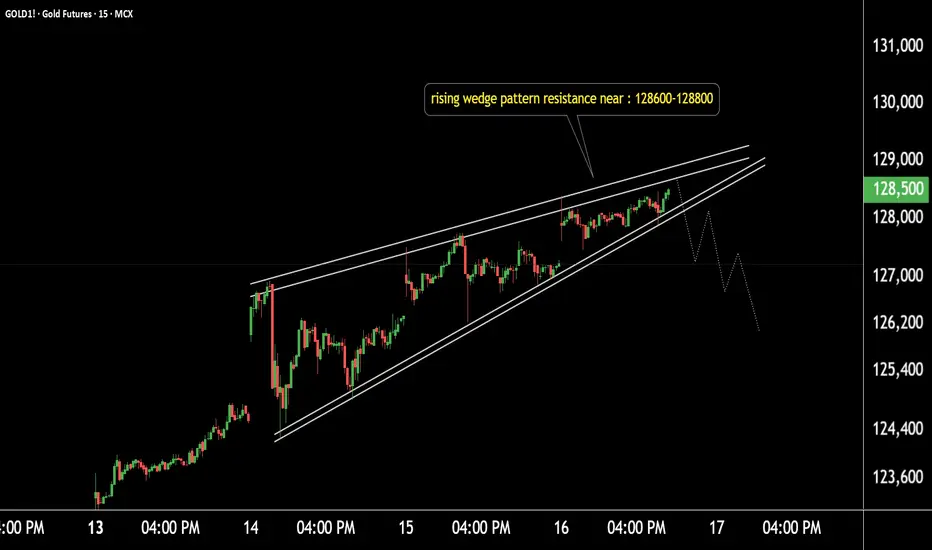
Gold at Risk of Pullback as Rising Wedge Pattern Emerges!Gold Technical Update (15-Min Timeframe)
Gold is forming a Rising Wedge pattern.
Resistance zone: 128600 – 128800.
If the resistance zone holds, selling pressure may increase.
The pattern indicates a potential downside move if price breaks below the lower trendline.
Traders should watch for a breakdown confirmation before taking any fresh positions.
S&P 500: Rising Wedge signals movement before NFP📈 BLUEBERRY:SP500 | Rising Wedge + Non-Farm Payrolls: Which breakout scenario is more likely?
A Rising Wedge pattern is forming on the 30-minute chart of US SPX 500, with price approaching the convergence point of two trendlines. This pattern typically signals weakening bullish momentum but doesn’t rule out a breakout to the upside 🚀.
🔍 Technical Analysis:
• Price is consolidating within a narrowing channel, forming a Rising Wedge 🔺.
• Key support lies between 6717 - 6734 (lower blue zone) 🛡️.
• Target zone on a breakout to the upside is 6767 - 6775 (upper blue zone) 🎯.
• The pattern signals an imminent breakout, but confirmation with a candle close beyond the wedge is needed 🕒.
📊 Non-Farm Payrolls Impact:
• If NFP comes in below expectations, the market may react positively (break up) on hopes of Fed easing monetary policy 💵👍.
• Conversely, a higher-than-expected NFP could increase downside pressure (break down from the wedge) 📉⚠️.
💡 Trade Setup:
• Enter a BUY position once price breaks above 6733 with confirming high volume 🔥.
• Place stop loss below support at 6716 to manage risk 🚧.
• Target area between 6770 - 6775 🎯.
📝 Summary:
The Rising Wedge on SPX 500 points to a breakout soon, with the NFP report acting as a key catalyst. Wait for confirmation and manage your risk carefully ✅.
Please like and comment below to support our traders. Your reactions will motivate us to do more analysis in the future 🙏✨
Harry Andrew @ ZuperView

What’s a Wedge Pattern?What's up traders! 👋
Wedge patterns are a powerful tool in technical analysis that can give you a heads-up about potential price moves. Whether you’re spotting a falling wedge or a rising wedge, these formations can reveal key signals about market direction.
What’s a Wedge Pattern?
A wedge pattern forms when price moves between two converging trendlines, creating a shape resembling a triangle. These patterns usually appear when the market is slowing down or consolidating before making a bigger move. Wedges can slope upwards or downwards, and the key difference lies in whether the trendlines are converging in an uptrend (rising wedge) or a downtrend (falling wedge).
Falling Wedge Pattern: Bullish Reversal 📈
The falling wedge pattern is a bullish reversal signal. This formation occurs when price moves between two downward-sloping trendlines, creating a series of lower highs and lower lows. The downward momentum weakens as the trendlines converge, indicating that sellers are losing strength, which sets up the potential for a bullish breakout.
How to Trade the Falling Wedge
Entry: Wait for the price to break above the upper trendline. This is your signal to enter long.
Target: Measure the height of the wedge at its widest point and project it upwards from the breakout point.
Stop Loss: Place it just below the most recent swing low to protect your position if the breakout doesn’t happen.
The chart illustrates a falling wedge pattern on the Bitcoin / Tether US pair with a 1-hour timeframe. Price action is contained within two converging downward-sloping trendlines, suggesting weakening bearish momentum. The breakout above the upper trendline signals a bullish reversal, and the subsequent uptick in price confirms the shift in momentum.
In rare cases, a breakout failure can lead to a bearish falling wedge pattern, but this scenario is less common. Keep an eye on the price action for signs of continued upward momentum.
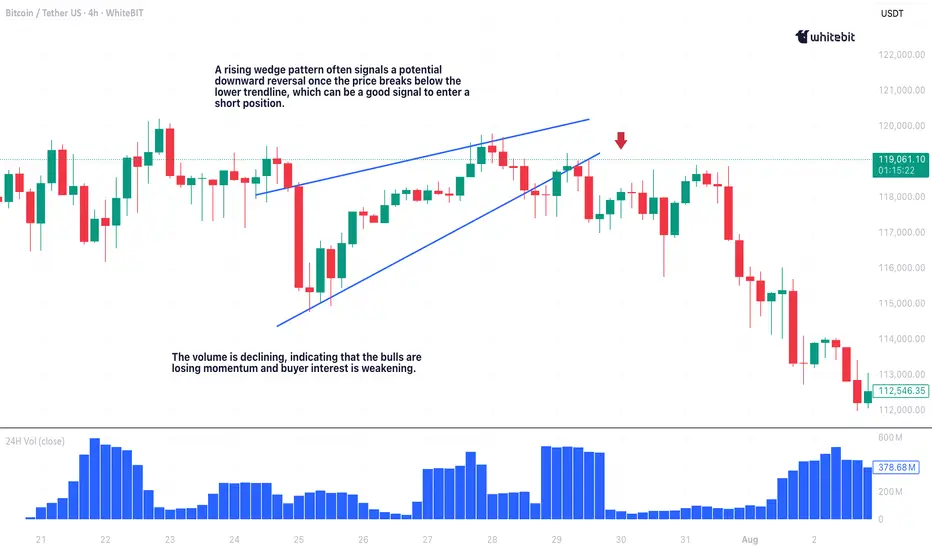
Rising Wedge Pattern: Bearish Reversal 📉
The rising wedge pattern is a bearish reversal signal. This formation happens when price moves between two upward-sloping trendlines, creating higher highs and higher lows. The rising wedge indicates weakening buying pressure and a potential reversal to the downside.
How to Trade the Rising Wedge
Entry: Enter a short position once the price breaks below the lower trendline.
Target: Measure the height of the wedge and project it downward from the breakout point.
Stop Loss: Set it just above the most recent swing high to protect your trade.
Wedge Chart Pattern Trading: Key Tips ⚡
Context is everything when trading wedge patterns. If a bullish wedge pattern appears in an uptrend, it’s more likely to break to the upside. If a bearish wedge shows up in a downtrend, expect a breakdown.
Here are a few quick tips to improve your wedge trading pattern game:
Trendlines are key: Ensure your trendlines are drawn accurately. Properly drawn trendlines lead to better trades.
Breakout confirmation: Confirm breakouts with increased volume and, ideally, by checking for confluence with other indicators like RSI or MACD. A breakout without volume is often a false signal.
Risk management: Always use a stop loss to protect your capital.
Use other indicators: Wedge patterns work well with additional tools such as RSI, moving averages, or MACD. The more confluence, the better!
Final Thoughts 🏁
Wedge patterns, whether it’s the falling wedge pattern signaling a bullish reversal or the rising wedge pattern trading indicating bearish pressure, are some of the most reliable chart formations out there. But remember: no setup is perfect, so always use a stop loss and never rely on a single indicator.
With practice, you’ll get better at spotting these setups and timing your entries and exits like a pro. Happy trading, and may the charts be in your favor! 💰📊
GOLD's Situation, A Comprehensive Analysis ! (XAUUSD)In my opinion, the price will rise to around $4000 and then enter a corrective wave. Currently, the price is forming the third upward wave, which I have estimated using technical analysis. These upward waves will continue up to around $4000, and after this rise, the price could decline toward the PRZ (Potential Reversal Zone). However, this price correction depends on the breakout of the wedge pattern.

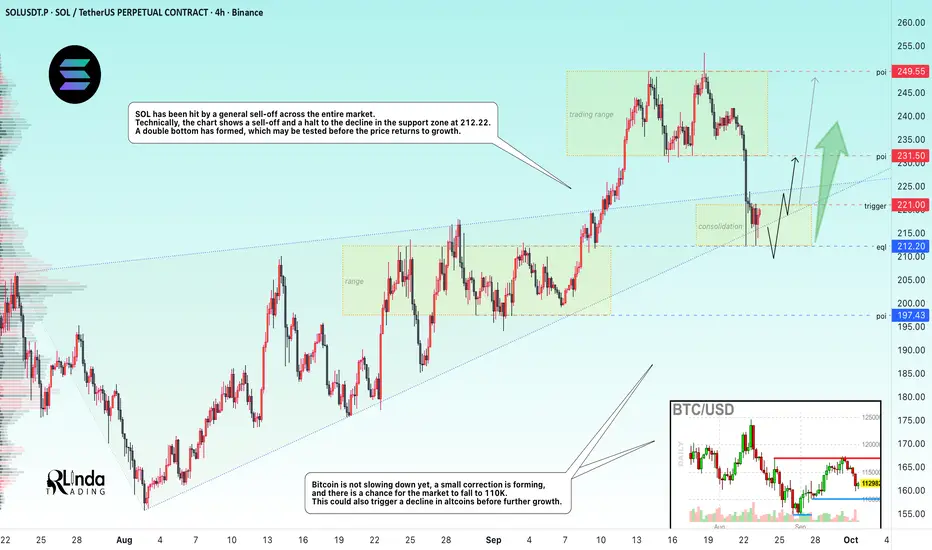
SOLANA → When will the sale end? Bullish trend...BINANCE:SOLUSDT.P is testing the key support zone of 210-215 amid a market decline. However, it is too early to say that the correction is over; additional signs are needed...
Bitcoin is not slowing down yet, a small correction is forming, and there is a chance for the market to fall to 110K. This could also trigger a decline in altcoins before further growth. SOL has been hit by a general sell-off across the entire market. Technically, the chart shows a sell-off and a halt to the decline in the support zone of 212.22. A double bottom has formed, which may be tested before the price returns to growth.
The current consolidation in the range of 212.0 - 221.0, the boundaries of which are of interest to the market, gives hope.
Support levels: 212, 200, 197
Resistance levels: 221, 231.5
A breakout of the local consolidation resistance and a close above 223.5 - 224 could trigger further growth within the bullish trend. Otherwise, MM may test the liquidity and support zone of 212.0 before the coin begins its recovery phase.
Best regards, R. Linda!
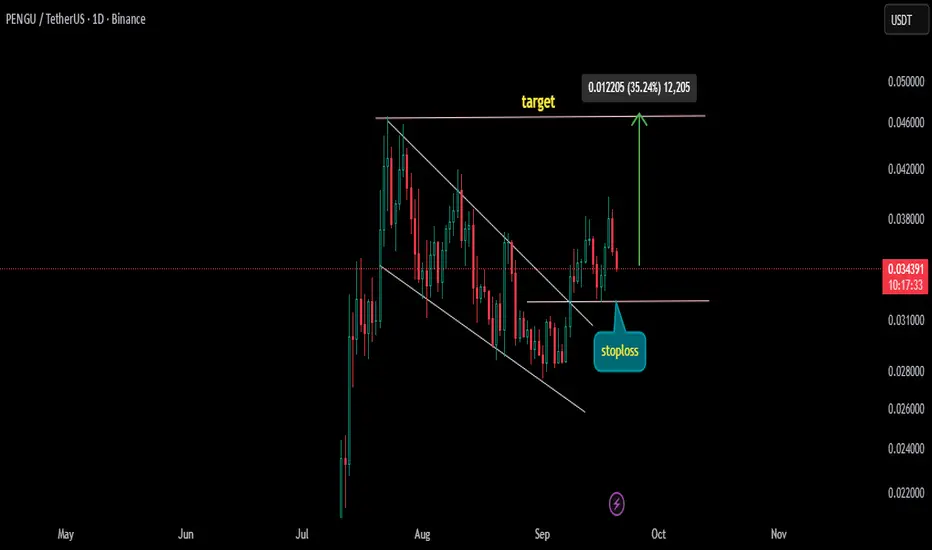
Rising Wedge pattern on PENGUUSDT A Rising Wedge Pattern is triggered on Charts . this chart pattern is considered to be highly profitable by traders on longs, always puts stoploss on neckline of pattern as shows in charts
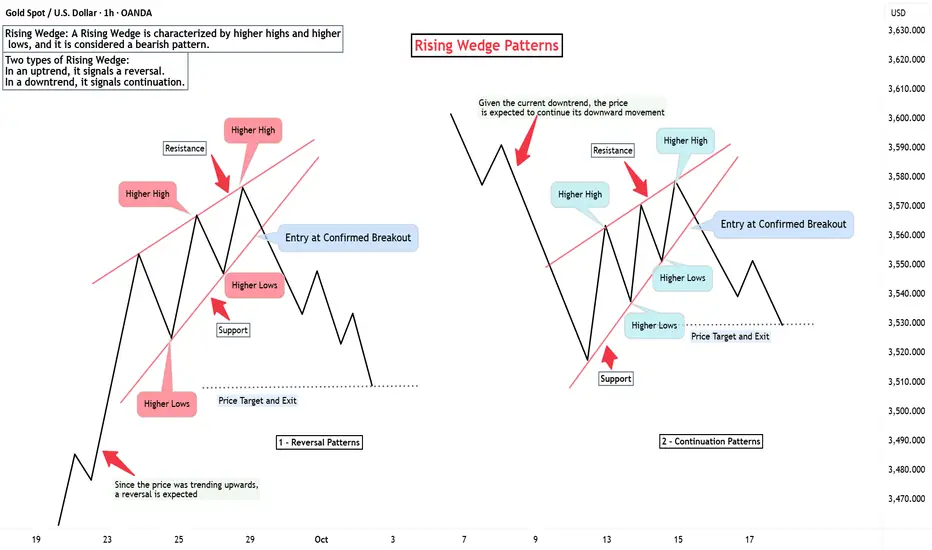
Exploring the Two Variations of the Rising Wedge PatternHello everyone!
When I first started learning technical analysis, one of the patterns I found incredibly interesting and important was the Rising Wedge pattern. This pattern is formed when the price creates higher highs and higher lows, but the price range gradually narrows. However, there’s something that few people know – the Rising Wedge pattern can appear in two different forms, and each form has significant implications for predicting market trends.
Form 1: Rising Wedge in an Uptrend (Reversal)
The first and most common form of the Rising Wedge is when it appears in an uptrend. This pattern signals that the uptrend is losing momentum. When I identify this pattern, I know the market is weakening and is likely to reverse into a downtrend.
Characteristics: The price creates higher highs and higher lows, but the range of price movement narrows, and trading volume typically decreases.
Confirmation: A breakout below the support at the bottom of the Rising Wedge confirms a trend reversal.
When this pattern forms, I prepare to enter a short trade when the price breaks the support at the bottom of the pattern. This is when the market could start to reverse and move downward.
Form 2: Rising Wedge in a Downtrend (Continuation)
The second form of the Rising Wedge appears in a downtrend. Although it may look similar to the first form, its purpose is different. This pattern does not signal a reversal, but instead indicates that the downtrend will continue after the price breaks below the bottom of the pattern.
Characteristics: Similar to the pattern in the uptrend, the price also creates higher highs and higher lows, but the price narrowing occurs within a downtrend.
Confirmation: Once the price breaks below the bottom of the pattern, it is expected to continue the strong downward movement.
In this case, I do not rush to enter a buy trade because this pattern signals that the downtrend is still strong. After the price breaks below the bottom of the pattern, I will consider entering another short trade.
In Summary
The Rising Wedge pattern is an incredibly useful tool for technical analysis to identify changes in price trends. Whether in an uptrend or downtrend, this pattern can provide great trading opportunities if you know how to identify and act on it promptly.
In an uptrend: The Rising Wedge signals weakness and a potential reversal.
In a downtrend: The Rising Wedge signals the continuation of the downward trend.
Understanding these two forms helps me make more accurate trading decisions and manage risk more effectively in any market condition.
GOLD → The uncertainty factor before the news. Down / up?FX:XAUUSD after updating another high to 3578 went into the phase of profit taking before two busy news days. The trend is aggressively bullish, but the risks of correction are quite high due to the uncertainty factor....
The price pulled back from record highs amid profit taking and reduced panic in the bond market. The dollar stabilized, but remains under pressure due to expectations of Fed rate cuts this year. The key event will be the publication of US employment data (NFP) on Friday.
A correction after a sharp rise is a natural reaction, but the expectation of Fed policy easing is supporting the metal's price.
Geopolitics: Trade risks (Trump's tariffs) mitigate gold's fall.
Gold's correction so far looks like a pause before further movement. The main driver is NFP data, which will determine Fed rate sentiment and USD direction. But, today all eyes are on ADP Nonfarm, Initial jobless claims, and ISM data. Unexpected data may intensify the sell-off....
Resistance levels: 3546, 3559, 3563
Support levels: 3526, 3508
It is difficult to determine the news reaction in advance, we will have to orient ourselves after the fact. Technically, I expect a deeper correction for a healthy market. I expect a retest of the 3560 zone and further decline to local liquidity zones.
Regards R. Linda!

AUDUSDRising Wedge with Bearish Divergence found AUDSUD chart which looks like bearish, expected entry point and stop loss mention with TP.

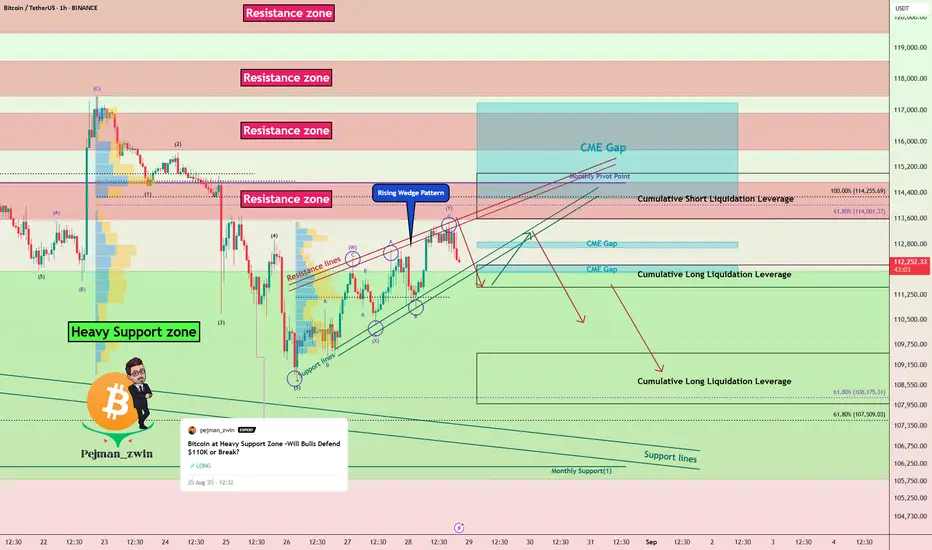
Bitcoin at Make-or-Break: Will BTC Fill the CME Gap?Bitcoin ( BINANCE:BTCUSDT ) increased to $113,500 as I expected in my previous idea .
Do you think Bitcoin can fill the upper CME Gap($117,235-$113,800) !?
Bitcoin is currently moving near the Resistance zone($114,720-$113,580) , Cumulative Short Liquidation Leverage($115,000-$113,588) , Resistance lines , and Monthly Pivot Point .
In terms of Elliott Wave theory , Bitcoin’s movement over the past 2 days has been in the form of corrective waves and has had low momentum . The corrective wave structure is a Double Three Correction(WXY) .
From a Classic Technical Analysis perspective, Bitcoin appears to be completing a Rising Wedge pattern .
I expect Bitcoin to move towards Cumulative Long Liquidation Leverage($109,500-$108,000) after volatile movements over the next two days .
CME Gap: $112,870-$112,700
CME Gap: $112,155-$111,940
Stop Loss(SL): $115,510(Worst)
Please respect each other's ideas and express them politely if you agree or disagree.
Bitcoin Analyze (BTCUSDT), 1-hour time frame.
Be sure to follow the updated ideas.
Do not forget to put a Stop loss for your positions (For every position you want to open).
Please follow your strategy and updates; this is just my Idea, and I will gladly see your ideas in this post.
Please do not forget the ✅' like '✅ button 🙏😊 & Share it with your friends; thanks, and Trade safe.
Gold at Resistance ! Next move will decide trend.Daily Chart Update – Gold1!
Gold is currently forming a rising wedge pattern, with resistance near the sell zone of 103550–103700. The metal is also trading within a well-defined ascending parallel channel, where the channel resistance aligns with the first selling level around 10500.
On a percentage basis, after a 5–6% upward move, gold has reached the key levels of 104700–10500. If these resistance levels hold, we may witness a potential decline in prices. Accordingly, positions can be shifted, and selling opportunities may be considered in line with both the pattern formation and the overall market structure.
Conclusion: According to the pattern and overall structure, 103500 is the first selling zone, while further resistance lies at 104700–10500. Sustaining below these levels could open the way for lower prices.

GOLD → Retest 3400. Readiness for a breakthroughFX:XAUUSD is "consolidating" creeping up on resistance, which generally increases the chances of a breakout, but the initial resistance test may end in a pullback. However, there is news ahead that could trigger one of two scenarios...
At the moment, gold is testing $3,400, but is ready for a correction pending new data from the US. However, further decline may be limited for the following reasons: Weak dollar: The probability of a Fed rate cut in September is estimated at 90%. Trump-Fed conflict: Pressure on Fed Chair Lisa Cook undermines confidence in the dollar. Trade wars: New US tariffs (on India) and retaliatory measures (Mexico, Canada against China) increase demand for "safe havens"
What is important: Political uncertainty and soft rhetoric of the Fed continue to play in favor of gold. Any attempts to reduce will be supported by buyers. It is also worth paying attention to the GDP and Initial Jobless Claims, which will be published today at 12:30 GMT.
Resistance levels: 3405, 3420, 3433
Support levels: 3386, 3373, 3369
Technically, the situation is ambiguous and everything depends on the reaction to 3405 and further news. Weakening of the fundamental background may lead to consolidation or correction to 3373 - 3369. However, if traders feel support, then the retest of 3405 may end with a small consolidation around the level and subsequent breakout and growth to the specified targets (I am more inclined to this scenario based on the above situation)
Best regards, R. Linda!
