Silver (XAG/USD) – Rising Wedge Breakdown & Bearish OutlookChart Overview
This is a 1-hour chart of Silver (XAG/USD) from OANDA, showing recent price action forming a rising wedge pattern followed by a bearish breakdown. The price initially rallied within the wedge but failed to sustain gains above the key resistance zone, leading to a strong rejection and downward momentum.
Key Chart Elements & Analysis
1. Rising Wedge Formation (Bearish Pattern)
The market was in an uptrend, forming higher highs and higher lows within a rising wedge pattern.
A rising wedge is a classic bearish reversal pattern, which indicates weakening buying pressure as price consolidates upward.
The price eventually broke below the lower trendline, signaling a shift in momentum from bullish to bearish.
2. Resistance Zone & Rejection
A strong resistance zone was identified around $33.80 - $34.20 USD (highlighted in blue).
Price attempted multiple times to break above this level but faced selling pressure, leading to a sharp reversal.
The final breakout attempt failed, confirming that sellers are in control.
3. Breakdown & Retest of Support
After breaking down from the wedge, the price found temporary support around $33.20 USD, which aligns with a previous consolidation area.
A retest of the broken wedge support turned into resistance, further confirming the bearish bias.
The rejection from this level strengthened the case for a move lower.
4. Next Support Level & Target Projection
The next significant support zone is around $31.95 - $32.00 USD (marked as the "Target" area).
This level coincides with previous price action support, making it a high-probability bearish target.
The breakdown is expected to follow a measured move projection, bringing price toward this level.
Trade Plan & Execution Strategy
📉 Bearish Setup (Short Opportunity)
Ideal Entry: A pullback to the previous support (now resistance) at $33.20 - $33.40 USD could offer an entry for shorts.
Stop-Loss: Above $33.80 USD, just above the resistance zone.
Target Levels:
Primary Target: $32.50 USD
Final Target: $31.95 - $32.00 USD
Confirmation: Look for price rejection or bearish candlestick formations at resistance before entering.
⚠️ Risk Management & Considerations
Bullish Scenario: If price reclaims $33.80 USD, the bearish setup could be invalidated, and a move higher toward $34.50 USD is possible.
Market Conditions: Keep an eye on macroeconomic factors, news events, and USD strength, as they can influence silver prices.
Conclusion: Bearish Outlook with Downside Target 🎯
The rising wedge breakdown signals further downside potential.
A support retest rejection confirms selling pressure.
$31.95 - $32.00 USD remains the main target, aligning with technical projections.
Short positions with proper risk management remain favorable in this setup.
Rising Wedge

What is a Rising Wedge? - Opportunities on GALA and ARWEAVE!What is a rising wedge?
A rising wedge pattern is a bearish chart formation that signals either a potential trend reversal or the continuation of a downtrend. It occurs when the price consolidates within two upward-sloping, converging trendlines, indicating weakening momentum.
Key Characteristics of a Rising Wedge:
1. Higher Highs and Higher Lows – The price moves upward, but the momentum gradually weakens.
2. Converging Trendlines – Both the upper and lower trendlines slope upward while moving closer together, suggesting a loss of strength in the trend.
3. Breakout Direction – The pattern typically breaks below the lower trendline, confirming a bearish reversal.
How to Trade a Rising Wedge:
• Wait for Confirmation – A breakdown below the lower trendline with increased volume confirms the pattern.
• Set a Target – Measure the height of the wedge and project it downward, often aiming for the starting point of the wedge.
• Use a Stop-Loss – Place a stop-loss just above the recent swing high to manage risk.
Rising wedge on GALA and ARWEAVE
There will be some opportunities with the rising wedge pattern on GALA Games and ARWEAVE. With the projected downside move in BTC and ETH, these falling wedges could play out perfectly. The stop-losses are around 5%, so make sure to manage your risk accordingly.
Keep an eye on both setups for possible trade opportunities in the coming hours/days!
Thanks for your support.
- Make sure to follow me so you don't miss out on the next analysis!
- Drop a like and leave a comment!
Lets chat in the comment section. See you there :)

GOLD → Fading out before the news. Possible long-squeezeFX:XAUUSD continues its bullish trend, but locally, the movement is in a very narrow channel (wedge). To form a potential for further movement, the price may form a long-squeeze before or at the time of news...
Fundamentally, gold remains a bullish asset due to the Fed's rate cut forecasts and economic risks associated with Trump's tariff policy. Gold hit a new high on Wednesday after the Fed reiterated plans to cut rates twice this year, raised its inflation forecast and worsened growth and employment estimates.The price is further supported by escalating geopolitical tensions in the Middle East, with Israel announcing the resumption of ground operations in Gaza.
Gold is forming a bull market. Before further growth (before the news) the price may enter the liquidity zone (fvg, 3028, 3024), after which it will continue to grow. Dollar enters local correction before the news, which creates pressure on gold
Resistance levels: 3046, 3051, 3056
Support levels: 3038, 3030, 3024
Price is forming a retest of the wedge support, which increases the chances of a breakdown. If the support fails to hold, the price may go down to the above support before rising further.
But! If gold bounces from 3038 and consolidates above 3044, the growth will continue without a deep pullback
Regards R. Linda!

BTCUSD | Rising Wedge Breakdown – Bearish SetupChart Overview:
This chart represents Bitcoin (BTC/USD) on the 1-hour timeframe and showcases a Rising Wedge pattern. The price action has reached a key resistance level, and a potential breakdown scenario is unfolding.
1️⃣ Pattern Identification: Rising Wedge Formation
A Rising Wedge is a bearish reversal pattern that forms when price moves within two converging upward-sloping trendlines. The narrowing price range indicates a weakening trend, and a breakdown usually leads to a significant price drop.
Upper Trendline (Resistance): Marked in blue, this trendline connects the higher highs.
Lower Trendline (Support): Also in blue, connecting the higher lows.
Breakdown Confirmation: The price has already moved below the wedge support, confirming the bearish bias.
2️⃣ Key Price Levels & Zones
🔹 Resistance Zone (Blue Box)
This strong resistance level has repeatedly rejected the price.
The final rejection led to a breakout failure and potential trend reversal.
🔹 Support Zone (Blue Box)
A strong demand zone, but a breakdown below it triggers a bearish trend.
This level is now acting as potential resistance after the breakdown.
🔹 ATH (All-Time High) – $87,566
This marks the highest price level reached in the given timeframe.
3️⃣ Market Structure Breakdown
🔻 Bearish Momentum & Breakdown
After touching the resistance, BTC failed to sustain upward movement.
A breakout of the wedge's lower trendline confirms a trend reversal.
Price action suggests a lower-high, lower-low structure, indicating a bearish market shift.
📉 Expected Price Movement (Wave Structure)
The breakout retest could result in a small pullback to previous support (now resistance).
After confirmation, price is likely to continue downward in a wave-like structure.
Fibonacci levels or key support zones will act as profit-taking targets.
4️⃣ Trade Setup & Targets
🔻 Short Setup (Bearish Trade Idea)
Entry: On a successful retest of the broken support zone.
Stop-Loss (SL): Above the previous resistance zone for risk management.
Take Profit (TP) Targets:
TP 1: $81,638
TP 2: $77,897
Final Target: $74,990
5️⃣ Summary & Conclusion
📌 BTC/USD has broken out of a Rising Wedge pattern, confirming a bearish trend.
📌 A pullback and retest may occur before further downside continuation.
📌 The chart suggests a short opportunity, targeting lower support zones for potential profit-taking.
📌 Traders should manage risk with a well-placed stop-loss above key resistance.
This setup aligns with technical analysis principles, confirming a high-probability short trade for BTC. 🚀

USDJPY → Resistance retest (wedge) before the Fed meetingFX:USDJPY is forming a correction to trend resistance as part of the dollar index consolidation. An interesting situation is forming which could be a continuation of the downtrend.
Fundamentally, today is an important day. The FED interest rate meeting is ahead. Traders are waiting, the dollar is consolidating at this time. Most likely the rate will remain unchanged, but in this key everyone is interested in Powell's comments on monetary policy and their future actions.
USDJPY at this time is forming a correction to the bearish trend resistance, before the news the currency pair may test the resistance conglomerate: a wedge, 0.79 fibo, or an orderblock located outside the channel
Resistance levels: 150.16, 150.95
Support levels: 148.92
False breakout of the resistance zone can provoke a fall, as well as breakdown of the support of the “wedge” with the subsequent consolidation of the price in the selling zone. The price may test the zone of interest at 147.6, 146.54.
Regards R. Linda!

Silver (XAG/USD) – Rising Wedge Breakdown & Bearish ContinuationTechnical Analysis & Market Outlook
The Silver (XAG/USD) 1-hour chart presents a clear rising wedge formation, a well-recognized bearish reversal pattern. This formation develops when price action creates higher highs and higher lows within a contracting range, signaling a potential exhaustion of bullish momentum.
Currently, Silver has broken below the lower trendline of the wedge, confirming a bearish breakout. This move suggests that the recent uptrend is weakening, and sellers are beginning to take control. A retest of the broken support level as new resistance could provide an ideal entry for a short position.
Key Technical Levels & Trading Plan
1️⃣ Resistance & Supply Zone: 34.00 - 34.20
Price has struggled to break above this region multiple times, confirming strong selling pressure.
The market rejected this level sharply, leading to the current downside movement.
A stop-loss can be placed slightly above this zone to protect against unexpected reversals.
2️⃣ Support Level & Retest Zone: 33.50
Previously, this level acted as a strong support, but the breakdown confirms a shift in market structure.
If price retests this level and faces rejection, it could serve as an optimal entry point for short trades.
3️⃣ Short Entry Confirmation
Traders should look for price rejection from the 33.50 zone before entering a short position.
A bearish candlestick pattern (e.g., bearish engulfing, pin bar, or a lower high formation) would further validate the entry.
4️⃣ Bearish Target: 31.90 - 32.00
The projected downside move aligns with the measured move of the wedge breakdown and previous support zones.
If price maintains bearish momentum, further downside potential exists beyond this target.
5️⃣ Stop-Loss Placement: Above 34.20
Setting a stop-loss above the recent resistance ensures protection against invalidation of the bearish setup.
This placement accounts for potential price spikes or false breakouts.
Trade Execution Strategy:
📌 Entry: Short on a retest of the 33.50 level, ensuring confirmation via price rejection.
📌 Stop-Loss: Above 34.20 to avoid premature stop-outs.
📌 Take-Profit: Targeting the 31.90 - 32.00 zone for an optimal risk-to-reward ratio.
Conclusion & Risk Management:
The breakdown from the rising wedge signals a shift in market sentiment, favoring a bearish move. Traders should remain patient for a retest of broken support to confirm the validity of the trade. Proper risk management with a well-placed stop-loss and a defined target ensures controlled exposure to market fluctuations.
📊 Overall Bias: Bearish 📉
🔍 Key Watch Areas: Retest of 33.50 for Short Confirmation

Probability o Rising WedgeBINANCE:BTCUSDT BTC/USDT is currently "forming a rising wedge pattern" , which could indicate a continuation of the downtrend. Since the last peak at $110,000, Bitcoin has been experiencing a decline.
At the moment, BINANCE:BTCUSDT BTC/USDT is highly volatile, with daily price swings of up to 10%. This volatility increases the likelihood of fake breakouts and rapid reversals, especially due to external factors like news.


GOLD → Long-sqeeze (double bottom) before breakout 2926FX:XAUUSD is forming the maneuver we need regarding the previously mentioned consolidation. False break of support on the background of the rising market, we discussed it with you yesterday. The reaction is the formation of a reversal set-up and bullish momentum
This week the markets are awaiting the JOLTS jobs report (today) and CPI data (Wednesday), which could provide fresh impetus to prices.
Additional pressure comes from expectations of US-Ukraine peace talks, a possible mineral agreement and ongoing trade tensions related to Trump's protectionism. However, a weaker dollar and lower bond yields are supporting gold, limiting its losses
Gold may test yesterday's high and after a slight pullback continue to rise with a target of retesting the 2926 consolidation resistance. The market structure is bullish at the moment and it plays to our advantage....
Resistance levels: 2918, 2926, 2942
Support levels: 2905, 2893.5, 2880
At the moment the price is still in consolidation, but the price is forming a bullish rally due to the collected liquidity in the Asian session. The local pattern “double bottom” is formed (false breakdown of support) and the next target is the resistance of consolidation 2926. Also focus on 2918 - possible retest and pullback to 0.5 fibo before the price will storm 2926.
Regards R. Linda!

GBPAUD → Correction to strong support before continuing growthFX:GBPAUD is forming a range with a consolidation target after breaking the base of the ascending triangle. The pound is correcting due to the dollar
Technically, on the daily timeframe we have a strong bullish structure, the price is trying to accelerate after breaking the trend resistance, but against the background of the dollar correction the pound sterling is also making a small pullback. There are no strong fundamental changes and the general direction may continue.
At the moment the focus is on ob, located in the zone of 2.0285, as well as the liquidity zone, which is located below 2.0285 + weekly low - 2.015, which also hides a huge pool of liquidity that can be tested.
Resistance levels: 2.05088
Support levels: 2.0285, 2.0151
On the background of the uptrend and the correction to the support after the update of the maximum, we can consider the strategy - false breakdown of the support with the purpose of continuation of the growth. Emphasis on 2.0285 - 2.015
Regards R. Linda!

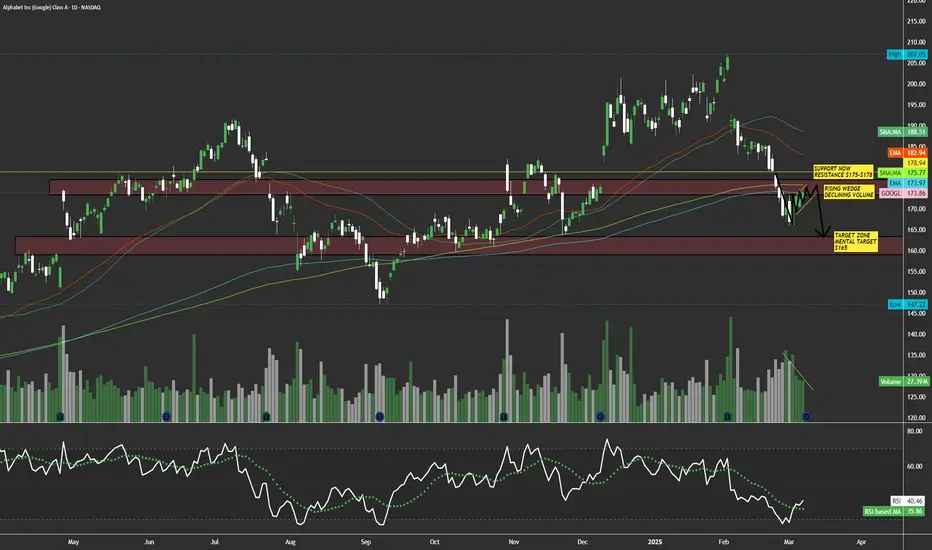
$GOOGL Rising bearish wedge with declining volume; $165 belowNASDAQ:GOOGL here looks weak to me trying to reclaim it's support of $175-$180. This is on my watchlist for a short term short, if this name tanks back into the $150's I will load everything I got for the long side. I see this name in a downside trend currently in a rising wedge with declining volume, buyers can't hold it up much longer. It's retested that support on 3 or more daily candles and hasn't busted through. I expect this name to drop into a support zone of $160-$165. I will look to enter puts off a retest of $176-$178 area keeping the stops tight.
WSL.
GOLD → Consolidation ahead of NFP. What can happen?FX:XAUUSD is heading for resistance after a false breakdown of 2895. The market continues to test 2926 with the aim to break this zone. There is news ahead and the risks of increased volatility are growing.
Markets remain jittery over Trump's tariff plans, which supported gold demand. Trade tensions and mixed U.S. jobs data are adding to inflation risks, which could weaken the dollar. All eyes are on the NFP report.
Based on the analysis of the last few reports, a rough conclusion is that on average in the first 15 minutes, weak data led gold to rise 60 points and strong data led gold to fall 50 points
However, other factors such as inflation and data revisions may dampen the market reaction. The final effect depends on investors' assessment of the Fed's future policy.
Resistance levels: 2926, 2942
Support levels: 2912.5, 2909.5, 2895
Before the news, the price may test 2926 with a false breakout (MM trap for liquidity) and roll back to the nearest support.
But further prospects depend on the news. Gold is in consolidation 2926 - 2895. On the background of possible weak data gold may overcome 2926 and accelerate to ATH. Strong data may provoke profit taking and correction to 2895 - 2875
Regards R. Linda!

Rising Wedge BreakdownNvidia needs to reclaim the bottom of a rising wedge it just lost and failed to reclaim on the last two daily candles.
It did wick back above it with the most recent daily candle but failed to reach the 200 day EMA, and closed below.
There could be further tests, but the most likely scenario here is down towards the two take profit targets shown on the chart.
A halfway point to TP 1 is the dashed grey line, which may also be a stopping point along the way down.

One last push to 130k before it all endsThis is for entertainment purposes only.
Rising wedge with oversold weekly.

GOLD → Retest of risk zone 2880. A pullback is possibleFX:XAUUSD is breaking the local trend and is testing the panic and risk zone of 2880 as part of the correction. A retest of this area will increase the chances of a trend change
Gold is losing growth due to uncertainty of Trump's tariff plans and economic problems in the US. Contradictory statements from the president are supporting the dollar, while rising bond yields are holding back gold prices.
Markets are waiting for US GDP data: if the figures are lower than forecast (2.3%), gold may rise. Fed speeches are also important, but the key will be Trump's statement, which may change the market sentiment
Technically, locally we have a bearish market structure and in this case we expect the decline to continue after a small correction.
Support levels: 2878, 2888
Resistance levels: 2890, 2907
False breakdown of the above support, after such a strong fall, may form a correction. Initially, the price may head towards 0.5 Fibo, after a small pullback we may test 0.7 Fibo. But then we will have to watch the price reaction.
If the gold will go down, the focus will be on 2880.
If the movement will be difficult and the price will start to test the resistance, then in this case, against the background of high risks, we can return to the growth phase.
Regards R. Linda!

EURUSD → Pre-break consolidation against 1.053FX:EURUSD continues to form bullish hints for a possible continuation of growth. There is strong resistance ahead and the market is forming a pre-breakdown consolidation
The dollar continues its correction amid economic data, the country's politics and hints from Trump and Powell of a possible rate cut soon.
The euro is benefiting from the dollar's decline, but how long will it last, especially amid the tariff war between the U.S. and Europe?
Technically, at the moment, the chart indicates a bullish outlook. Within the local uptrend, an ascending triangle is forming, which generally indicates bullish interest in the market. The focus is on the pattern base - resistance at 1.053.
Support levels: 1.045, 1.040
Resistance levels: 1.053
If the dollar continues its downward course, the currency pair has all chances to grow.
A retest of the trend support (false breakout) before the resistance breakout is possible.
Breakout and consolidation of the price above 1.053 may provoke growth.
Regards R. Linda!

GOLD Daily, H4, H1 Forecasts, Technical Analysis & Trading IdeasDaily Timeframe:
TVC:GOLD has been rising rapidly recently but has almost stopped since February 11, when it hit its uptrend channel line.
With the RSI hitting resistance at 77 and showing signs of falling, there is a high probability that a corrective wave is about to begin.
Four-hour Timeframe:
A rising wedge pattern has formed in the price.
As long as the price does not break the resistance at 2955 and the red line of the rising wedge continues upwards, a downward wave is expected to begin.
A strong bearish divergence has also formed in the RSI.
One-hour Timeframe:
A head and shoulders pattern is forming.
If the price can break the neckline downward and the blue trend line of the rising wedge is also broken, the probability of a downward wave will be very high.

GOLD → Bullish structure. Emphasis on 2955FX:XAUUSD is still in consolidation, but the flat is gradually changing into an ascending triangle structure, which further explains the bullish interest in the market.
Gold price is consolidating near the record high of $2,956. Investors took a pause before a possible continuation of gains amid renewed trade war fears over Trump's statements on tariffs and controls on exports of Nvidia chips to China.
Weak risk sentiment and a rising dollar are holding back gold, but lower bond yields and expectations of Fed policy easing are supporting prices.
Gold will remain influenced by tariff negotiations and US consumer confidence data in the coming days
Resistance levels: 2940, 2954.5
Support levels: 2930.7, 2921
Local resistance at 2940 is ahead. If the bulls are able to consolidate above this area, we should wait for the growth and the retest of 2954.5.
2954.5 is a trigger, the breakdown of which will provoke the continuation of the bull rally.
But before that the consolidation between 2954 and 2940 may be formed. I don't exclude the flat support retest before further growth.
Regards R. Linda!

GOLD → Price is in consolidation and getting ready to go to $3KFX:XAUUSD is preparing to continue its growth. Consolidation is forming against strong resistance. The dollar in the correction phase continues to update the lows....
Gold is consolidating near 2945-2955, remaining cautious due to Trump's tariff threats and waiting for US inflation data. Which technically increases the chances of continued gains.
Optimism in the markets is supported by upcoming US-Russia talks on Ukraine, new Chinese measures and the victory of conservatives in Germany.
Weak dollar and expectations of Fed rate cuts support gold, but rising risk appetite reduces its attractiveness
Resistance levels: 2946.5, 2954.5
Support levels: 2935, 2921
Technically, the focus is on 2946.5. If the bulls are able to break this level, the resistance ahead at 2954.5 will not seem so strong. In this case, the price will continue its growth to 2969 - 3K
But, before further growth, as gold is still in consolidation, the price may test the liquidity zone 2935 - 2921.
Regards R. Linda!

GBP/USD - Fair Value Gap (FVG) Short SetupOverview:
A bearish reversal setup based on Fair Value Gaps (FVGs), a concept used in Smart Money trading strategies.
Key Technical Insights:
🔹 Fair Value Gap (FVG) Zones:
The price is approaching an FVG entry zone around 1.2700, which may act as resistance.
A second FVG zone is located around 1.2850 - 1.2900, offering a secondary entry for shorts.
🔹 Bearish Trade Setup:
The plan anticipates a reaction at the first FVG zone, leading to a downside move.
If price continues higher, the second FVG zone provides another opportunity to enter shorts.
🔹 Stop Loss & Target:
Stop Loss: Placed above 1.2928 to protect against invalidation.
Target: 1.2350 - 1.2400, aligning with previous demand zones and imbalance filling.
Trade Plan:
📌 Entry Strategy:
Watch for bearish confirmation (e.g., rejection candles, lower time frame structure shift) at the FVG entry zone.
If price moves beyond the first FVG, consider a second entry at 1.2850 - 1.2900.
📌 Exit Strategy:
Take Profit: At the 1.2350 - 1.2400 target zone for a favorable risk-to-reward trade.
Stop Loss: Above 1.2928 to mitigate risk.
Final Thoughts:
✅ Bearish bias unless price breaks above 1.2928.
✅ Look for rejection at FVG zones for ideal entries.
✅ Potential downside move towards 1.2350 target.
📉 Patience is key—wait for confirmation before entering! 🚀

Rising Wedge Pattern For SWFTCoin.... Hidden Ascending Triangle!The rising wedge is a chart pattern used to identify possible reversals.
The pattern appears as an upward-sloping price channel featuring two converging trend lines.
It's usually accompanied by falling trading volume.
Wedges can either form in the rising or falling direction.
A rising wedge is often considered a bearish chart pattern, meaning it indicates a breakout to the downside.
Be careful of a shakeout-fake-out.
It appears as though an Ascending Triangle is hiding in the shadows.
It is very common for whales to accumulate at the bottom of these patterns..
glta

GOLD → Realization of consolidation and retest of resistanceFX:XAUUSD is testing a rather important resistance, a break and consolidation above which will open the way to 2721 - 2726. Technically, gold has entered the buying zone, and the fundamental background supports it
Gold was supported by weak US inflation data, dollar correction and adjusted expectations of Fed rate cuts, as well as hopes for stimulus in China.
Traders' attention shifts to December retail sales and jobless claims in the US. These data will help clarify the Fed's monetary policy outlook. Weakened dollar and lower bond yields support the current growth of gold.
Technically, all eyes are currently on the uptrend and resistance at 2697.8
Resistance levels: 2697.8, 2700
Support levels: 2690, 2678
If gold can consolidate above 2697-2700 and the bulls hold the defense above this zone, we should expect growth in the short and medium term. But do not forget about the news that will be published later.
Regards R. Linda!

XRP: Is the $3.00 Breakout the Start of a New Rally!?XRP Token ( BINANCE:XRPUSDT ) , backed by Ripple , a pioneer in international financial transfers, this token has once again captured the market's attention. Is this growth sustainable or just a temporary surge?
Let's take a closer look.
Fundamental Analysis :
1- Legal Advancements(Recent Court Victories) : Ripple has achieved successes in its legal battles against the U.S. Securities and Exchange Commission (SEC), reducing legal uncertainties surrounding XRP and boosting investor confidence.
2- Strategic Partnerships(Collaborations with Major Financial Institutions) : Ripple has initiated partnerships with banks and financial institutions worldwide, especially in Europe and Asia, aiding in the broader adoption of XRP.
3- Increased Utility(Speed and Efficiency in Transactions) : Given its high speed and low transaction fees, XRP is being considered a suitable option for international transfers.
4- Institutional Investment(Approval of Exchange-Traded Funds (ETFs)) : The approval of ETFs related to XRP could lead to increased demand and, consequently, a rise in its price.
5- Leadership Changes(Changes in SEC Leadership) : With Gary Gensler stepping down as SEC Chair and the potential appointment of more crypto-friendly leaders, regulatory pressures on XRP are expected to decrease, potentially aiding its growth.
-----------------------------------------------------------
Now, let's take a look at the Technical Analysis of XRP .
XRP is trying to break the Resistance zone($2.92-$2.68) . However, the $3.00 Resistance level(Round Number) is preventing XRP from continuing to rise.
Of course, with the large volume of the candle breaking the Resistance zone , we can hope for an increase in XRP .
Regarding Classic technical analysis , the Rising Wedge Pattern has failed and will act as a continuation Pattern when a reversal pattern fails. ==>> Educational Tip
According to the theory of Elliot waves , it seems that XRP has succeeded in completing the main wave 3 and we should wait for the main wave 4 . It looks like the main wave 4 can end around $2.85 or $2.74 ( near the upper line of the failed wedge pattern ).
Looking at the chart of XRPBTC ( BINANCE:XRPBTC ) in the weekly time frame , we can see that it seems that XRPBTC has succeeded in breaking the Resistance lines and is currently trying to break the Resistance zone , and if this zone breaks , we can see a further increase in XRP compared to Bitcoin(if the crypto market is bullish ) and vice versa if the crypto market is bearish , we can hope that XRP will experience a smaller decline than Bitcoin.
Based on the explanation above, I expect XRP to rise to at least a Potential Reversal Zone(PRZ) after the pullback is completed .
Note: If XRP returns below the Resistance zone($2.92-$2.68) again, we can expect a further decline of XRP.
XRP Analyze (XRPUSDT), 4-hour time frame⏰.
🔔Be sure to follow the updated ideas.🔔
Do not forget to put Stop loss for your positions (For every position you want to open).
Please follow your strategy and updates; this is just my Idea, and I will gladly see your ideas in this post.
Please do not forget the ✅' like '✅ button 🙏😊 & Share it with your friends; thanks, and Trade safe.
