EURAUD H1 | Institutional Level Rejection → Sell After LiquidityBias: Bearish
EURAUD has been in a strong bearish trend, printing consecutive Break of Structure (BOS) levels to the downside. Price has now formed a rising wedge / bear flag on the 1H and is currently sitting at a key institutional level — a zone where large players are expected to step in and sell. A liquidity sweep above the wedge is anticipated before price breaks down and continues lower.
Technical Confluence
Price is currently at an institutional supply level — high probability sell z
Risingwedgepattern
CESC Set to Ignite: Key Levels Triggering a Bull MoveThis is the daily and 4-hour timeframe chart of CESC.
The stock is moving within a well-defined parallel channel, with a support zone in the 160–163 range.
The Supertrend indicator is positive and suggests an additional support zone around 165–167.
CESC is forming a rising wedge pattern, and after the breakout, the stock has retested the pattern’s resistance, which may now act as support near the 165–167 zone.
If this support zone holds, we may see higher prices in CESC.
Thank you.
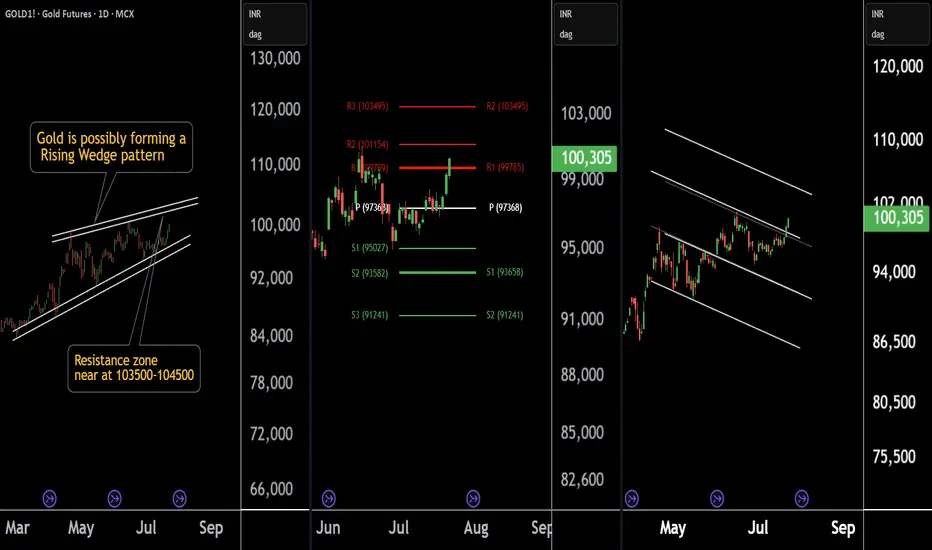
Gold at a Crossroad: Long or Short? Key Levels in FocusThere are three chart of Gold .
Gold1! is forming a Rising Wedge pattern, with resistance positioned between 103500-104000 levels.
Gold1! is facing Pivot Point resistance around the 103500 level, indicating potential supply pressure.
Gold1! is approaching the parallel channel resistance, and the upside move is nearly complete in percentage terms, with resistance around 103800-104000.
if this level sustain then we may see first of all higher prices then again fall in gold1!
Thank You !!
Dice Egypt to be monitored for a new entry - Good opportunity!Daily chart, the stock EGX:DSCW broke the lower trend-line of the rising wedge pattern. So, technically this bearish movement should test the pattern target 2.15
However, there are near relatively strong support cushion at 2.45 - 2.42, then a support level at 2.24
A new entry (buy) can be made after 2 days close above 2.51 with high volume, to target 2.75 to 2.80 (then 3.05)
Stop loss below 2.40 should be considered.
Mastering the Rising Wedge Pattern in Forex: Your Path to Profit
Are you ready to unlock the secrets of the rising wedge pattern in the thrilling world of forex trading? 🚀 In this comprehensive guide, we'll dive into the intricacies of trading this powerful chart pattern and show you how to harness its potential for profitable gains. 📊💰
Understanding the Rising Wedge Pattern 📈
The rising wedge pattern is a technical analysis formation that signals a potential reversal in the prevailing trend. Visually, it resembles a narrowing price range between two c
SPX 500 Analysis(Rising Wedge Pattern)!SPX 500 Analysis on Weekly Timeframe!
Rising Wedge Pattern in SPX500
Rising Wedge Pattern Formation after a Strong Downtrend
SPX500 was in downtrend before now we are seeing a temporary uptrend but if we observe carefully it is an unstructured uptrend, for trend reversal it has to break 4323.56 level. Now SPX500 has formed a Rising Wedge Pattern. This pattern formation happened after a long down move. Now SPX500 is taking a pause and trading inside a wedge. If SPX500 able to break Support
📈How to Trade: Rising Wedge Pattern📌 What is the Rising Wedge Pattern?
The rising wedge is a bearish chart pattern found at the end of an upward trend in financial markets. It suggests a potential reversal in the trend. It is the opposite of the bullish falling wedge pattern that occurs at the end of a downtrend. Traders recognize the rising wedge as a consolidation phase after a medium to long-term trend, indicating a decrease in momentum. Traders often use this pattern as a signal to take a short-selling position or exit their
Very low volume on HT token. Between 9 and 10$ topI'm bearish on HT. Justin Sun is actually hated in Chinese media for pumping and dumping his own coins. He probably bought cheap and will also dump on you. The volume profile is showing incredible low volume. It will top around 9 and 10$. I shorted 1x with tight stop loss.
HShort
PTBA in Retest ⚠️⚠️⚠️PTBA . Daily TF. Rising wedge pattern. Has broke the trendline support and go to the retest area (support that become resistance). Be carefull. It might do down if it rejected. Or if it enter the wedge area again and breakout the wedge, it is become bullish and cancel the bearish.
Two shapes of Rising Wedge PatternsI have explained about Rising Wedge Patterns on this Tutorial in detail.
Rising Wedges are bearish pattern and it generates bearish signal; Rising Wedge Patterns forms with Higher Highs and Higher Lows.
Rising Wedge pattern basically forms in two shapes ; If rising wedge pattern forms in an uptrend it will make reversal and if rising wedge pattern forms in a downtrend it will make continuation.
The higher highs and the lower lows along makes a trend resistance and trend support. When breakout