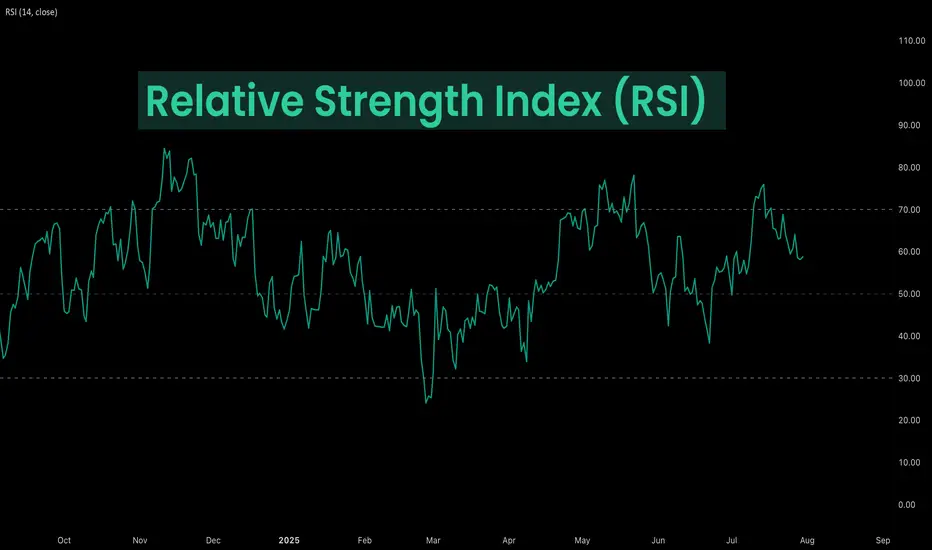
Deep Dive Into Relative Strength Index (RSI)The Relative Strength Index (RSI) is a momentum oscillator developed by J. Welles Wilder Jr. that measures the speed and magnitude of price changes.
Introduction
In the world of trading, timing is everything — and few indicators have stood the test of time like the Relative Strength Index (RSI). Introduced by J. Welles Wilder in 1978, the RSI is a momentum oscillator that helps traders evaluate the strength and speed of price movements. Whether you're trading stocks, forex, or crypto, understanding how RSI is calculated and how to interpret its signals can give you a critical edge.
In this article, we’ll break down exactly how the RSI works, explore its formula, and dive into practical ways you can incorporate it into your trading strategies. From spotting potential reversals to identifying overbought and oversold conditions, the RSI remains a cornerstone of technical analysis — but only if you know how to use it properly.
Let’s explore the mechanics and the mindset behind this powerful indicator.
What Is RSI and How Is It Calculated?
The Relative Strength Index (RSI) is a momentum oscillator that measures the speed and change of price movements over a defined period. It outputs a value between 0 and 100, which helps traders determine whether an asset is overbought or oversold.
The default RSI setting uses a 14-period lookback window and is calculated with the following steps:
🔷Calculate the average gain and loss over the last 14 periods:
Average Gain = Sum of all gains over the past 14 periods / 14
Average Loss = Sum of all losses over the past 14 periods / 14
🔷Compute the Relative Strength (RS):
RS = Average Gain / Average Loss
🔷Apply the RSI formula:
RSI=100−(100/(1+RS))
The result is a single number between 0 and 100 that indicates the asset's momentum.
How to Use RSI in Trading Strategies
⚡️Overbought and Oversold Conditions Strategy
RSI > 70 typically signals that an asset may be overbought and due for a pullback.
RSI < 30 suggests the asset might be oversold, potentially primed for a bounce.
However, these levels aren’t absolute sell or buy signals. In strong trends, RSI can stay overbought or oversold for extended periods.
📈Long Trading Strategy Example:
1. Identify the major trend, to find the long trades it shall be uptrend. On the screen below you can see 1D time frame for BITMART:BTCUSDT.P .
2. Move to lower time frame (in our case 4h) and find the moment when RSI falls below 30. This is our oversold condition and we are going to look for long trade.
3. Find the local support zone and open long trade.
4. Take profit when price reaches resistance level next to the previous swing high
5. Don’t forget to put initial stop loss when enter position. The best stop loss which will give you 3:1 risk to reward ratio.
📉Short Trading Strategy Example
1. Identify the major trend, to find the short trades it shall be downtrend. On the screen below you can see 1D time frame for BITMART:ETHUSDT.P .
2. Move to lower time frame (in our case 4h) and find the moment when RSI grows above 70. This is our overbought condition and we are going to look for short trade.
3. Find the local resistance zone and open short trade.
4. Take profit when price reaches support level next to the previous swing low
5. Don’t forget to put initial stop loss when enter position. The best stop loss which will give you 3:1 risk to reward ratio.
⚡️RSI Breakout Strategy
RSI is breaking through 60 indicating bullish momentum shift if the long-term trend is bullish can be the potential long signal
RSI is breaking down 40 indicating bearish momentum shift if the long-term trend is bearish can be the potential short signal
This strategy works great only on the trending market, don’t use it on the range bounded market to avoid whiplashes.
📈Long trading strategy example:
1. Make sure that long-term trend is bullish. Use 200 period EMA as its approximation. If price remains above it we can look for potential long trade setup.
2. If RSI crossed above the level 60 open long trade.
3. Put the initial stop-loss under the signal candle’s low.
4. Take profit when price reached 3:1 risk-to-reward ratio.
📉Short trading strategy example
1. Make sure that long-term trend is bearish. Use 200 period EMA as it’s approximation. If price remains below it we can look for potential short trade setup.
2. If RSI crossed below the level 40 open short trade.
3. Put the initial stop-loss above the signal candle’s high.
4. Take profit when price reached 3:1 risk-to-reward ratio. In our case we received very fast and profitable trade
⚡️RSI Divergence Strategy
RSI can be used also as a trend reversal indicator if we are looking for divergences. This is very reliable sign of current trend weakness and great opportunity open trade against the trend. Usually it’s not recommended, but in case if divergence can be applicable.
Bullish divergence is the situation when price created the lower low, while RSI made the lower low. Usually, it indicates that current downtrend is weakening and we can look for long trades
Bearish divergence is the situation when price created the higher high, while RSI made the lower high. Usually, it indicates that current uptrend is weakening and we can look for short trades
😎Important hint: it’s rarely covered in textbooks about technical analysis, but in our opinion it’s better to used divergences when RSI was able to cross level 50 between two lows/highs.
📈Long trading strategy example
1. Find at the chart situation, when the price made the lower low
2. At the same time RSI shall set the higher low
3. RSI shall break level 50 between these lows indicating shift to the bullish momentum
4. If price failed to set the clean breakdown open long trade on the candle which set the lower low. Put stop loss under it’s low
5. Take profit at 3:1 RR. When you master this concept, you will be able to have much more RR trades, even 10:1. This is possible because when trend finish you have the highest potential upside
📉Short trading strategy example
1. Find at the chart situation, when the price made the higher high
2. At the same time RSI shall set the lower high
3. RSI shall break level 50 between these highs indicating shift to the bearish momentum
4. If price failed to set the clean breakout open short trade on the candle which set the higher high. Put stop loss above it’s high
5. Take profit at 3:1 RR. When you master this concept, you will be able to have much more RR trades, even 10:1. This is possible because when trend finish you have the highest potential upside
Conclusion
The Relative Strength Index (RSI) remains one of the most powerful and flexible tools in a trader’s technical arsenal — but its real value lies in how you use it.
We’ve explored three key RSI strategies:
✅ Overbought/Oversold setups offer simple entry signals in ranging markets, where price tends to revert to the mean.
✅ Breakout strategies unlock RSI’s momentum-tracking potential, helping you ride strong directional moves with confidence.
✅ Divergence detection reveals hidden shifts in market sentiment, giving you an early warning of possible reversals or trend continuations.
Each approach has its strengths — and its risks — but together, they offer a complete framework for using RSI across different market conditions
🔑 Key Takeaways:
RSI is not just a “buy low, sell high” tool — it’s a multi-dimensional indicator that adapts to trends, momentum, and market structure.
The best RSI signals come from confluence: combining RSI with price action, support/resistance, volume, or trend filters like moving averages.
Patience and discipline are essential — RSI signals are only effective when paired with proper risk management and confirmation.
By mastering RSI beyond the basics, you'll be better equipped to make timely, confident, and informed trading decisions — whether you're entering a pullback, chasing a breakout, or spotting the early signs of reversal.
Rsidivergence
HA-RSI + Stochastic Ribbon: The Hidden Gem for Trend & MomentumNavigating volatile markets requires more than just raw price action. The Heikin Ashi RSI Oscillator blends the power of smoothed candlesticks with momentum insights to give traders a clearer picture of trend strength and reversals.
At Xuantify , we use the Heikin Ashi RSI Oscillator as a hybrid momentum and trend tool. While the indicator calculations are based on Heikin Ashi values to smooth out noise and better capture trend dynamics, the chart itself displays standard candlesticks (real price data) . This ensures that all signals are aligned with actual market structure, making it easier to execute trades with confidence and clarity.
This dual-layer approach gives us the best of both worlds: clarity from smoothing and precision from real price action. MEXC:SOLUSDT.P
🧠 How We Use It at Xuantify
At Xuantify , we integrate the Heikin Ashi RSI Oscillator into our multi-layered strategy framework. It acts as a trend confirmation filter and a momentum divergence detector , helping us avoid false breakouts and time entries with greater precision. We pair it with volume and volatility metrics to validate signals and reduce noise. Note the Stochastic Ribbon Overlay as shown in the chart, very accurate for momentum.
⭐ Key Features
Heikin Ashi Smoothing : Filters out market noise for clearer trend visualization.
RSI-Based Oscillation : Measures momentum shifts with precision.
Color-Coded Bars : Instantly identify bullish/bearish momentum.
Dynamic Signal Zones : Customizable overbought/oversold thresholds.
Stochastic Ribbon Overlay : A powerful multi-line stochastic system that enhances momentum analysis and trend continuation signals.
💡 Benefits Compared to Other Indicators
Less Whipsaw : Heikin Ashi smoothing reduces false signals common in traditional RSI.
Dual Insight : Combines trend and momentum in one visual.
Better Divergence Detection : Easier to spot hidden and regular divergences.
Visual Simplicity : Clean, intuitive design for faster decision-making.
⚙️ Settings That Matter
RSI Length : Default is 14, but we often test 10 or 21 for different timeframes.
Smoothing Type : EMA vs. SMA – EMA reacts faster, SMA is smoother.
Overbought/Oversold Levels : 70/30 is standard, but 80/20 can reduce noise in trending markets.
📊 Enhancing Signal Accuracy
Combine with Volume Oscillators to confirm momentum strength.
Use Price Action Zones to validate oscillator signals.
Look for Divergences between price and oscillator for early reversal clues.
🧩 Best Combinations with This Indicator
MACD : For cross-confirmation of momentum shifts.
Bollinger Bands : To identify volatility squeezes and breakouts.
Support/Resistance Levels : For contextual trade entries and exits.
⚠️ What to Watch Out For
Lag in Strong Trends : Like all smoothed indicators, it may react slightly late.
Over-Optimization : Avoid curve-fitting settings to past data.
Standalone Use : Best used in conjunction with other tools, not in isolation.
🚀 Final Thoughts
The Heikin Ashi RSI Oscillator is a powerful hybrid tool that simplifies complex market behavior into actionable insights. At Xuantify, it’s a core part of our strategy toolkit, helping us stay ahead of the curve with clarity and confidence.
🔔 Follow us for more educational insights and strategy breakdowns!
We regularly share deep dives into indicators, trading psychology, and backtested strategies. Stay tuned and level up your trading game with us!

RSI 101: Revealing the Special Characteristics of RSIWhy does RSI have support and resistance levels at 40 and 60?
Why does divergence happen between RSI and price?
What is RSI momentum?
All the characteristics of RSI (that I know) will be explained here.
Formula and Meaning
If you are using TradingView, you probably already know what RSI is and what "overbought" and "oversold" mean. So, I won’t repeat it here. Instead, I’ll dive deeper into the true nature of RSI, giving you a different perspective.
You can skip the mathematical formula of RSI, it’s already discussed everywhere online. Just remember this ratio table:
Here’s how I explain the table:
At RSI = 50, the average gain equals the average loss (I'll call this the buy/sell ratio). This is a balanced point. Buyers and sellers are equally strong.
At RSI ~ 60 (66.66), the buy/sell ratio = 2/1. Buyers are twice as strong as sellers.
At RSI ~ 40 (33.33), the buy/sell ratio = 1/2. Sellers are twice as strong as buyers.
At RSI = 80, the buy/sell ratio = 4/1. Buyers are four times stronger.
At RSI = 20, the buy/sell ratio = 1/4. Sellers are four times stronger.
The formula shows that when RSI reaches 80 or 20, the buyer or seller is extremely strong — about four times stronger — confirming a clear trend.
At these levels, some Trading strategies suggest placing a Sell or Buy based on the overbought/oversold idea.
But for me, that’s not the best way. The right approach is: when a trend is clearly formed, we should follow it.
I'll explain why right below.
Look at this chart showing RSI changes with the buy/sell ratio:
When RSI > 50:
When RSI < 50:
You can see that the higher RSI goes, the slower it climbs, but the high buy/sell ratio makes price move up faster.
Similarly, when RSI goes lower, it drops slower but price drops faster.
That’s why at overbought (RSI=80) or oversold (RSI=20) areas, you need to be careful. Even a small RSI moving can lead to big price changes, easily hitting your stop loss.
On the other hand, if you follow the trend and wait for RSI to pull back, you will trade safer and more profitably.
RSI Key Levels
Here are some special RSI levels I personally find useful when observing FX:XAUUSD :
(These levels are relative. They might vary with different timeframes or trading pairs. Check historical data to find the right ones for you. On bigger timeframes like M15 or above, the accuracy is better.)
RSI = 20
When RSI hits 20, sellers dominate. This confirms a trend reversal to bearish.
RSI = 80
When RSI hits 80, buyers dominate. This confirms a trend reversal to bullish.
RSI = 40
This is a sensitive level. Sellers start gaining the upper hand (sell/buy = 2/1).
If buyers lose 40, they lose their advantage.
So RSI >= 40 is "buyer territory". In an uptrend, RSI usually stays above 40.
RSI = 40 acts as support in an uptrend.
RSI = 60
Same idea. RSI <= 60 is "seller territory".
RSI = 60 acts as resistance in a downtrend.
40 and 60 are considered the key levels of RSI.
Now you guys know why RSI has support/resistance around 40/60!
RSI Range
As you know, RSI moves between 0 and 100.
Since RSI >= 40 is buyer territory, we can see the relationship between price and RSI:
When RSI stays above 40, price tends to move in an uptrend:
When RSI stays below 60, price tends to move in a downtrend:
When RSI stays between 40 and 60, buyers and sellers are balanced, and price moves sideways in a box:
When RSI is moving, It creates a RSI Range.
Whenever the trend switches between the three states — uptrend, sideways, and downtrend — a Range Shift is formed.
At first, RSI moves in 40-60 range, price moves sideways. A strong price move pushes RSI to 80. Later, RSI stays above 50, helping price grow strongly. When momentum fades, RSI returns to 40-60 and price moves sideways again.
Note:
RSI reflects Dow Theory by showing the stages of accumulation, growth, and distribution.
And as you see, when RSI touches key levels, the trend often pulls it back.
RSI Momentum
Price momentum means how fast price changes.RSI momentum represents the change in the strength between buying and selling forces.
When RSI > 50:
If price falls, RSI shows high momentum — RSI drops fast but price drops slowly.
If price rises, RSI shows low momentum — RSI rises slowly but price rises fast.
For example, at first RSI is above 50.
Price drops from (a) to (b) by 44 units, RSI drops from (Ra) to (Rb) by 25 units.
Later, RSI drops from (Rb) to (Rc) (also 25 units) but price drops from (b) to (c) by 73 units.
When RSI < 50:
If price falls, RSI has low momentum — RSI drops slowly but price falls fast.
If price rises, RSI has high momentum — RSI rises fast but price rises slowly.
RSI and Price Divergence
Divergence happens when price and RSI move in opposite directions:
Price goes up but RSI goes down, or vice versa.
Why does divergence happen?
In a strong downtrend, price forms a bottom at point (1), and RSI drops to level (r1).
When a price pullback happens, price pushes up to a peak at point (2), and RSI also bounces back to level (r2).
Because the downtrend is strong, after completing the pullback (1-2), price continues to make a lower bottom at point (3).
At this point, remember the behavior of RSI momentum when RSI is below 50:
It takes a large price drop (from 2 to 3) to cause a small RSI drop (from r2 to r3).
Meanwhile, even a small price increase (from 1 to 2) causes a large RSI rise (from r1 to r2).
Since the distance (1-2) is smaller than (2-3), but the RSI move (r1-r2) is bigger than (r2-r3), divergence is created.
Divergence shows that the current trend is very strong, not a complete signal of a trend reversal.
(I might share with you how to spot a complete RSI reversal signal in future posts.)
As shown in the example above, after forming bottom (5) and creating a bullish divergence between (3-5) and (r3-r5), price still kept dropping sharply while RSI kept rising.
In these areas, if you keep trying to catch a reversal just based on divergence, you will likely need to DCA or cut your losses many times.
That’s why the most important thing in trading is always to follow the trend.
RSI Exhaustion
RSI Exhaustion happens when RSI keeps getting rejected by a resistance or support zone and can’t break through.
After a strong downtrend, RSI recovers but stalls around the 5x zone.
It tries many times but fails, showing buying power is weakening.
Then the downtrend continues:
Exhaustion near high or low RSI levels creates stronger divergences than exhaustion in the middle range:
Double or triple tops/bottoms on RSI (M or W shapes) basically indicate RSI exhaustion.
RSI Can Identify Trend Strength
In an uptrend:
If RSI pulls back to a higher level before going up again, the trend is stronger.
The pullback should not fall too deep (below 40).
Example:
First rally: RSI drops to 60 before rising again → strong rally (273 units).
Second rally: RSI drops to 50 before rising again → weaker rally (94 units).
Same idea for a downtrend:
If RSI pullbacks to 50 then drops again, the downtrend is stronger than if it pullbacks to 60.
RSI Support and Resistance
Besides 40-60 acting as support/resistance, RSI also reacts to old tops and bottoms it created.
Why does this happen?
RSI is calculated from closing prices.
On a higher timeframe, the candle close price is a high/low or support/resistance price on lower timeframes.
When RSI moves in a trend on a higher timeframe, it maintains a buy/sell ratio, forcing lower timeframe RSI to oscillate within a range.
Example:
On H4, RSI stays above 40 → uptrend.
It makes H1 RSI move between 30-80.
Sharp RSI tops/bottoms react even stronger because they show strong buying/selling forces.
Summary
When looking at the price chart, we can see that price can rise or fall freely without any defined boundaries.
However, RSI operates differently: it always moves within a fixed range from 0 to 100.
During its movement, RSI forms specific patterns that reflect the behavior of price.
Because RSI has a clear boundary, identifying its characteristics and rules becomes easier compared to analyzing pure price action.
By studying RSI patterns, we can make better assumptions and predict future price trends with higher accuracy.
I have shared with you the core characteristics of RSI, summarized as follows:
Besides overbought (80) and oversold (20), RSI respects 40 and 60.
40 is support level in an uptrend. 60 is resistance level in a downtrend.
In an uptrend, RSI stays above 40.
In a downtrend, RSI stays below 60.
An RSI Range-Shift leads to a trend change.
RSI Divergence shows strong trends.
Double or triple tops/bottoms show RSI exhaustion → potential reversals.
The higher the RSI level, the slower it moves, but the faster the price rises.
The lower the RSI level, the slower it moves, but the faster the price falls.
A strong uptrend can be identified when RSI moves within a higher range or shows continuous bearish divergences.
A strong downtrend can be identified when RSI moves within a lower range or shows continuous bullish divergences.
RSI reacts to its old tops and bottoms.
Sharper RSI peaks show stronger selling.
Sharper RSI bottoms show stronger buying.
In the next parts, I’ll show you how to apply these RSI's Characteristics to trend analysis, multi-timeframe analysis, and trading strategies, that you might have never seen before.
I trade purely with RSI. Follow me for deep dives into RSI-based technical analysis and discussions!

RSI 101: Scalping Strategy with RSI DivergenceFX:XAUUSD
I'm an intraday trader, so I use the H1 timeframe to identify the main trend and the M5 timeframe for entry confirmation.
How to Determine the Trend
To determine the trend on a specific timeframe, I rely on one or more of the following factors:
1. Market Structure
We can determine the trend by analyzing price structure:
Uptrend: Identified when the market consistently forms higher highs and higher lows. This means price reaches new highs in successive cycles.
Downtrend: Identified when the market consistently forms lower highs and lower lows. Price gradually declines over time.
2. Moving Average
I typically use the EMA200 as the moving average to determine the trend. If price stays above the EMA200 and the EMA200 is sloping upwards, it's considered an uptrend. Conversely, if price is below the EMA200 and it’s sloping downwards, it signals a downtrend.
3. RSI
I'm almost use RSI in my trading system. RSI can also indicate the phase of the market:
If RSI in the 40–80 range, it's considered an uptrend.
If RSI in 20 -60 range, it's considered a downtrend.
In addition, the WMA45 of the RSI gives us additional trend confirmation:
Uptrend: WMA45 slopes upward or remains above the 50 level.
Downtrend: WMA45 slopes downward or stays below the 50 level.
Trading Strategy
With this RSI divergence trading strategy, we first identify the trend on the H1 timeframe:
Here, we can see that the H1 timeframe shows clear signs of a new uptrend:
Price is above the EMA200.
RSI is above 50.
WMA45 of RSI is sloping upward.
To confirm entries, move to the M5 timeframe and look for bullish RSI divergence, which aligns with the higher timeframe (H1) trend.
RSI Divergence, in case you're unfamiliar, happens when:
Price forms a higher high while RSI forms a lower high, or
Price forms a lower low while RSI forms a higher low.
RSI divergence is more reliable when the higher timeframe trend remains intact (as per the methods above), indicating that it’s only a pullback in the bigger trend, and we’re expecting the smaller timeframe to reverse back in line with the main trend.
Stop-loss:
Set your stop-loss 20–30 pips beyond the M5 swing high/low.
Or if H1 ends its uptrend and reverses.
Take-profit:
At a minimum 1R (risk:reward).
Or when M5 ends its trend.
You can take partial profits to optimize your gains:
Take partial profit at 1R.
Another part when M5 ends its trend.
The final part when H1 ends its trend.
My trading system is entirely based on RSI, feel free to follow me for technical analysis and discussions using RSI.

Reversal Trading Strategy Using GOLDEN RSI Divergence Indicator Overview
Reversal trading strategies capitalize on identifying turning points in the market where a potential reversal from a downtrend to an uptrend, or vice versa, occurs. In this post, I will introduce a strategy based on divergence patterns spotted with a custom RSI (Relative Strength Index) indicator.
This method enhances traditional RSI analysis by making divergence detection clearer and actionable. By combining it with a strong understanding of price action, traders can gain an edge in timing market reversals effectively.
Key Features of This Strategy
Divergence Analysis: The core of this strategy is to identify bullish or bearish divergences between the RSI and price action.
Custom RSI Indicator: The custom RSI indicator simplifies divergence detection by highlighting critical levels and marking divergence points directly on the chart.
Confluence with Price Action: Reversals are validated using trendlines, support/resistance zones, and candlestick patterns.
Chart Example: S&P 500 Index
In the attached chart:
Bullish Divergence:
The price made lower lows, while the RSI made higher lows (indicated by green arrows).
This divergence signaled weakening bearish momentum and potential reversal.
Entry Point:
A clear breakout above the trendline validated the reversal.
Enter long positions near this breakout level.
Stop Loss:
Place the stop loss just below the recent swing low.
Target Profit:
Aim for the next major resistance zone or use a fixed risk-reward ratio (e.g., 1:2 or 1:3).
How to Spot Divergence
Bullish Divergence:
Price forms lower lows.
RSI forms higher lows.
This indicates waning bearish pressure and a potential upward reversal.
Bearish Divergence:
Price forms higher highs.
RSI forms lower highs.
This suggests weakening bullish pressure and a possible downward reversal.
Why This Strategy Works
Strength of RSI Divergence
RSI divergence reflects the loss of momentum in the current trend. By detecting it early, traders can position themselves ahead of major reversals.
Combining Confluence Factors
The success rate of this strategy increases when RSI divergence aligns with other technical factors like:
Horizontal support or resistance levels.
Trendline breaks.
Volume spikes.
Practical Tips for Using This Strategy
Use Multiple Timeframes: Confirm divergence signals on higher timeframes for stronger setups.
Avoid Overtrading: Only act on clear and validated divergence setups to minimize false signals.
Risk Management: Never risk more than 1-2% of your trading capital on a single trade.
Conclusion
This custom RSI-based divergence strategy is a powerful tool to identify high-probability reversal setups. When combined with proper risk management and confluence analysis, it can significantly improve trading outcomes.
Start experimenting with this strategy on your demo account and refine your approach before deploying it in live markets. If you have questions or want to discuss this further, feel free to comment below!

How to Read the RSI Indicator: The Market's Lie DetectorAttention TradingViewers, market gurus, and Instagram influencers, this one indicator goes hard whenever it’s onto something. Let's talk about the RSI — the Relative Strength Index . This bad boy is like the lie detector test of the market, calling out overhyped moves and under-the-radar opportunities.
What’s RSI All About?
The RSI is a momentum-based oscillator that captures the speed and change of price movements. It operates on a scale of 0 to 100, and if you know how to read it, it’s like having X-ray vision into the market’s moods. The best part? It’s super easy to use — slap it on any chart, any time frame and let it do its thing.
The Numbers
Above 70 : Overbought alert! If the RSI shows a reading above 70, the trading instrument may have been partying a little too hard. Anywhere above 70 means that it’s flashing “overbought” – like a sugar rush that’s about to crash. Traders who follow the RSI usually interpret this as a signal to sell and move out of the asset before the line reverses course and dives back under the high-water mark. Sometimes, however, the price keeps climbing well above 70.
Below 30 : Now we’re in “oversold” territory – it’s like spotting a hidden gem in a bargain bin. When RSI drops below 30, the market’s saying, “This thing’s been beaten down, but maybe – just maybe – it’s time for a comeback.” Keep in mind that sometimes the dip may keep dipping.
How It’s Calculated
RSI is all about relative strength — it compares the magnitude of recent gains to recent losses. Picture a tug-of-war between bulls and bears. The RSI score tells you who’s winning the battle right now, but also hints at who might be running out of strength.
Trading with RSI
Overbought? Maybe Sell (obligatory DYOR) . When RSI hits 70 and above, you might be looking at a market running out of fuel. You may start thinking about trimming your position, or at least keep an eye out for a reversal. After all, what goes up must come down (except maybe Bitcoin BTC/USD ?)
Oversold? Maybe Buy (obligatory DYOR) . If the RSI drops to 30 and below, it could be a signal to start looking for a buying opportunity. The market is going through a meltdown and sometimes that’s your cue to go bargain hunting and snap up some discounted assets. Just make sure that your stock or crypto of choice isn’t falling for a specific reason — no indicator can save you from an actual rug pull.
The Sweet Spot — Divergences: Ever notice when the RSI and price action don’t agree? That’s called a divergence, and it’s like catching the market in a lie. If the price is making new highs but the RSI isn’t, or vice versa, it’s a clue that something fishy’s going on and you may want to be on the lookout for a sur- price reversal.
Bonus Tip: RSI in Different Timeframes
Wanna get fancy and earn some bragging rights? Use RSI across different timeframes. A stock might be oversold on the daily but overbought on the weekly. By spotting the trend across different time frames, you can pick your desired time frame to trade in and follow closely. The higher the time frame, the longer the time horizon for the move to actually pan out.
So, there you have it – the RSI. It’s not a crystal ball, but it’s pretty close.
Use it wisely, and you might just outsmart the market — or at least stay ahead of the next big move. Keep those charts hot, continue learning about technical analysis and go smash those trading goals of yours. 🔥

Elliott Wave DemonstrationDemonstration of Elliott Wave Principles using Bitcoin chart:
Rules:
Wave 2 never goes below end of Wave 1 => checked
Wave 3 is not the shortest of Wave 1, 3 and 5 => checked
Wave 4 never goes below end of Wave 1 => checked
Guidelines:
Guideline of Alternation: Wave 2 and 4 alternates in form (sharp vs sideways), retracement (shallow vs deep) and duration (long vs short) => checked
Guideline of Wave Equality: Two out of three waves (1,3 and 5) tend to be equal in length and duration, Wave 1 and 5 meeting this guideline => checked
Momentum is highest during end of wave 3, end of Wave 5 normally creates divergence with price => checked
Volume during Wave 3 is normally the highest amongst Wave 1,3 and 5
Relations with Fib ratios:
Wave 2 retraced Wave 1 by 78.6% (deep)
Wave 3 was equal to 261.8% of Wave 1 (longest)
Wave 4 retraced Wave 3 by 38.2% (shallow)
Wave 5 was equal to 100% of Wave 1 (Guideline of Wave equality)

Mastering the 70/30 RSI Trading Strategy - Plus Divergences!Mastering the 70/30 RSI Trading Strategy: A Comprehensive Guide
The 70/30 RSI technique stands out as a popular and effective method for making informed decisions in the financial markets. Leveraging the Relative Strength Index (RSI) indicator, this strategy empowers traders to navigate the complexities of buying and selling various financial instruments, from stocks to currencies. In this article, we delve into the intricacies of the 70/30 RSI trading strategy, exploring its fundamentals and practical application in forex trading.
Understanding the 70/30 RSI Trading Strategy:
Developed by renowned technical analyst J. Welles Wilder, the RSI indicator serves as a powerful tool for evaluating market strength and identifying overbought and oversold conditions. With a range from 0 to 100, the RSI provides traders with crucial insights into market dynamics, enabling them to make timely trading decisions.
At the heart of the 70/30 RSI strategy lies the establishment of two key threshold levels on the RSI indicator: 70 for overbought conditions and 30 for oversold conditions. These thresholds serve as crucial markers for generating buy or sell signals, offering traders valuable guidance in navigating market trends.
⭐️ Adding and Setting Up the RSI Indicator on Your Chart:
The RSI (Relative Strength Index) Indicator is a freely available tool accessible within your TradingView Platform, irrespective of your subscription plan. Whether you're using a Free membership or one of the Premium plans, you can easily find and add this indicator to your charts. Below, I'll guide you through the process of adding and customizing the RSI indicator on your platform with the help of the following images.
To begin adding the RSI indicator to your chart:👇
You can also customize the colors to your preference, just like I did by selecting your favorite ones.👇
Now, let's delve into what the RSI indicator is and how to interpret it.
Interpreting RSI Signals:
In essence, an RSI reading of 30 or lower signals an oversold market, suggesting that the prevailing downtrend may be ripe for reversal, presenting an opportunity to buy. Conversely, a reading of 70 or higher indicates overbought conditions, implying that the ongoing uptrend may be nearing exhaustion, presenting an opportunity to sell.
The Relative Strength Index (RSI) Explained:
As a momentum indicator, the RSI measures the speed and magnitude of recent price changes, providing traders with insights into whether a security is overvalued or undervalued. Displayed as an oscillator on a scale of zero to 100, the RSI not only identifies overbought and oversold conditions but also highlights potential trend reversals or corrective pullbacks in a security's price.
Practical Application of the RSI Strategy:
Traders employing the 70/30 RSI strategy must exercise caution, as sudden and sharp price movements can lead to false signals. While RSI readings of 70 or above indicate overbought conditions and readings of 30 or less indicate oversold conditions, traders must consider additional factors and use other technical indicators to validate signals and avoid premature trades.
Let's examine a few examples.
Example No. 1: EUR/USD Daily Timeframe
On the EUR/USD daily timeframe, we observed an overbought condition indicated by the RSI rising above the 70 level. This signaled a potential reversal in price direction. Subsequently, the price indeed reversed, confirming the overbought scenario.
It's crucial to emphasize that while scenarios above the 70 RSI level or below the 30 RSI level suggest potential reversals in price, it's essential to complement your analysis with additional filters. These may include consideration of the economic environment, effective risk management strategies, and identification of triggers or patterns before initiating a trade. Below, I'll illustrate a potential trigger that aligns with the RSI 70/30 strategy: the crossover of the RSI line with the RSI-based moving average (MA).
Example No. 2:
In this example, the RSI strategy proved effective as we observed the price falling below the 30 level, indicating potential oversold conditions and a forthcoming reversal from the market's potential bottom. Additionally, in the image below, you'll notice the introduction of white lines, known as "divergences." I'll provide a clearer explanation of divergences in the next example.
Example No. 3:
In this example, denoted as circle N.3, we encounter another instance of the RSI reaching the 70 level, indicating an overbought condition. Once again, the strategy proves effective, but this time, we notice a shallower reversal compared to the previous two examples.
Following this reversal, the price experiences growth, presenting a new opportunity for traders with a subsequent higher high. However, unlike before, this high does not breach the 70 RSI level, resulting in a deeper reversal.
This scenario exemplifies a "divergence."
But what exactly is divergence trading?
Divergence trading revolves around the concept of higher highs and lower lows.
When the price achieves higher highs, you would expect the oscillator (in this case, the RSI) to also record higher highs. Conversely, if the price makes lower lows, you anticipate the oscillator to follow suit, registering lower lows as well.
When they fail to synchronize, with the price and the oscillator moving in opposite directions, divergence occurs, hence the term "divergence trading."
I'm confident that the previous three examples were well explained to help you understand the 70/30 RSI strategy, along with the MA moving average trigger and the relative divergence strategy. Please share your thoughts in the comment section below.
Key Considerations and Limitations:
While the 70/30 RSI strategy offers valuable insights into market dynamics, traders must remain mindful of its limitations. True reversal signals can be rare and challenging to identify, necessitating a comprehensive approach that incorporates other technical indicators and aligns with the long-term trend.
In Conclusion:
The 70/30 RSI trading strategy represents a powerful framework for navigating the complexities of the financial markets. By leveraging the insights provided by the RSI indicator, traders can make well-informed decisions, identify lucrative trading opportunities, and optimize their trading strategies for success in various market conditions.

Decoding RSI during bull market, the Constance Brown way!RSI, as conventionally understood, does not oscillate between 70-30.
This idea explains the RSI behaviour during bull market phase.
Stay tuned for similar idea explaining RSI behaviour during bear market phase.

Interpreting RSI (Relative Strength Index)The Relative Strength Index (RSI) is a momentum indicator that measures the speed and magnitude of price movements. It is a versatile tool that can be used to identify overbought and oversold conditions, as well as divergences and trend strength.
Overbought and Oversold Conditions
The RSI oscillates between 0 and 100. Traditionally, the RSI is considered overbought when above 70 and oversold when below 30. These levels are not set in stone, and they can vary depending on the security and the market conditions. However, they are a good starting point for identifying potential buying and selling opportunities.
Overbought:
An RSI reading above 70 indicates that the security is overbought, which means that it has been trading up rapidly and may be due for a correction. However, it is important to note that the RSI can stay in overbought territory for an extended period of time before a correction occurs.
Overbought RSI indicator
ETHUSD(Day Chart)
As you can see in the chart, when the RSI indicator hit the 70 level, the price started dropping continuously.
Oversold:
An RSI reading below 30 indicates that the security is oversold, which means that it has been trading down rapidly and may be due for a bounce. However, like with overbought conditions, the RSI can stay in oversold territory for an extended period of time before a bounce occurs.
Oversold RSI indicator
BTCUSD (weekly Chart)
As you can see in the chart, when the RSI indicator hit the 30 level, the price started bouncing from the bottom level.
The RSI indicator has accurately predicted the bottoms of Bitcoin's major bear markets in 2015, 2018, and 2022.
Stay tuned for more updates on this topic.
Regards
Hexa

Battle-tested through the ups and downs of Etherium historyA trading strategy that's been battle-tested through the ups and downs of Eth's history. This strategy doesn't blink in the face of market chaos or get swayed by emotions. It's a calculated game plan that knows when to step in and when to step back.
Compare that to emotional investing, where fear and greed call the shots. Imagine making decisions when you're on an emotional rollercoaster—buying high in excitement and selling low in panic. That's a recipe for disaster.
A backtested risk-managed strategy, though, is like a cool-headed coach that sticks to the game plan no matter what. It's about discipline, rules, and consistency. So, do you want to ride the emotional wave or play the long game with a strategy that has been consistently profitable year on year since 2016 (start of Eth - substantiated by backtest data).
Average annual net profit (substantiated by the backtest)
196% (No Leverage) & 661% (3x leverage)
This year (Jan 2023 to Sep/15th/2023) has already generated
45.21% (no leverage) 144.93% (3x leverage) in net profit.
This strategy does Not re-paint, No-look ahead bias. and 100% forward tested. Tradingview has a default caution for strategies that use the multitimeframes data. This does not apply to this strategy as all calculations are based on closed bars.
So how does it work?
Postions are entered based on RSI Divergence on Higher Timeframes and confirmed by the ATR.
Stop Loss and Trailing ATR-based Take Profit:The strategy incorporates a risk management mechanism with a built-in stop loss set at 8%. Additionally, it employs a trailing take profit mechanism based on ATR. This means that as the trade moves in the desired direction, the take profit level adjusts itself based on the current volatility, allowing for gains to be secured as the trend progresses.
SMI-based Re-entry after Stop-out:
Stochastic Momentum Index (SMI) is used as a re-entry signal if the trade is stopped out (i.e., the stop loss is triggered). This re-entry is contingent on higher timeframes and ATR still supporting the original trend, indicating that the initial stop-out may have been a false signal.
Portfolio Reinvestment for Compound Growth:
The strategy allocates 95% of the portfolio's capital to each trade.
This approach maximizes the potential for compound growth, as a significant portion of the available capital is reinvested in each trade, provided that risk management rules are satisfied. This approach is appropriate for this strategy as strict risk management is applied and the winrate is almost 50%
Accounting for Exchange Fees:
Exchange fees, set at 0.1%, are factored into the strategy's calculations.
This ensures that trading decisions take into account the cost of executing trades on the exchange.
Avoiding Lookahead Bias and Repainting:
The strategy is designed to prevent lookahead bias by making calculations based only on closed bars of price data. Lookahead bias occurs when future data is used to make past trading decisions, potentially leading to unrealistic expectations.

DIVERGENCE CHEATSHEETHello dear traders and investors community!
The Divergence Cheat Sheet
Divergence occurs when the price of an asset and an indicator, such as the Relative Strength Index (RSI), move in opposite directions. This pattern provides valuable insights into potential price reversals or changes in trends.
Detecting Divergence
Detecting divergence is crucial for identifying lucrative trading opportunities. By using divergence indicators like the RSI, MACD, or Stochastic Oscillator, we can gain significant insights into market trends and potential price reversals.
To pinpoint divergence effectively, follow these steps:
Choose an indicator capable of detecting divergence, such as the RSI, MACD, or Stochastic Oscillator.
Look for discrepancies between the indicator and the price action. Regular divergence occurs when the price and the indicator move in opposite directions, while hidden divergence occurs when they move in the same direction but at different rates.
Monitor the direction of the trend. Divergence can indicate a trend reversal, so keeping track of the current market trend is crucial.
Confirm the divergence signal with other technical analysis tools. Divergence is just one piece of the puzzle, so it's essential to use other indicators to validate your trading decisions.
Examples of Divergence in Trading Charts
Let's examine a few examples of divergence on Bitcoin charts:
Strong Bullish Divergence:
When lows of the price decreases while the RSI increases, a regular bullish divergence occurs. This signals a potential trend reversal and presents an opportunity for a bullish trade.
Strong Bearish Divergence:
When highs the price of an asset is rising while the RSI is falling, it indicates a regular bearish divergence. This suggests a potential trend reversal and presents an opportunity for a bearish trade.
Medium Bullish Divergence:
When the lows of an asset remain equal while the RSI is rising, it indicates a medium bullish divergence. This suggests a potential increase in price, although it may not be a strong upward movement.
Medium Bearish Divergence:
When the highs of an asset remain unchanged while the RSI is decreasing, it indicates a medium bearish divergence. This suggests a potential decline in price, although the downward movement may not be significant.
Weak Bullish Divergence:
When the lows of an asset is decreasing while the RSI lows is equal, it indicates a weak bullish divergence. This suggests a potential increase in price, although it may not be a strong upward movement.
Weak Bearish Divergence:
When the highs of an asset are rising while the RSI remains unchanged, it indicates a moderate bearish divergence. This suggests a potential decline in price, although the downward movement may not be significant.
Hidden Bullish Divergence:
Hidden bullish divergence occurs when the price creates higher lows while the RSI is creating lower lows. This reinforces an existing uptrend and suggests its strength.
Hidden Bearish Divergence:
Hidden bearish divergence is observed when the price forms lower highs while the RSI forms higher highs. This indicates a potential weakening of the current uptrend and might signal a trend reversal or a pullback.
By recognizing these divergence patterns on trading charts, we can gain insights into potential market reversals, entry and exit points, and adjust trading strategies accordingly.
To effectively incorporate divergence into your trading, consider the following steps:
Identify the appropriate indicators: Choose reliable indicators such as RSI, MACD, or Stochastic Oscillator that can detect divergence patterns effectively.
Learn to spot divergence: Familiarize yourself with the different types of divergence patterns and practice identifying them on price charts. This will help you develop a trained eye for spotting potential trading opportunities.
Confirm with additional analysis: While divergence can provide valuable signals, it's essential to use other technical analysis tools to confirm your trading decisions. Look for supporting indicators, chart patterns, or trendline breaks that align with the divergence signal.
Set clear entry and exit criteria: Define your entry and exit points based on the divergence signal and your risk tolerance. Consider using stop-loss orders and take-profit levels to manage your trades effectively.
Practice risk management: Implement proper risk management techniques, such as position sizing, to protect your capital. Divergence alone should not be the sole basis for your trading decisions but rather an additional tool in your arsenal.
Backtest and refine your strategy: Test your divergence-based trading strategy on historical price data to assess its effectiveness. Make adjustments as needed and continuously monitor and evaluate your results to improve your trading approach.
Remember, divergence analysis is not foolproof and should be used in conjunction with other technical analysis methods and market factors.
Divergence analysis is a powerful tool that can provide us with an edge in the cryptocurrency market. By understanding and effectively utilizing divergence patterns, we can identify potential trend reversals, improve entry and exit timing, and enhance overall trading strategy. Incorporate divergence analysis into your trading approach and combine it with other technical indicators and risk management techniques for a well-rounded and informed trading strategy.

📊 3 Types Of DivergenceRSI (Relative Strength Index) is a commonly used technical indicator in trading that helps identify overbought and oversold conditions in the market. It measures the strength and speed of price movements and provides traders with valuable insights into potential trend reversals. When analyzing RSI, three types of divergences can be observed: regular, hidden, and exaggerated divergences.
📍Regular Divergence: Regular divergence occurs when the price and the RSI indicator move in opposite directions. There are two types of regular divergences: bullish and bearish.
📍Hidden Divergence: Hidden divergence refers to a situation where the price and the RSI move in the same direction, but the RSI signals a potential trend continuation rather than a reversal.
📍Exaggerated Divergence: Exaggerated divergence is a type of divergence where the RSI signal extends beyond the typical overbought or oversold levels. It suggests that the price is showing extreme momentum and could potentially experience a significant reversal.
In summary, regular, hidden, and exaggerated divergences in RSI analysis provide traders with valuable insights into potential trend reversals and continuations. By understanding these divergences, traders can make more informed decisions regarding their trading strategies and positions in the market.
👤 @AlgoBuddy
📅 Daily Ideas about market update, psychology & indicators
❤️ If you appreciate our work, please like, comment and follow ❤️

RSI in detail and how to effectively use itWhat is RSI?
RSI stands for Relative Strength Index; The RSI measures the strength of asset's price action by comparing the magnitude of its recent gains to the magnitude of its recent losses.
The RSI is calculated using the average gain and average loss over a specified period, typically 14. The formula for the RSI is:
RSI = 100 - (100 / (1 + RS))
where RS = Average Gain / Average Loss.
To calculate the average gain, add up the gains over the specified period and divide by the number of periods.
Average Gain = Sum of Gains over N periods / N
To calculate the average loss, add up the losses over the specified period and divide by the number of periods.
Average Loss = Sum of Losses over N periods / N
In simple terms : To determine the average gain/loss for the closing price of the asset for each period in the selected time.
Calculate the difference between the closing price of the current period and the closing price of the previous period. If the current closing price is higher than the previous closing price, the difference is considered a gain. If the current closing price is lower than the previous closing price, the difference is considered a loss. Then calculate the average loss by summing up all the losses over the specified time period and dividing them by the number of periods in the timeframe.
What does RSI tell you?
To understand RSI we must understand the term Relative Strength which refers to the ratio of the average gain to the average loss over a specified period. It is used to compare the strength of the stock or asset price gains to its price losses over a certain timeperiod.
For example, let's say we want to calculate the relative strength of a stock over the past 14 trading days. We first need to calculate the average gain and average loss over that period. Suppose the average gain is USD 2 per share, and the average loss is USD 1 per share.
To calculate the Relative Strength (RS), we divide the average gain by the average loss:
RS = Average Gain / Average Loss
= USD2 /USD 1
= 2
RS value greater than 1 indicates that the stock has experienced more gains than losses over the specified time period. In this case, the RS value of 2 indicates that the stock has had twice as many gains as losses over the past 14 trading days. The higher value of relative strength indicates Buyers have been relatively stronger than sellers over a period of the time and vice-versa of the relative strength is below 1, which indicates sellers have been stronger compared to buyers over a period of time.
When the RS remains above 1 over an extended period of time the RSI plot will keep rising, it can have a maximum value of 100. Any value higher than 70 for RSI is considered overbought and an RSI value below 30 is considered oversold.
What is overbought and oversold?
Overbought is a zone in time and the price of an asset that has risen in price rapidly and is now considered to be trading at a higher value than its true worth or fair value.
When an asset becomes overbought, it means that there are more buyers in the market than sellers, causing the price to increase rapidly. This can occur when investors become overly optimistic about the asset's future prospects or when there is a surge in demand for the asset.
However, an overbought asset is not necessarily a signal to sell. In fact, some traders and investors may view an overbought asset as an opportunity to profit from further price gains. Nevertheless, an overbought asset is often seen as a warning sign that the price may be due for a correction or pullback, as it may have become detached from its underlying fundamentals or economic conditions.
Oversold conditions are simply the opposite of overbought.
Why is RSI above 70 considered overbought?
The reason a reading above 70 is considered overbought in RSI is because it is a widely used and accepted threshold. The value of 70 is not based on any specific mathematical or statistical calculation, but rather it is a commonly used level that has been found to be effective over time. Now because it's a commonly used threshold it becomes self-fulfilling prophecy, where everyone starts acting on it and start selling the asset or at least being to anticipate coming pull back, which leads to slowdown in buying and increased selling, which causes RSI to start going down in oversold territory and the cycle is repeats.
How to effectively use RSI?
For a long trade:
Step 1: Use it on mid to high term timeframe ideally 4h and above.
Step 2: Wait for the RSI to come to the oversold zone.
Step 3: To make sure RSI oversold conditions are to be trusted for entering a trade, the Price must be a key support level and holding it.
Step 4: If all above conditions are met, then fearlessly enter a trade.
For a Short trade:
Step 1: Use it on mid to high term timeframe ideally 4h and above.
Step 2: Wait for the RSI to come to the overbought zone.
Step 3: To make sure RSI overbought conditions are to be trusted for entering a trade, the Price must be a key resistance level and rejecting it.
Step 4: If all above conditions are met, then fearlessly enter a trade.
What happens if Price fails to hold Support or Breaches Resistance in step 3 above?
That's where divergences come into play.
What is a divergence?
Divergence is a technical analysis concept that occurs when the price of an asset and its RSI indicator move in opposite directions, indicating a potential trend reversal.
There are two types of RSI divergences: bullish divergence and bearish divergence.
Bullish divergence occurs when the price of an asset makes a new low while the RSI indicator makes a higher low. Remember from explanation provided in sections above, this suggests that even though the price is going lower there
are more buying activities than selling and the assets are becoming stronger, and a potential trend reversal may be imminent.
Bearish divergence, on the other hand, occurs when the price of an asset makes a new high while the RSI indicator makes a lower high.
I have highlighted bullish divergence in chart with purple line.
Bullish and Bearish Divergences are even more powerful signals for taking trades, but we must make sure price is holding a support or rejecting from a resistance before taking the trades, otherwise divergences can easily disappear.
Why do traders fail to effectively use RSI?
The primary reason is lack of experience in trading.
Which leads to impatient behavior.
No risk management skills. (Taking too much risk)
Lack of trust in self when taking trades, (Keep stopping losses too tight which knocks them out of the trades).
I have show several instances where RSI generated long signals and all of them were successful , the only reason a trader would not be able to use RSI effectively is because of above reasons.

Tips to Help Demystify the RSIPrimary Chart: Tips to Help Demystify the RSI
Introduction to Momentum Indicators
Many indicators exist for technical analysis. And a number of them focus on momentum, which is distinguishable from other core technical concepts such as trend, support and resistance, volatility, and standard deviation. Momentum tools measure the velocity of a directional price move. Using a train as an analogy, momentum considers the speed, velocity and magnitude of the train's movement in a given direction, e.g., north or south. In a sense, it helps determine the strength and speed of the directional travel of the train.
By contrast, trend analysis considers whether a price move is consistently heading in a given direction. A trend can be valid despite corrective retracements, where price retraces a portion of the prior move, consolidates a portion of the prior move, and then resumes movement in the trend's direction. Using the same train analogy, trend analysis considers how effectively and persistently the train is moving in a given direction, such as north or south. Momentum, though, considers the train's speed and velocity in whatever direction the train is moving.
Many momentum indicators also are not limited to analyzing momentum and may have utility as a trend gauge as well. For example, Stochastics, MACD and RSI all have the additional capacity to help analyze trends.
Basic Concepts and Calculation of RSI
Created by J. Welles Wilder, the RSI is one of the most widely used and well-known momentum indicators. The acronym "RSI" means relative strength index. RSI should not be confused with the concept of relative strength, which compares one instrument or security against another to determine its outperformance or underperformance. Some other common momentum indicators that have been in use for many years include the Rate-of Change, Chande Momentum Oscillator, Stochastics, MACD, and CCI. Most momentum indicators, including RSI, share some conceptual aspects, such as overbought and oversold conditions and divergences, even though they may vary in the way they are calculated and interpreted.
Reviewing the way an indicator is calculated can sometimes help to sharpen one's understanding of it and interpret it more effectively. RSI's calculation is not as complex as some indicators. So reviewing its calculation remains an accessible exercise, but this is not essential to mastering the indicator. TradingView's RSI description contains a useful summary of how the indicator is calculated. See the Calculation section of the RSI description at this link: www.tradingview.com(close%2C%2014).
Another excellent description of how RSI is calculated may be found on this reputable technical-analysis website: school.stockcharts.com
To summarize, RSI's basic formula is as follows: RSI = 100 – (100 / 1 + RS), where RS = average gain / average loss.
Using the default lookback period of 14 (note that any lookback period can be selected), the calculation then proceeds to include 14 periods of data in the RS portion of the calculation (average gain / average loss). So the average gain over the past 14 periods is divided by the average loss over the past 14 periods to derive "RS," and then this RS value is plugged into the formula at the start of this paragraph. The subsequent calculations also have a lookback of 14 periods (using the default settings) but smooth the results.
Smoothing of these values then occurs by (1) multiplying the previous average gain by 13 and adding the current period's gain, if any, and dividing that sum by 14, and (2) multiplying the previous average loss by 13 and adding the current period's loss, if any, and dividing that sum by 14. If the lookback period is adjusted from the default of 14, then the formula and smoothing techniques will have to adjust for that different period.
In short, the calculation reveals that RSI's core function is to compare the size of recent gains against the size of recent losses and then normalize that result so the indicator's values may fluctuate between 0 to 100. Note that if a daily period is used, for example, the average day's gain is compared against the average day's loss over the lookback period selected. Similarly, if hours are used, the average hour's gain is compared against the average hour's loss over the relevant lookback period.
RSI can be used on any timeframe, including a 1-minute or 5-minute chart, and simply calculates its values based on the period to which the indicator is applied, based on a default using closing prices for the period specified. With TradingView's RSI indicator, traders have a great deal of flexibility in adjusting such defaults to some other preferred value, so the closing price need not be used—the default can be changed to the open, the high, the low, high+low/2, high+low+close/3, or several other options.
Interpreting RSI's Overbought and Oversold Signals
With some exceptions, the higher-probability RSI overbought (OB) and oversold (OS) signals align with the direction of the trend. The old trading adage remains valid for RSI as with other forms of technical analysis: the trend is your friend. In the chart below, consider the yellow circles flagging OS signals that could have been effective in the Nasdaq 100's uptrend in 2021.
Supplementary Chart A: Example of RSI OS Conditions That Align with an Uptrend and Key Support
As with other technical trade signals, countertrend setups should be avoided in the absence of overwhelming confirmation from other technical evidence. If a countertrend setup is traded, use extra caution and smaller position size. In this context, trading RSI signals against the trend means selling or entering a short or bearish position in an uptrend when an OB signal appears, or it means buying or entering bullish positions in a downtrend when an OS signal appears. It may also mean trading counter-trend positions as soon as RSI begins exiting an OB or OS zone.
Stated differently, trading overbought and oversold signals against the trend will likely result in mounting losses. Countertrend trades require much technical experience and significant trading expertise—and even the most experienced trading veterans and technical experts say that the counter-trend trades tend to be low probability setups. In short, never trade the RSI's OB and OS signals mechanically without considering any other technical evidence.
Supplementary Chart B: NDX OB Condition in an Uptrend
In the chart above, note how the Nasdaq 100 (NDX) reached a fairly high daily RSI reading of 77.17 on July 7, 2021. This chart shows an example of how even very high OB conditions can persist much longer than expected. RSI remained above 70 for over a trading week. And the ensuing pullback was not that significant, and it didn't reverse the uptrend at all. The risk-reward for mechanically trading this setup would have been poor, and stops would probably have been ignored at some point in the days following the signal. For an experienced trader with small position size, perhaps the second RSI peak immediately following the July 7, 2021 peak would have worked for a short-term trade given that a divergence arose (higher price high coinciding with a lower RSI high). But it would still have been a difficult trade requiring excellent timing and precision.
In summary, OB / OS signals should not be interpreted and traded mechanically. The trend and other technical evidence should always be considered. OB / OS signals work best when aligned with the direction of the trend on the relevant time frame. They also work best when taken at crucial support or resistance.
Consider several other tips and tricks when interpreting OB / OS signals on RSI.
1. The importance of an OB / OS signal depends not only on the context of the trend in which it arises but also on the time frame on which it appears and the lookback period used in its calculation. This is intuitive, but it helps to keep this in mind. For example, an OB / OS reading has a greater effect on the weekly or monthly chart than on the daily, and an OB / OS reading has a greater effect on daily chart than on the hourly or other intraday chart. Furthermore, if the RSI lookback period is set to 5 periods on a given time frame, the effect of an OB / OS reading will less significant than if the RSI lookback period is set to 14 (the default setting).
2. Consider past OB / OS readings for the same security or index being considered (using the same time frame for past and current OB / OS readings). Each security or index may have OB / OS levels that differ somewhat from other securities or indices. In addition, the OB / OS readings that are typical for a given a security, index or instrument may vary over time in different market environments. It may help to draw support or resistance lines on the RSI indicator within the same market environment and trend to determine what RSI OB / OS levels are typical. RSI support or resistance levels in an uptrend should not drawn to be applied and used in a downtrend for the same index or security.
Supplementary Chart C.1: RSI Support and Resistance Levels for NDX in 2021 on Daily Chart
Supplementary Chart C.2: Two RSI Downward Trendlines Drawn on BTC's Weekly Chart to Help Identify Resistance
3. Divergences can strengthen the effect of an OB / OS signal. Stated simply, a divergence occurs when the RSI and price are in conflict. For example, consider two or three subsequent higher highs in price that occur (this can happen in an uptrend or a bear rally or in a trading range). When price makes the second or third high, a divergence arises if RSI makes a lower high. Or consider two or three subsequent lower lows in price. When price makes the second or third lower low, a divergence arises if the RSI makes a higher low. A greater number of divergences presents a stronger signal than a lower number of divergences. And having divergences on multiple time frames can also be helpful. Finally, a divergence should not be traded until confirmation comes from price itself, i.e., a trendline or other support / resistance violation.
Supplementary Chart D: Example of RSI Bearish or Negative Divergence at NDX's All-Time High in November 2021
4. OB / OS signals also can be helpful in chop when they arise at the upper boundary of a well-defined trading range. In choppy trading ranges, one has a better trading edge at the edge. OB / OS signals that arise at the edge (at critical support / resistance) are the most useful. But depending on the trading strategy, setups in choppy trading ranges can be more difficult and lower probability than setups in strong trends.
Using RSI as a Trend-Analysis Tool
While primarily a momentum tool, the RSI has trend-analysis aspects. Because the RSI will likely remain in overbought (OB) or oversold (OS) for extended periods, it helps evaluate the strength and duration of price trends.
In an uptrend or bull market, the RSI (daily) tends to remain in the 40 to 90 range with the 35-50 zone acting as support. In a downtrend or bear market the RSI (daily) tends to stay between the 10 to 60 range with the 50-65 zone acting as resistance. These ranges will vary depending on the RSI settings, time frame, and the strength of the security or market’s underlying trend. As mentioned above, RSI readings will also vary from one security or index to another. They also vary in different market environments, e.g., a strong uptrend vs. a weak uptrend will have different OB / OS readings.
So the RSI can help confirm the trend when it moves within the RSI range that is typical of that security or index when trending. As a hypothetical example example, if a major index appears to be making higher highs and lower highs, respecting trendline and other key supports, and showing technical evidence of an uptrend, then RSI can help confirm this trend analysis by marking OS lows within the 35-50 range (perhaps 30 on a volatile pullback). RSI can also help time entries and exits when reaching the area that has been where RSI has found support in its current market environment.
The following points summarize how RSI tends to operate during trending price action:
During an uptrend, RSI will trend within the upper half of the range (roughly), moving into OB territory frequently (and at times persisting in the OB zone) and finding support around 35-50. When RSI finds support around 35-50, this may represent tradeable a price pullback—a retracement of the recent trend’s price move—that may work as a bullish entry if other technical evidence confirms.
During a downtrend, RSI will trend within the lower half of the range (roughly), moving into OS territory frequently (and at times persisting in the OS zone) and finding resistance around 50-65. When RSI finds resistance around 50-65 (sometimes higher given the violent nature of short-squeeze induced bear rallies), this may represent tradeable a price bounce—a retracement of the recent trend’s price move —that may work as a bearish entry if other technical evidence confirms.
RSI, like other indicators, cannot produce perfectly reliable and consistently accurate signals. Like other indicators, it can help identify higher probability trade setups when used correctly and when confirmed with other technical evidence. When considering trade setups in terms of probabilities rather than certainties, traders will find position sizing and risk management to be a vital part of any strategy that relies in part on the RSI.

How to Trade With Relative Strength Index (RSI) Indicator
Hey traders,
Relative strength index is a classic technical indicator.
It is frequently applied to spot a market reversal.
RSI divergence is considered to be a quite reliable signal of a coming trend violation and change.
Though newbie traders think that the application of the divergence is quite complicated, in practice, you can easily identify it with the following tips:
💠First of all, let's start with the settings.
For the input, we will take 7/close.
For the levels, we will take 80/20.
Then about the preconditions:
1️⃣ Firstly, the market must trade in a trend ( bullish or bearish )
with a sequence of lower lows / lower highs ( bearish trend ) or higher highs / higher lows ( bullish trend ).
2️⃣ Secondly, RSI must reach the overbought/oversold condition (80/20 levels) with one of the higher highs/higher lows.
3️⃣ Thirdly, with a consequent market higher high / lower low, RSI must show the lower high / higher low instead.
➡️ Once all these conditions are met, you spotted RSI Divergence.
A strong counter-trend movement will be expected.
Also, I should say something about a time frame selection.
Personally, I prefer to apply it on a daily time frame, however, I know that scalpers apply divergence on intraday time frames as well.
❗️Remember, that it is preferable to trade the divergence in a combination with some price action pattern or some other reversal signal.
Let me know, traders, what do you want to learn in the next educational post?

HOW IT WORKS: RSI (Relative Strength Index) IndicatorThe RSI is a popular momentum indicator used in technical analysis. It was originally developed by a mechanical engineer turned technical analyst J. Welles Wilder Jr.
It was first published in a 1978 book, “New Concepts in Technical Trading Systems” and in Commodities Magazine (Futures magazine) in June’s 1978 issue.
Today the RSI is one of the most popular indicators used to measure the speed and change of price movements.
In other words, it measures the strength of its trend direction (up, down and sideways) on any market by monitoring the changes in its closing price.
THE MAKE UP
The RSI is a line graph that moves between two extremes…
On the vertical axis (Y-Axis) the RSI line moves up and down in a range between 0 and 100.
NOTE: As the indicator is between a range, it is considered a closed indicator.
On the horizontal axis (X-Axis), the RSI line moves to the right which is plotted as time.
NOTE: You can choose your own time frame i.e. days, hours, minutes etc…
For all you technical boffins…
If you want to know how the RSI is calculated, I’ve saved this at the end of the article.
As a trader you won’t need to worry about the maths at all.
Three trading signals you’ll use with the RSI
1. Overbought and Oversold levels
2. Patterns and Trend lines
3. Bullish and Bearish Divergences
Trading signal 1:
Overbought and Oversold levels
When we see the market’s price move up, this means the buyers are outweighing the sellers.
And the more higher closing prices we see, on a market, the higher the RSI line moves…
When we see the market’s price drop, this means the sellers outweigh the buyers.
And the more lower closing prices we see, on a given market, the lower the RSI line moves…
However…
If the buying continues at an unsustainable rate, the RSI will reach a point that traders call OVERBOUGHT (top heavy).
This is where we could start to expect the price to drop from these levels and for the market to enter into a correction (dip).
If the selling volume continues at an unsustainable rate, the RSI will reach a point that traders call OVERSOLD (undervalued).
This is where we could start to expect the price to turn up from these levels and for the market to enter into a recovery (upside).
Now that you understand overbought and oversold terms, let’s explain what I mean with the RSI chart.
Overbought RSI: 70 (Sell opportunity)
When you see the RSI line touch or cross above 70 (Red horizontal line), this is considered an overbought situation.
At this point, traders may start to anticipate that the rising trend is about to end.
Traders may then start to prepare to sell and short their positions, as they believe the market’s price has run up too much.
If the market then turns down and starts to drop in price, the RSI line will drop below 70 and head back to equilibrium at 50 (Black horizontal line).
Oversold RSI: 30 (Buy opportunity)
When you see the RSI line touch or cross below 30 (Green horizontal line), this is considered an oversold situation.
At this point, traders may start to anticipate that the falling trend is about to end.
Traders may then start to buy (go long) their positions, as they believe the market’s price has dropped too much.
If the market then turns up from the 30 mark and starts to rise in price, the RSI line will move back to equilibrium at 50 (Black horizontal line).
Trading signal #2:
Trend lines & Patterns
The second way to spot buying and selling trade ideas is with trend lines and patterns.
Uptrend confirmation
To confirm the strength of the market’s uptrend, you should be able to draw a support (floor level) under the high low RSI prices.
And when the RSI breaks below the support line, it could signal the end of the uptrend and a start to the next bear market.
Downtrend confirmation
To confirm the strength of the market’s downtrend, you should be able to draw a resistance (ceiling level) over the lower RSI high prices.
And when the RSI breaks above the resistance line, it could signal the end of the downtrend and a start to the next bull market.
These are great confirmation and reversal trading signals to use with your strategy.
NOTE: You can also base your buy or sell ideas on trading chart patterns…
Trading signal #3:
Bullish & Bearish Divergence
The third signal I use to spot trade opportunities with the RSI is looking at the market’s price VERSUS the RSI’s direction.
In short…
BEARISH DIVERGENCE – Warning for downside
If the markets price makes higher lows, while the RSI makes lower highs – it’s a warning for DOWNSIDE to come.
BULLISH DIVERGENCE – Sign for upside
If the markets price makes lower highs, while the RSI makes higher lows – it’s a signal for UPSIDE to come.
Either way with both bullish and bearish divergences, the RSI fails to accept the current market’s price movements.
And so it is making a probability prediction that soon the market will make a reversal in its current trend.
Ok so now you know how the RSI works. Let’s sum up what we learnt.
RSI Summary in 3 Trading Signs:
Trading signal #1:
Overbought & Oversold levels
Overbought zone X > 70 = Selling opportunity
Neutral zone: X = 50
Oversold zone X < 30 = Buying opportunity
Trading signal #2:
Trend lines & Chart patterns
Uptrend confirmation: RSI makes higher lows (draw support line)
Downtrend confirmation: RSI makes lower highs (draw resistance line)
Breakout confirmation: RSI breaks out of a chart pattern
Trading signal #3:
Bullish & Bearish Divergence
Bullish divergence: Market’s price – lower highs
RSI – higher lows
Bearish divergence: Market’s price – higher lows
RSI – lower highs
Here’s how to calculate the RSI
The most common (default) settings for the RSI is 14 (Which we’ll use))
There is a two-part calculation with the RSI.
Part 1: Calculate the RSI (step 1)
RS or Relative Strength is (Average Gain ÷ Average Loss)
Average Gain = (Sum of gains over the past 14 periods) ÷ 14
Average Goss = (Sum of losses over the past 14 periods) ÷14
Calculate the RSI (Step 1)
Part 2: Calculate the RSI (Step 2)
Once you have this result, we then smoothen the RSI result with part 2…
And so that’s how the RSI continues with each closing price of the time frame you choose.
Trade well, live free.
Timon
(Financial trader since 2003)
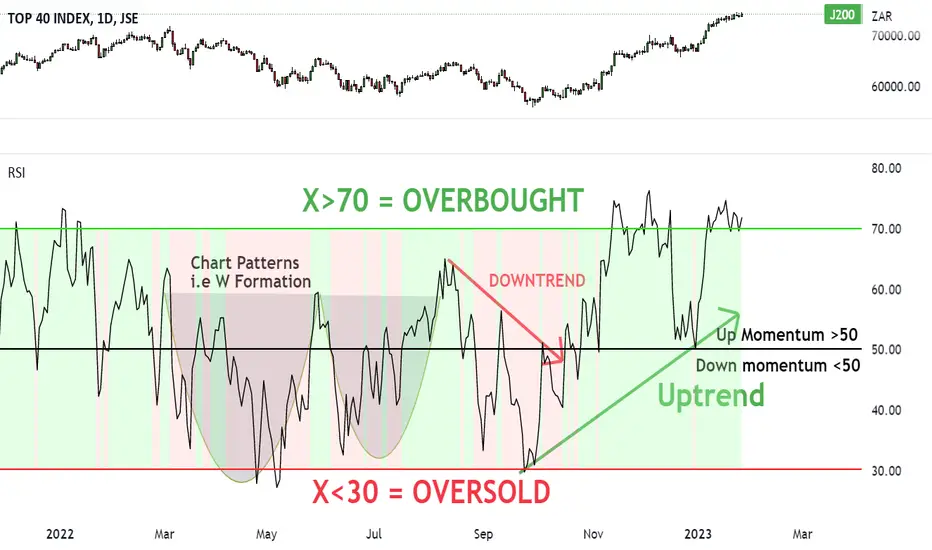
Stochastic + RSI + MACD zero cross strategy from backtest on SPYStrategy
1. Stochastic cross at 50 level
2. RSI cross at 50 level
3. MACD cross at 0 level
4. Engulfing Candlestick?
5. Level 2 Tape sentiment balance (Optional)
Technical Analysis
It's a simple technical analysis setup strategy for bullish or bearish trading setup in both bullish and bearish sentiment scenarios. All levels in the indicators are at standard default settings.
Step One:
Look at the Stochastic indicator cross at 50 level and a cross over the signal line. This will be the first check and we want the cross to occur at the 50 level.
Step Two:
Check the RSI and need a cross at 50 level. This is the second confirmation.
Step Three:
Check the MACD cross and it's best to wait for the cross to happen at the zero line. This has a lower instances from occurring but it helps to avoid fake-outs that MACD is prone to showing.
Step Four:
Look for an engulfing candlestick pattern in the chart for a final confirmation.
Step Five (Optional):
If you have access to Level II quotes and the Time&Sales, watch for a momentum into the Ask side for a bullish sentiment or the Bid side for a bearish sentiment. Also you'll need to be familiar with tape reading on the volume and speed for better entry or exit.

The "Hidden RSI Divergence" and a LIVE TRADEFinding regular divergences is an easy thing especially when you're using the heiken Ashi algo oscillator but finding hidden divergences can be a little bit more complex. So in today's video I'm going to show you how to find hidden divergences and what you should do with them.
Obviously step number one is go to the community scripts on tradingview and search for Heiken Ashi Algo Oscillator
If you Have any trouble finding it just follow this link
What you're watching me do in this video is identifying hidden Divergence has and I am doing a live trade.
I am also discussing the importance of setting your support and resistance levels as well as looking at your charts, doing your analysis on a high time frame and then doing your actual trades on a lower time frame.
In the previous video as I've mentioned before anything happening between the green and red or + 10 + - 10 range of the oscillator anything inside that area is irrelevant you don't care about heiken Ashi values or oscillators values or anything inside that area so when you have your RSI cross for example above the 0 level you also need a hike and as you candle to close above + 10 when you have your RSI value across below the 0 leveled you also need a heiken Ashi candle to close below the -10 level.
One thing to note is the major difference between regular divergences and hidden divergences is this.
When looking for Regular Divergence has you are looking for highs above the +10 of the oscillator or you are looking for Lowe's below the -10 level of the oscillator.
However with hidden Divergences it is different. a hidden Divergence will be the Lowe's above + 10 and the highs below -10. So at this point you are looking for the highway 6 or the low wicks in those areas.
But ultimately you still trade them the same way. Meaning that if your RSI slope is to the down side then you have to be ready for your price to move down. If the slope of your RSI Divergence is to the upside then you have to be ready for price to move up.
I could do my best to tell you in this dialogue how to do this trade however it would be best for you to just watch this video and ask questions below.

How to trade intraday pullbackHello friends,
Market finally picked a direction and it looks like it's gonna continue downtrend. Many novice traders are long biased and they find it very difficult to trade in down-trending market. Today, I am going to share a simple strategy for making quick gains by trading pullback in a downtrend.
Below is a chart of NASDAQ:AMZN in daily timeframe. You can see that price is in a downtrend.
Below is 5 minutes timeframe chart of NASDAQ:AMZN .
You can see that above chart fulfills all the rules mentioned below. For this trade, Risk to Reward ratio is 1:3.
Checklist -
1. Price is making LL while RSI is making HL - Bullish Divergence(highlighted in the chart)
2. RSI is below 30 - Price is oversold
3. Price is showing signs of reversal - Long lower wick candle(highlighted in the chart)
4. Above three confluences occurs during the first 1.5 hours of market open before market goes into mid-day chop
5. Risk to Reward ratio is at least 1:2 (shown in the chart)
Entry -
1. Enter at the next candle open after reversal confirmation
Exit -
1. Set Stop-loss below the recent low
2. Set Target at the first resistance

One divergence indicator to rule them allGreetings Traders,
We are continuing with our (mini) series in which we break down the (seemingly endless) features of The Divergent indicator.
Today we are going to discuss the various oscillators The Divergent supports detecting divergences on.
In contrast to other divergence indicators on TradingView, The Divergent comes with oscillators built-in. This means you won't have to add it on top of other indicators on your chart; it is completely standalone. Why is that a good thing? It is because The Divergent respects your indicator quota - it will only use up a single slot on your chart.
The Divergent ships with the following oscillators:
MACD (Moving Average Convergence Divergence)
RSI (Relative Strength Index)
CMF (Chaikin Money Flow)
Stochastic RSI
MFI (Money Flow Index)
TCI (Trading Channel Index, aka. WaveTrend)
Balance of Power
CCI (Commodity Channel Index)
Awesome Oscillator
Each oscillator is fully customisable, allowing you to tweak them the way you desire. To choose another oscillator, simply open The Divergent 's settings panel, and select a different one from the list.
A further benefit of having the oscillators built into the indicator, is that it opens up the possibility to apply various filters to the detected divergences. For example, if you have the RSI selected, you can configure The Divergent to only signal those RSI divergences, that manifest under the oversold or above the overbought areas. These filters will be introduced in detail in future articles.
To learn more about The Divergent , please see the related ideas linked at the bottom.
If you liked this post, please don't forget to give it a thumbs up!
If you have any questions, please feel free to ask in the comments section below.
Thank you for your attention!

How to send Divergence signals to your Discord server- Do you have a Discord server set up for your own trading community?
- Do you use divergences as part of your trading strategy?
- Would you like to send automated notifications to your Discord server whenever a divergence appears on any chart?
If you have answered yes to all 3 questions above, please keep on reading.
The easiest way to receive automated Divergence alerts to your Discord server, is to combine the alert messages from "The Divergent" divergence indicator on TradingView with a Webhook endpoint on your Discord server.
Step 1: Open Discord, and go to Server Settings
Step 2: Go to Integrations and create a new Webhook
Step 3 (optional): Rename your Webhook to "The Divergent (Divergence indicator)"
Step 4: Select the channel you wish to receive the divergence signals to (i.e. #divergence-signals)
Step 5: Save your Webhook
Step 6: Copy your Webhook URL to your clipboard and head over to TradingView
Step 7: Apply "The Divergent" or "The Divergent (Pro)" indicator to your chart and configure it as you prefer (The free version of The Divergent can signal Regular Divergences only, while the Pro version can signal both Regular and Hidden Divergences)
Step 8: Create a new alert, select "The Divergent" from the top drop down and select one of the Divergence signals (i.e. Regular Bullish)
Step 9: Use the Webhook URL from your clipboard as the Webhook URL of the alert
Step 10: Use the following alert message:
{"content": "The Divergent detected a Regular Bearish Divergence (RSI) on {{exchange}}:{{ticker}} ({{interval}}) @TradingView #divergence $BTC "}
Sample message delivered on Discord:
"The Divergent detected a Regular Bearish Divergence (RSI) on BINANCE:BTCUSDT (60) @TradingView #divergence $BTC"
Feel free to change the content to match your chart / type of divergence you are signalling in the alert.
Note : It is important that you format your alert message as a JSON string, and that you key the message with "content". If you have never used JSON before, it is a good idea to validate your message via jsonlint.com to make sure it is a valid JSON string.
Repeat the same steps for other charts / divergences. Create as many alerts, as many markets / divergences you want to signal to your Discord server.
If you have any questions, please feel free to post it in the comments section below.
If this tutorial was helpful to you, please consider giving it a thumbs up!
Thank you!

The easiest way to use divergences in your own Pine strategiesDetecting divergences in a Pine indicator / strategy is easy.
You simply have to compare the pivot lows and the pivot highs on the price and the oscillator, and if you can identify a difference between the last & previous pivots made on the price and the oscillator, you have likely found a divergence.
Using this theory, here is an example how you would detect a Regular Bearish divergence:
While the theory of divergence detection is simple, more often than not, things go wrong (the divergence indicator used in the example below is TradingView's built-in Divergence Indicator ):
Would you identify this as a divergence? If not, why not? Is it because the divergence line is slicing through the candles? Or because the line is slicing through the oscillator? Or something else?
Wouldn't it be great if somehow you could filter out invalid divergences from code, such as this one?
We at Whitebox Software were wondering about the same thing, and decided to find a solution to this problem. This is when we realised that while detecting divergences is easy, detecting valid divergences is hard...
After several months in development, we are proud to present to you our divergence indicator called The Divergent .
The Divergent is an advanced divergence indicator with over 2500 lines of Pine Script, exposing over 30 different configuration options, including 9 built-in oscillators, to allow you to tweak every aspect of divergence detection to perfection.
For example, the Line of Sight™ filter in The Divergent would have easily filtered out this invalid divergence above. The Line of Sight™ filter will notice any interruption to the divergence line connecting the price or the oscillator, and will treat the divergence as invalid.
This filter is one of many, which has been created to reduce the false positive detections to a minimum. (In later publications, we will discuss each and every filter in detail).
Alright, so The Divergent knows how to detect accurate divergences, but how is it going to help you detect divergences in your own Pine strategy?
The Divergent is not simply a divergence indicator - it can also emit divergence signals * which you can catch and process in your own strategy. You can think of The Divergent being a DaaS ( D ivergences a s a S ervice)!
* Please note, that divergence signals is a Pro only feature.
To use the signals, simply place The Divergent onto the same chart you have your strategy on, import "The Divergent Library" into your code, link your strategy to The Divergent using a "source" input, and act on the signals produced by The Divergent !
Here is a simple strategy which incorporates divergence signals produced by The Divergent in its entry condition. The strategy will only open a position, if the moving average cross is preceded by a regular bullish or bearish divergence (depending on the direction of the cross):
//@version=5
strategy("My Strategy with divergences", overlay=true, margin_long=100, margin_short=100)
import WhiteboxSoftware/TheDivergentLibrary/1 as tdl
float divSignal = input.source(title = "The Divergent Link", defval = close)
var bool tdlContext = tdl.init(divSignal, displayLinkStatus = true, debug = false)
// `divergence` can be one of the following values:
// na → No divergence was detected
// 1 → Regular Bull
// 2 → Regular Bull early
// 3 → Hidden Bull
// 4 → Hidden Bull early
// 5 → Regular Bear
// 6 → Regular Bear early
// 7 → Hidden Bear
// 8 → Hidden Bear early
//
// priceStart is the bar_index of the starting point of the divergence line drawn on price
// priceEnd is the bar_index of the ending point of the divergence line drawn on price
//
// oscStart is the bar_index of the starting point of the divergence line drawn on oscillator
// oscEnd is the bar_index of the ending point of the divergence line drawn on oscillator
= tdl.processSignal(divSignal)
bool regularBullSignalledRecently = ta.barssince(divergence == 1) < 10
bool regularBearSignalledRecently = ta.barssince(divergence == 5) < 10
float slowSma = ta_sma(close, 28)
float fastSma = ta_sma(close, 14)
longCondition = ta.crossover(fastSma, slowSma) and regularBullSignalledRecently
if (barstate.isconfirmed and longCondition and strategy.position_size == 0)
strategy.entry("Enter Long", strategy.long)
strategy.exit("Exit Long", "Enter Long", limit = close * 1.04, stop = close * 0.98)
shortCondition = ta.crossunder(fastSma, slowSma) and regularBearSignalledRecently
if (barstate.isconfirmed and shortCondition and strategy.position_size == 0)
strategy.entry("Enter Short", strategy.short)
strategy.exit("Exit Short", "Enter Short", limit = close * 0.96, stop = close * 1.02)
plot(slowSma, color = color.white)
plot(fastSma, color = color.orange)
One important thing to note, is that TradingView limits the number of "source" inputs you can use in an indicator / strategy to 1, so the source input linking your strategy and The Divergent is the only source input you can have in your strategy. There is a work around this limitation though. Simply convert the other source inputs to have a string type, and use a dropdown to provide the various sources:
string mySource = input.string("My source", defval = "close", options = )
float sourceValue = switch mySource
"close" => close
"open" => open
"high" => high
"low" => low
=> na
---
This is where we are going to wrap up this article.
We hope you will find the signals produced by The Divergent a useful addition in your own strategies!
For more info on the The Divergent (Free) and The Divergent (Pro) indicators please see the linked pages.
If you have any questions, don't hesitate to reach out to us either via our website or via the comment section below.
If you found value in this article please give it a thumbs up!
Thank you!
