Dark Cloud Cover at PCZ of Bearish Bat on PlatinumNot Much in the way of indicators except your RSI is slightly overbought and that's about it but in General this Price Action is pretty Bearish and you'd expect a decent move down from here.
Rsioverbought

AUDCAD - Bearish ButterflyA Bearish Butterfly has formed on the AUDCAD chart, if you are an aggressive trader, you may consider engaging it.
Butterfly Pattern is 1 of the most misunderstood level. Many traders are confused about its completion level and have been guessing the stop-loss level.
If you are one of those people, don't trade the Butterfly Pattern until you got the right mentor.

CADJPY - Bearish GartleyBearish Gartley forms in the 1hourly chart which give trend traders a shorting opportunity. However, ff you are bullish on Canada movement from tonight rate hike decision at 11 pm (GMT +8), it is probably not a good idea to leave the trade open past it.

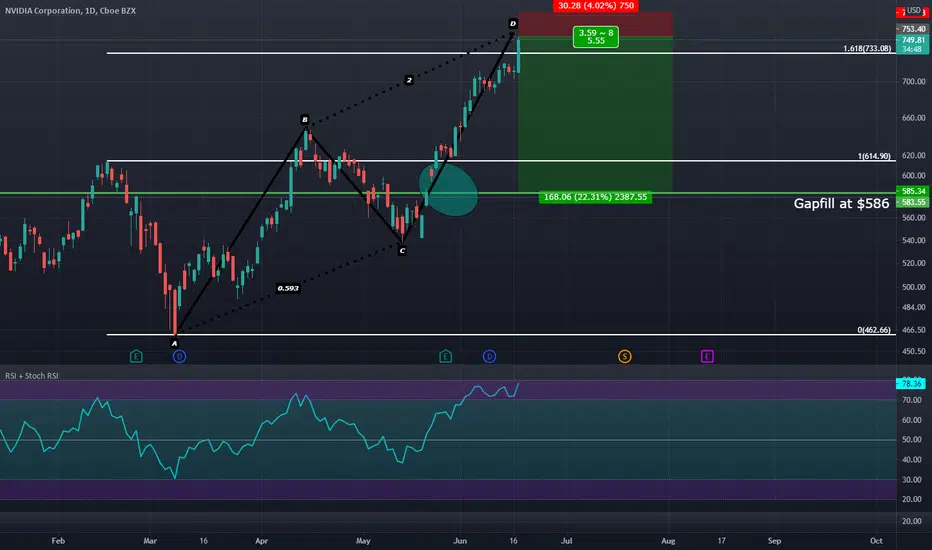
Do We Short Yet?!?NO!! It's gone Ape-S**TT!!! Melting Up; Short here = Suicide. Could get a Measured MOVE from the Breakout point 4593; +249 push to 4842?!?
Watch these Indicators for a pivot. Near-term Short entry for a technical pullback at WT crossover when RSI overbought and a 5-wave EW in RSI appears; NOT before! Do not hold this short for long term, purely a day trade from Nov ATH price pushback, roll into longs when WT signals!
Expect Strong R at the ATH 4744; then moving higher to new ATH: likely get firm pushback after an exhaustion gap appears;
perhaps 12/08 the way it moves will arrive in a few hours, fgs, FOMC dovish position could spark final ATH move.
This is not investment advice! Estimates given are not guaranteed to be valid projections, trade at your own risk and with great care!! GLTA!!

AUDCAD - Bearish SharkA Bearish Shark Pattern complete at 0.9232 on the AUDCAD 1-hourly chart. If you are looking to ride on the buying trend, a buy entry when the candle touches the blue trendline as long as it never breaks and closes below the trendline or the immediate candle low price.
Personally, I won't be looking at that, and that is because there is only a 30pips profit potential heading towards the Shark Pattern.
What's your trade plan in tackling this trading setup?

Gold - Bearish GartleyDo you dare to short Gold?
If you do, $1866.73 is a good price you can consider engaging the trade on a Bearish Gartley Pattern formation.
However, a 3-bar reversal pattern is required on the daily chart as a minimum requirement for me to engage the trade base on the Daily Chart and with an RSI overbought or RSI Divergence.

OXT 1HR - PUMPING BUT RSI HIGHOXT is doing very well but RSI on the 1H, 4H are very high. Possible cool down before a potential next leg up (similar to the last pattern).
What are your thoughts? Comment below and hit the like please. Thank you!
Disclosure: This is just my opinion and not any type of financial advice. I enjoy charting and discussing technical analysis . Don't trade based on my advice. Do your own research! #cryptopickk #bitcoin #altcoins

Momentum play on NQ 45-min via volume-weighted RSIOverview
Simple overbought-oversold momentum play using NEXT RSI , which blends volume analysis with momentum. Volume weighing of the algo reduces the lag and improves accuracy over vanilla RSI as volume often precedes price action. This is a contra-trend (momentum exhaustion) scalping strategy - use order management (TP, SL, trailing stops) and do not trade signal to signal (e.g. long-short-long) .
Strategy Rules:
- NQ Futures, 45min chart
- Long Entry when NEXT RSI crosses over 35
- Short Entry when NEXT RSI crosses under 65
Order Management:
- Take profit @ +$50
- Stop Loss @ -$50
Prerequisites and set-up:
- NEXT RSI configured to 21,3,65,50,35
- NEXT Strategy Visualizer configured to Signal Source: NEXT RSI, LE @ 35, SE @ 65

AUDUSD - Bearish BatBearish Bat Pattern on AUDUSD will set this pair into a counter-trend trade.
Having the candle bash through and close above point D, I will need to see a pin-bar or known as a long shadow before engaging the trade.

CADJPY - Bearish BatIt is not something new that you have a bullish setup on the USDCAD chart and a bearish setup on the CADJPY chart. This meant 1 thing, the Canadian Dollar, CAD, is on the move.
If both setups is valid, I will engage both and not cherry picking.
Any idea why I'll do that?
Comment down below
If you like to check the USDCAD chart, the link is at the bottom.

USDJPY - Bearish BatA Bearish Bat setup for a Harmonic Patterns as a trend trading trade. I didn't shoot this to my trade ideas community because there is some form of risk on this setup.
The long shadow candle or a pin-bar that was highlighted with the yellow eclipse is the reason that probably you shouldn't engage in this trade.
But I'm getting adventurous today, because base on structure, it is telling me that the buyers can't keep it at the level and close low, which in turn show a pretty strong bearish candle.

USDCAD - Head and Shoulders Well, a Potential Head and Shoulders on the USDCAD formation as a Weak Bearish Trend setup that meets my rule. In this round, the stop-loss has to be above the head with buffer.
You are welcome to chime in the reason why I do that, instead of the usual right shoulder.

USDCAD - Bearish BatA Bearish Bat Pattern has formed up on the 4-hourly chart. I'm waiting for the current candle to close and may just go aggressive when that happens.
This harmonic pattern is a counter-trend setup, hence when it reaches the blue box, you have to shift stop-loss to entry, well, at least I will.

NZDUSD - Supply Zone and Resistance LevelThere's no need for thousands of lines to make a trading work, it can just be a simple line and a small box if you know how to read the price chart, naked.
Naked trading is what I've been doing for years but never really use that term. It simply means trading without indicator, just base on candlesticks.
The black rectangle box is the aggressive trading zone for traders to jump on the bandwagon.
Conservative traders can wait for the retest on the red line for a shorting opportunity.

NZDJPY - TrendlineDon't underestimate this trendline, if the candle fails to break and close above this trendline, it shows that this will be an amazing shorting opportunity. Even when it breaks and closes above this trendline, I'm not looking for a buying opportunity right away and the reason is that on the 4-hourly chart there is multiple shorting opportunities.

Bearish Crab; RSI Overbought at 1.618 Fib Extension.Will be targeting bother $260 and $237 for profit taking.

NZDJPY - Bearish ButterflyNZDJPY has lots of trading opportunities hidden in this pair. If you have learned to trade, you can do your analysis and see what kind of trading setup you can spot. Well, there is one for you, a Bearish Butterfly Pattern complete at 78.78.

EURUSD-Weekly Market Analysis-Jul21,Wk1Well if you have missed the bearish shark shorting opportunity, you might not want to miss this Bearish Shark Pattern on the 1-hourly chart which has to form before 29Jun2021, 1am(+8GMT). If the candle fails to touch point D before the dateline, I will scrap this trading idea.
Lots of traders have complained that the market volatility has dropped, but we still managed to capture some great profits. Check my link(within TradingView at the bottom).
My student has spotted a shorting opportunity as well, leave your thoughts on which trading setup do you prefer, and why?

USDJPY - Bearish Shark checkbackA bearish shark pattern has formed up a few days ago, and this morning I've shorted this shark pattern at 110.95 and should you decide to engage it, you have not missed much. A break and close below the imagined trendline would enhance the trade furthermore and probably I will add more position depends on the candlestick formation.

Bearish Alternate Bat with RSI Overbought at $100Going to target $65 for this one so long as we can get below $100 and stay below $100 this should play out very well.

AUDCAD - Double Top Pull-BackA double top pull back that potentially can be a bearish Gartley Pattern is resting on the previous structure that build a stronger case for a counter-trend trading opportunity at 0.9380.

USDJPY-Weekly Market Analysis-Jun21,Wk3USDJPY is moving slightly higher and higher each day, this may sound like a Dollar optimises but I can assure you the big picture is the exact opportunity. At this moment I'm just going to play along. I'll short when the market retraces back to 109.76 and turn my trade to long once it reaches the trendline and fails the close below the trendline.
You can check on the link below on my student's view. Feel free to share your thoughts in the comment segment.
