ETHUSD - Expect a bounce ... now? lets go above ATHLong time no see !
I was in vacations with the cult of the CME Gap that I joined
Soooo, Eth took some logic profits, it was a quasi straight line from 2400 to 4800 (not mentionning that its coming before from under 1500), a 10% correction is totally ok
we are actually in the middle of the last CME GAP, its filling daddy
Dec 2024 high
100 MA 4H
0.5 fib resistance from last low
0.236 is 4K so we still have room to be in denial if it dips more
as you can see thats a lot of convergences, not even talking about BTC, BTC.D, USDT.D, GOLD and all the other tickers aligning perfectly for the big ritual of the big last leg of the big bull run (B.R.B.L.L.B.B.R.) (I know how to make it since those vacations)
Sooo SL is slightly under first bullish Order Block that u can see in this chart @ around 3440, yes sry I can't mess with the levs even with this perfect entry opportunity
TP1 : 7000
TP2 : 9000
TP3 : 11000 (0.618 fib extension)
Will update the TPs if momentum changes
XX
not advise
RUN

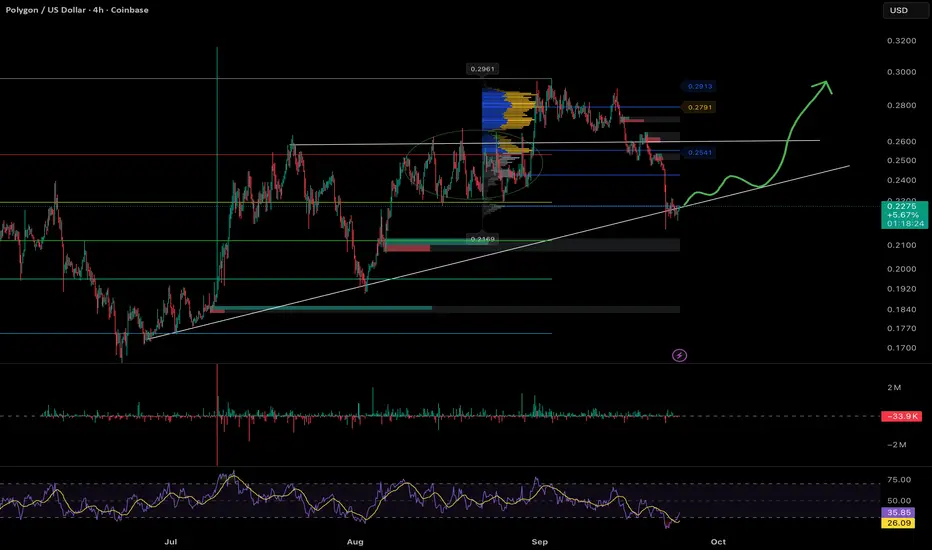
POLUSD Polygon (ex-Matic) Second attempt here following the trendline for now,
SL at 0.1990 if it wicks. And will close below the trendline if theres a clear daily breakdown
TPs : Same as the first try
0.75
1.5
3
6.5
18
cheers
ERA USDT NEXT VIEW Era Usdt looking goods from her for long position
Looking strong technical Analysis 🏆

$RUN Swing Trade Call Debit Spread 100% ROINASDAQ:RUN Open this call debit June 24, 2025 price above 8 EMA and heavy dark pool bellow price. Open CDS 9 to 10 paid 0.18 and closed June 26 Filled 0.36 100% ROI, NASDAQ:RUN
Follow me for more low risk trades.

ETH - Last chance for Ethereum at this area or...?This blue box last chance or i'll probably quit eth :(
0.786 fib + weekly buy zone + insane buy walls on order book
Pectra Upgrade is in a month...
Good luck

$TAN Is This Getting Ready for a Stage 2 Breakout?Clean Energy (Solar) has been in a downtrend since January 2021! Every time it looks like it is setting up for a stage 2 breakout, it has broken down. Will this time be different?
Here is what I see on this chart.
TAN
was in a clear downtrend until mid-December 2024. Then it challenged its previous high from the beginning of December. That failed BUT, it seems to have found a bottom as here we are in early February, and it has not sunk any lower than the December lows.
I am optimistic that we may be ready to enter a Stage 2 uptrend. However, it has work to do. The first step is to get up and over the 50 DMA (red). Next it needs to break the Downtrend line. It also needs to put in a higher high and finally put in a higher low. As I said, it has work to do.
Having said all of that, I have an alert set just over the 50 DMA where I will look for a good entry where I can put in a tight stop should I decide to make the trade. IF, it is going to enter a sustained uptrend it “could” be a big winner. All TBD.
These are my ideas, if you think it makes sense for you, please make it your own trade that fits within “your” trading plan.

This is the first cycle of the bull run that ended without an AlYou may have been expecting Altseason, but I have some bad news to share with you - Altseason is not happening, and at best, some altcoins might recover slightly in the next 2 months. However, due to the liquidity flow of ETFs, Bitcoin's upward trend will continue. I kindly request that new entrants refrain from buying altcoins."
Note: "Altseason" is a term used to describe a period of time when alternative cryptocurrencies (altcoins) experience significant growth and attention.

ZEC and LINK trying to break outNotice that there is a longer term resistance and then we break through it, well we just did recently, this is a momentum play.
Its possible if we see more market pullback like we did this morning we will need to start looking at finding support and buying the dip instead of just jumping on momentum runs. For now there seems to be no shortage of breakouts happening across crypto to trade on momentum.
You should evaluate these yourself, always DYOR, I am just raising a flag on a couple assets of interest.
Currently on the orderbooks, LINK looks a bit more healthy than ZEC but also this is a break out from an already existing breakout for LINK, it has had more time to build force.
Here is the LINK chart:

ETH breakout, short term pullback, long term runThere was more than 6 months of pullback for ETH but there was a clear descending resistance for the last 6 months, every time ETH hit it, it pulled back. We had a double tap and failure to penetrate in October and early November and then 24.Nov we broke through resistance and started to run. This still seems to be early on in the run. We have seen days where ETH outperformed BTC and in fact we are trying to break down the support for BTC Dominance. You can see its clear trend up and how we are testing that support line now. If it breaks down we will likely see ETH run and the stage may be set for a flippening.
I think more likely is that support holds and BTC dominance will start to rise again around this point.
BTC Dominance:
There are many reasons BTC dominance will run but one that is common is that BTC pulls back and the rest of the market pulls back a lot harder. If BTC loses 5% a lot of alts will lose 20% often. Another way BTC dominance runs is if it breaks out and runs for big gains, already having a near a $2T marketcap now, a 5% run would add $100B of market cap for BTC.
BTC tried to break out and it rejected, there is a possiblity that we could trace this all the way back to $68-$70k here depending on the speed of descent. Also though, BTC has been strong and bullish, there is very much a chance that we consolidate and build up here and break out, so this line is really significant, its probably the difference on whether BTC dominance runs because of BTC pulling back or running hard.
BTC Chart:
ETH on the other hand, looks like it has broken out of recent multi-month resistance and seems to just be getting started, but this channel it has assumed is already showing us were we should see support and resistance as it continues to run. This looks like its early on in the breakout really but does look likely that we will pull back more here. If you see this price break top of channel, expect another run and if it breaks bottom of channel, be prepared for a noticeable pullback. In the meantime, as long as it is assuming the channel, it is ascending and bullish.
Keep an eye on BTC, we know if its not happy, generally the whole market suffers. Its hard to find profits on other assets while BTC is dumping so even if you are not trading BTC, you should be watching it.

BAT and ANCHR and maybe GLM good for a run?GLM is about to breaks some long term resistance if it can break free, just a little higher as you see top of channel on the chart. Also Bat has broken out of s hort term trend and looks interesting for a potential run.
i like GLM anyway, its always easy to trade a conviction because you dont mind holding it if you need to. GLM is distributed compute, they have added GPU and they now provide hosting for language models on decentralized compute, fundamentally speaking they are in a fantastic place to me and with a <$500M market cap. I also work in AI a bit so I may be biased there as well, but keep an eye, it breaks that line, it should be a pretty good run.
Order books look great on these, lots of traders expecting the price to go up with far out of the money asks.
Also ANKR just broke out and set old resistance as support, it should be due for a good run any time now.
ANKR break out:
Bat double break out:
BTC has staged a larger scale break out:
BTC zoomed in:
This is why you need to watch for right now and how we could pull back to $95k but no big deal its still way bullish where we are right now.
Watch BTC though, it could pull back any time its at some resistance too and could pull back to $95k before moving back up. If it pulls back hard, it will take everything with it for the most part.

shiba usdt is involved with weekly resistance....shiba is touching the weekly resistance but now is involving with .
we will wait about a day now on , if closed up side the 0.00002824 strongly , except to see 0.00003000 and 0.00003200 and finally 0.00003363 yet ...
for supports we have 0.00002559 and 0.00002435
Good luck

ADA NEXT RUN
according to pattern of cycle that how fall and rise to new levels , we can have same pattern including double bottom and breaking resistance levels and reaching to new prices .
ex cycle remained 4 months and we expect new cycle done in 3 or 4 months and reaching to 12$

Sunrun (RUN) AnalysisCompany Overview: Sunrun is a leading U.S. residential solar energy company, providing solar panel installations and energy services across the country. The company's focus on sustainable energy solutions positions it to capitalize on the growing shift toward clean energy adoption.
Key Catalysts:
Rate-Cutting Cycle: A potential rate-cutting cycle by the Federal Reserve could make solar financing more affordable, increasing the economic appeal of residential solar projects. Lower interest rates would reduce borrowing costs for consumers, making Sunrun's solar installations more accessible and boosting sales.
Trade Policies: U.S. Treasury Secretary Janet Yellen's scrutiny of China's market practices, particularly regarding solar products, could mitigate low-cost competition from Chinese manufacturers. This would benefit domestic companies like Sunrun by leveling the playing field and potentially driving higher demand for U.S.-installed solar systems.
Federal Subsidies: Sunrun is well-positioned to benefit from federal clean energy subsidies provided by the Inflation Reduction Act (IRA). These subsidies are expected to reduce Sunrun's operating expenses and enhance profitability by offsetting costs associated with installations and energy storage solutions.
Investment Outlook: Bullish Outlook: We are bullish on NASDAQ:RUN if it holds above the $17.50-$18.00 range. Upside Potential: The upside target for Sunrun is set at $29.00-$30.00, driven by favorable interest rate conditions, supportive trade policies, and federal clean energy subsidies.
☀️ Sunrun—ready to shine with rate cuts, trade advantages, and clean energy subsidies! #RUN #SolarEnergy 🚀🌱

Kamala Leads, Solar Stocks Shine Again?I'm closely watching the solar sector again, especially stocks like NASDAQ:FSLR , NASDAQ:ENPH , and $RUN.
After the Trump/Biden debate, solar stocks plummeted because it looked like Trump might win. But now, with Kamala Harris running, the odds have shifted her way, and I'm optimistic about the sector since she's likely to support clean energy like Biden did.
These solar stocks have been stable over the last month compared to tech.
First Solar has strong financials, Enphase has solid earnings and big potential, and Sunrun just teamed up with Tesla.
Definitely worth watching all three, in my opinion.

Bull Run BitcoinWe can see that the price of bitcoin is lateralizing in the form of a 5-month bearish flag to liquidate Stop Loss. We may be on the verge of a bullish explosion in the price of bitcoin in the coming weeks as it has bounced off the weekly 50 EMA and the weekly, daily and 4-hour Squeeze Momentum is in red which tells us that it is possibly already at its peak. last bearish movements in the market, and then rise.

YFI long and strongI think this is the best chance to enter a long position .
Yfi looks really good , retest has been met , all it needs to do is to pick up volume and there we go , to the moon.


#RUNIn an upward rally in the weekly and daily time, if the resistance range of 6.25 is broken and by maintaining the green box area, it can continue its growth after the resistance is broken in the case of a pullback until the next supply area.

BTC time to switch ?As things stand BTC will more likely break the ATH , been wrong past 6 months trying to catch a reversal , but i was playing also both sides.Half of my capital currently is invested.
I am still sitting on cash with more than 50% of my portofolio in usdt.
If we start breaking ATH first target is 86k based on fibonacci but also when looking at 2 previous highs there is a trendline that extends and it correlates with fib extension .
First fib extension is 86k , second one is 106k.
I still think a 30-40% drop has to occur.
If that happens ,buy the dip mode will be ON.

Btc long :target 47kWaiting for that 47k region , entering long from this region is a good option.
target 47k.

BTC be carefulBTC has respected this upwards sloping channel for three weeks now.
Should we break to the downside I see a retracement to two shown targets.
As of now we are of course still bullish on BTC and Crypto in the medium/long run, a pull back like this could be a great chance to long should an edge develop. If it does we will provide an update and a trade set up.
Our targets of 40-42k remains for now.

RUNE/USD - Bullet Train to $3Rune is on a clear trajectory to reach $3.
I don't see any big resistance until there.
Buyers are dominating and sellers may only return once the key resistance is it.
Bias is bullish on this price action.
Like and follow for more ideas!

PROSBUSD - Bump and Run Reversal Bottom PatternThe bump-and-run reversal bottom is a chart pattern that is a surprisingly good performer in both bull (ranking best for performance) and bear markets (ranking second best). It has a low break even failure rate and high average rise after the breakout. Discovered by Thomas Bulkowski in 1999.
