BTCUSD DAY TRADING SETUP (CAFX)"This is how I am currently analyzing BTCUSD. I’m paying close attention to the overall market structure, key support and resistance zones, and recent price action to determine where the next move might unfold. I’ll be watching for potential breakout opportunities, liquidity grabs, and retests around major levels to confirm my bias. Keep in mind, this is simply my personal outlook and not financial advice — always do your own analysis before making trading decisions."
Scalping

GOLD (XAUUSD) INTRADAY OUTLOOKCurrent Price: $3,377.
Range: Resistance at $3,378.86, Support at $3,370.24
Price is moving inside a tight box, rejecting both ends. Higher timeframe candles are showing wicks both sides → clear indecision.
🔼 Bullish Plan
Trigger: A 30min body close above $3,378.86 (not just a wick).
Targets: $3,381.50 → $3,383.00. If momentum holds, extension toward $3,390+.
Management: Partial profits at first target, move stop loss to breakeven once $3,380 is held.
🔽 Bearish Plan
Trigger: 30min body close below $3,370.24.
Targets: $3,367.42 → $3,365.00. Further drop possible into $3,362.80 if selling pressure builds.
Management: Scale partials at first target, protect rest at breakeven.
🔄 Range Scalp (higher risk)
Shorts: Near $3,378 on strong rejection → target mid-range $3,372–$3,374. SL above rejection high.
Longs: Near $3,370 on rejection wick → target mid-range $3,374. SL under lows.
⚠️ Small size only, chop can reverse fast.
✅ What Confirms Breakout
Strong 30min candle close outside $3,370–$3,378.
Follow through volume in same direction.
❌ What Invalidates
Breakout candle closes back inside range.
Multiple fakeout wicks without follow through.
📌 Bottom Line
Above $3,378 → Upside targets $3,386+.
Below $3,370 → Downside targets $3,362 and lower.
Inside range = scalpers’ market.

NAS100 – Potential Short Setup After Sharp RallyOn the 5-minute chart, NAS100 has made a strong upward move following a sharp drop earlier in the session.
Price is now approaching a potential exhaustion point near 23,940–23,960. I expect a reversal from this zone, followed by a move back toward 23,725 and possibly lower.
Trade Plan:
Sell Entry: 23,940–23,960 zone after confirmation
Stop-Loss: Above 23,960
Take-Profit: 23,725 initial target; further downside possible if momentum continues
Notes:
Watch for reversal candlestick patterns or break of short-term structure before entering.
This setup is based on intraday momentum and may require fast execution.

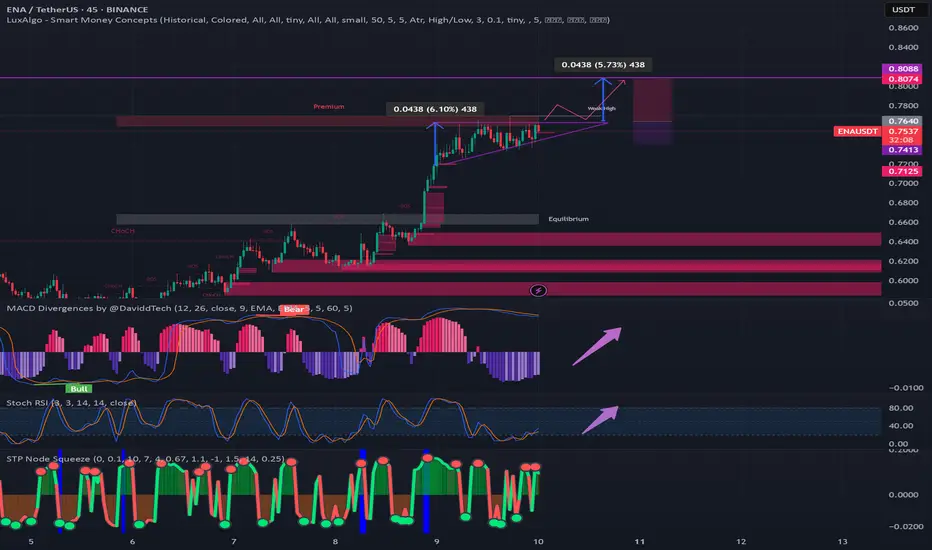
ENA possible Ascending triangle breakout playLook for confirmation above the Resistance line in Pink... maybe wait for a breakout, then a pullback touching the Prior Resistance line before entering... and then note the size of the triangle as a possible TP zone.
It is however, Entirely possible that the structure falls apart as a candle deviates from this pattern and falls to the bottom... just be careful on your entry.
Not Financial Advise... duh..
#ENA #scalptrade #leveragetrading #leveragetrade #eth BINANCE:ENAUSDT.P
BTCUSD : Short levelHere is a great entry point for those who scalp this instrument or pips. The level is marked with a red arrow. It will be active until I report. It may become inactive over time.
Watch out for trading on the news.

ETH SCALP SHORT RR 3:1 Ethereum just hit weekly level with two 15min lower high and lower low. Rules are telling us to not short against trend, but there can be hedge for long positions.
I don't ask to trade more then 0.5 % capital per trade.

Major Move Ahead for ADA – Breakout or Breakdown?
🔍 ADA/USDT Analysis – Dual Scenario Setup (BUY & SELL)
Currently, ADA is ranging between major supply and demand zones. Two clear scenarios are in play depending on how price reacts to key levels:
📈 Bullish Scenario (Long):
Entry: On breakout and confirmation above $0.6027
Target: $0.869 (major resistance zone)
Stop Loss: Below $0.523
Trigger: Break of descending trendline and solid structure above $0.6027
📉 Bearish Scenario (Short):
Entry: Around $0.5120 (rejection from supply zone)
Target: $0.315 (strong demand zone)
Stop Loss: Above $0.6027
Trigger: Failed breakout and rejection from $0.5120 level, with confirmation below it
📌 Based on the descending channel structure, this might have been the final leg of the downtrend, and a reversal to the upside could be underway. However, for confirmation, we prefer to wait for stronger price action signals before fully committing.
🛑 Always use risk management. Market remains bearish until proven otherwise.

Us30 Long Day Trade New York OpenIm looking for a long on the Us30 for a 1:3 min , im trade a long after a the retest due to the the trend has been bullish

Exact Entry Levels & Profit Potential (July 3, 2025)🎯 Market Structure Breakdown – Exact Entry Levels & Profit Potential (July 3, 2025)
📊 In today’s session, I revisit the market for the second time – and you’ll see why I’m ruling out some setups altogether. There’s value in looking twice. What did I miss earlier? It's all in the structure.
I break down price action step by step, highlight precise entry zones, and show where the real potential for movement lies. Clean levels, no guessing.
⚠️ Note: I don’t trade the first 10 seconds – all orders are placed after 9:30:10 and I'm looking for entries only until 11:30:00.
👉 Check out the full breakdown and stay ahead of the game.
NASDAQ:AMZN
NYSE:ANET
NASDAQ:AVGO
NYSE:BA
NASDAQ:COIN
NASDAQ:CZR
NYSE:DELL
NASDAQ:GOOG
NASDAQ:MSFT
NASDAQ:AMD
NASDAQ:RKLB
NASDAQ:SBUX
NASDAQ:SMCI
NYSE:VRT
NASDAQ:NVDA

USDCAD - Scalping in the deepHello dear scalpers, this is our next little scalping setup...
With a ratio of 1.14 ^^
I think this will be a nice position in this downtrend situation.

GBPUSD ScalpAs we see, here we have strong and beautiful resistance level.
The price will go down and test previous levels. TP: 1.35659 (30-33pips).

PYPL: Strong Resistance Zone in Play – Watch 73.34 for EntryNASDAQ:PYPL is showing a potential triple top formation near the 73 level. If price breaks above the 73.34 resistance , there's room to move toward 74.15 – a medium-term swing high.
💡 Trade idea: Enter 1 tick above 73.34, set your target and SL based on the 5-minute chart.

BTC Scalping / Intraday Signal – Entry, Stop & Target Ready!🕒 Timeframe: 15min / 5min
⚠️ Note: Manage your risk — intraday volatility is high.
This is a short-term opportunity, not a long hold.
Disclaimer: This is our personal analysis and not financial advice. Always do your own research before making any investment decisions.
💬 What’s your take on this? Drop your thoughts in the comments and feel free to share this with your friends! ❤️

ETH Scalping Signal – Entry, Stop & Target Ready!🕒 Timeframe: 15min / 5min
⚠️ Note: Manage your risk — intraday volatility is high.
This is a short-term opportunity, not a long hold.
Disclaimer: This is our personal analysis and not financial advice. Always do your own research before making any investment decisions.
💬 What’s your take on this? Drop your thoughts in the comments and feel free to share this with your friends! ❤️

BTC Short analysis + GRID Bot Scalper Strategy for BTC FuturesHELLO DEAR TRADERS,
If you're reading this right now, consider yourself one of the lucky few. You're gaining access to insights that, until now, have remained exclusive — reserved for a very small circle of insiders and influencers.
For a long time, we've hesitated to step into the spotlight and reveal the deeper truth behind the movements of financial markets. But everything comes in due time… and that time is getting closer.
Have you ever wondered how figures like Trump or Elon Musk always seem to bet on the right horse?
Many believe they're the ones moving the markets — but that’s far from the truth.
The real secret?
Their teams have access to advanced tools and knowledge — the right kind of science — to analyze the markets in ways most people can’t even imagine.
We won't go into too much detail here — some information is too powerful (and risky) to be shared publicly. But remember this:
"Trading is a game. And if you know the rules, you always play to win."
Starting today, we’ll be introducing a completely new vision of how to trade the financial markets — or any asset whose price is reflected on a chart.
Get ready to see the markets like never before. 🔥
Scalping Made Simple: The Power of GRID Bots
If you're serious about scalping the markets, one of the most effective tools at your disposal is the GRID trading bot. When properly configured, it can deliver consistent, automated profits by executing micro-trades around the clock.
Let’s be real:
Sitting in front of charts all day, hunting for the perfect sniper entry, is not just exhausting — it’s inefficient.
Why not let automation do the heavy lifting while you focus on strategy?
________________________________________
⚙️ AUTO SCALPER MODE: ON (SHORT TERM BOT
Here are the optimal parameters to configure your GRID BOT on Binance for effective scalping:
🔧 Recommended Settings:
o Trading Pair: BTC/USDTP (futures GRID)
o Mode: Grid Trading (long)
o Price Range: 105000 – 112000 USDT
o Current leverage : x18
o Number of Grids: 22-25 levels
o Order Size: Depends on your capital)
o Profit Mode: Arithmetic
o Margin mode : isolated
o Trailing up : Disabled
o Take-Profit: 112000
o Stop-Loss: 104000
o Open a position on creation : Disabled
o Close all position on stop: Enabled
o Close all positions on TP/SL stops: Enabled
📌 Notes :
⚠️The settings listed aboce have been meticulously calculated using precise algorithmic models. Every parameter serves a purpose — and even the slightest deviation can significantly impact performance, potentially leading to capital loss.
⚠️Do not judge the bot’s performance based on its real-time PNL. The true profit is only realized once the bot reaches its target and closes all active orders.
⚠️These bots are designed with high-level precision, offering a powerful edge when configured and used correctly.
✋ Manual Entries (For Experienced Traders)
If you're a more advanced trader, you can combine the GRID bot with manual entries based on:
o Buy orders listed on the chart
o You can enter a buy position at any price within the defined range on the chart — as long as the price does not break above the upper boundary of that range
o Using leverage is possible, but only under one condition:
-Your stop-loss and liquidation price must always remain below the highest protected low or in the SL area
o Your stop loss should always be bellow the highest protected Low
🔍 Disclaimer: This is our personal analysis and not financial advice. Always do your own research before making any investment decisions.
💬 What’s your take on this? Drop your thoughts in the comments and feel free to share this with your friends! ❤️

CHFJPY - Scalping is Back! Let's see...Hi guys. I will just be scalp here.
Entry price: 173.884 TP: 173.332 SL: 174.438 Win/Loss Ratio 1:1!
Let's do some good scalp! ^^

Short-Term BTC Scalping Opportunity⚡Say less
💥Setup and forget
💥the position is off if price hits 111,959 first.
💥leverage maybe used according to your risk management

Grass short (scalp)Grass short retesting golden zone of fib 0.5 / 0.618
If we have a rejection in that zone then it can be a new support en we can look for an entry for long position.

TAO/USDT – Long Setup ActivatedA potential bottom might be in place here.
🔍 Key confluences:
– Strong CVD rebound (spot + futures)
– Funding rate turning positive
– Top traders ratio shifting bullish (smart money buying the dip)
– Open Interest stabilizing after a clean flush
– And above all: my Scalp Cloud Signal just fired a bullish confirmation ✅
🎯 Targeting a short-term move to the 365–373 zone.
SL clearly defined below the local sweep.
💡 Tool used: Scalp Cloud Signal by The Degen Company
— Precision tool for scalping and micro trend shifts.

How To Customize The 1 Minute Scalping IndicatorThis tutorial explains each setting of the 1 Minute Scalping Indicator in detail so you understand exactly how to adjust your settings to get the results you would like from the indicator.
Here is a list of the details we discuss:
How to fix loading errors
Tooltips that explain each setting for your reference
Trade modes and how they are affected by other settings
Average candle size rejection parameters
Higher timeframe candle filters, settings and levels
External indicator trend filtering capabilities and how to set them up correctly
Stoploss and take profit calculations and settings you can adjust
Signal arrow customization options
Candle coloring adjustments
Visual/styling options
Make sure to watch the whole video so you fully understand how each setting affects the indicator for best results.

How To Filter Signals On The 1 Minute Scalping IndicatorThis tutorial shows you how to use external indicators to filter out signals on the 1 Minute Scalping Indicator so that you only get signals that are in the direction of the trend.
Step By Step Process:
1. Pick an external indicator that provides an output value of 1 for bullish, -1 for bearish or 0 for neutral and add it to your chart. We have multiple indicators that can do this, but you can also customize your own indicators to provide this value and use that to filter out signals.
2. Set your desired trend parameters on your external indicator and make sure that indicator is on the same chart as the 1 Minute Scalping Indicator.
3. Go to the indicator settings for the 1 Minute Scalping Indicator and turn on one of the 3 available External Indicator Filters. Then from the dropdown menu, select the external indicator you want to use and make sure to choose the output value that gives the 1, -1 or 0 output for trends. Our indicators will have an output titled "Trend Direction To Send To External Indicators" to make that value easy to find in the dropdown menus.
That's it! Let the 1 Minute Scalping Indicator reload with the external indicator trend values and it will only show buy signals during bullish trends, only show sell signals during bearish trends or no signals during neutral markets. Make sure to back test your setup until you find the best external indicators and settings to use that work best for your trading style and then apply that setup to any chart you would like.
Here is the code you can use to add a trend value to your own custom indicators and send it to the 1 Minute Scalping Indicator:
trendDirection = 0
if close > ema1
trendDirection := 1
else if close < ema1
trendDirection := -1
else
trendDirection := 0
plot(trendDirection, title="Trend Direction To Send To External Indicators", color=#00000000, display=display.data_window)
Change the (close > ema1) and (close < ema1) to use your own variables from within your script.

$2.29 to $11.17 in 45 minutes $UPXI🔥 $2.29 to $11.17 in 45 minutes with Buy Alert sent in trading view chat before $6 with more than enough of time before it went vertical to $12 🚀
While the rest of the world woke up into red, it's great to catch highly predictable trade like this early Monday morning
Been doing it for 20 years, I hope you profited along! You're most welcome 😉
NASDAQ:UPXI

LONG inside a GIANT SHORT...Mostly I believe the Main trend is Bearish and the Main IDEA represents the same...
small bullish movement is happening... (hope to be true...)
