Scenario

usdcad possible scenarioprice is in a down trend with a current up direction.
in case if the price will stay below the control level, the price will have a good potential to go down.


USDJPY SWA" possible scenarioTrading plan on a current mid term situation.
Instructions on how to read labels on a graph:
The purpose of the SWA approach is not to name the wave, but to make money out of the next swing of a tradable period.
To get a deeper understanding of the approach, that can open a new doors for your trading, please contact.
Impulse move (impulse wave), or the move towards the presumed main trend direction (of a period researched), is indicated with “i” followed by the wave number
Each higher step/grade is marked “i” which stands for Impulse + apostrophe after the impulse wave number one for each step higher. e.g.: i1’ - 1st impulse wave 1 step higher, i1’' - 2 steps higher, i1’’’ - 3 steps higher
i1’’ i2’’ i3’’ 2 steps higher
i1’ i2’ i3’ 1 step higher
i1 i2 i3 trading period
‘i1 ‘i2 ‘i3 1 step lower
‘’i1 ‘’i2 ‘’i3 2 steps lower
Each lower step/grade is marked with apostrophe before the i - letter that stands for impulse wave. 'i - 1 step lower, ''i - 2 steps lower, '''i - 3 steps lower
Corrective move is marked with letters, where: a - 1st corrective wave, b - 2nd, etc…
Each higher step/grade is marked with a wave’s letter + apostrophe after the ; e.g.: ‘ - 1 step higher, ‘’- 2 steps, ‘’’ - 3 steps
a’' b’' c’' - 2 steps higher
a' b' c' - 1 step higher
a b c - trading period
‘a ‘b ’c -1 step lower
‘’a ‘’b ‘’c - 2 steps lower
Each lower step/grade marked with apostrophe before the lowercase letter; e.g.: ‘a - 1 step lower, ‘’a - 2 steps lower, ‘’’a - 3 steps lower
This is an author's simplified wave trading approach. It has been created for trading, and if you're interested to "catch a Wave" please feel free to contact.
All what you see at the charts, is a ready made SAW, so no explanations are added, so if you have any questions, just white a comment, and ask.
The bits of wave theories known , Volume analysis and classical technic analysis is used in the system, to get a simple and professional approach.
For traders
Arturs Jermolickis

TradeToStart week 10: AUD/USD good value to short fromAs all retail traders are looking for long trades, we know this pair can easily get lower again.
The nice high test at out weekle resistance is a good signal to trade from along with a bunch of other confluences on the different TF's.


TradetoStart Week 8: USD/CAD longWe will wait for a little pullback to the 1.40 level and buy from there.
This pair is ALL BULLS.

AUD/USD: Tradetostart WEEK 7 I am back with more analysis.
Use them how u want them to use, this is my opinion and my way of profitable trading. I don't recommend following people blindly.
U can find the other "tradetostart's" on my instagram : FXB_Buddy
Check it out! The link to my website is also on there.

EURUSD H1 Bullish / Bearish scenarios Just trying to learn producing scenarios "WHAT IF".
Bullish option is AB=CD confluenced with potential bat or gartley.
Bearish is breakdown down, retest and then down.
Notice - my previous (one way) EURUSD idea complete, so now is time to thing what is more probable scenario. More probable? I am more bullish than bearish...

EURUSD - Possible ScenarioThis is one possible scenario. A bounce from 1.1270/80 could send the price back to retest 1.1220. As long as the price will not break and close (60 min chart) below 1.1200, it might continue the up trend, targeting this time thr 61.8 Fibonacci retracement. A break below 1.1200 could signal a further drop for the Euro. Don't forget about granny Yellen, who's gonna have a speech on "Inflation Dynamics and Monetary Policy"

Possible #DoubleTop Scenario #JPY #USD #forexThis chart show us a possible double top scenario. There actually two of them pink rectangles. A confirmation of it could be the break of support at 120.5 -120.1 area. You can also see how the double bottom scenario worked out (blue rectangles).

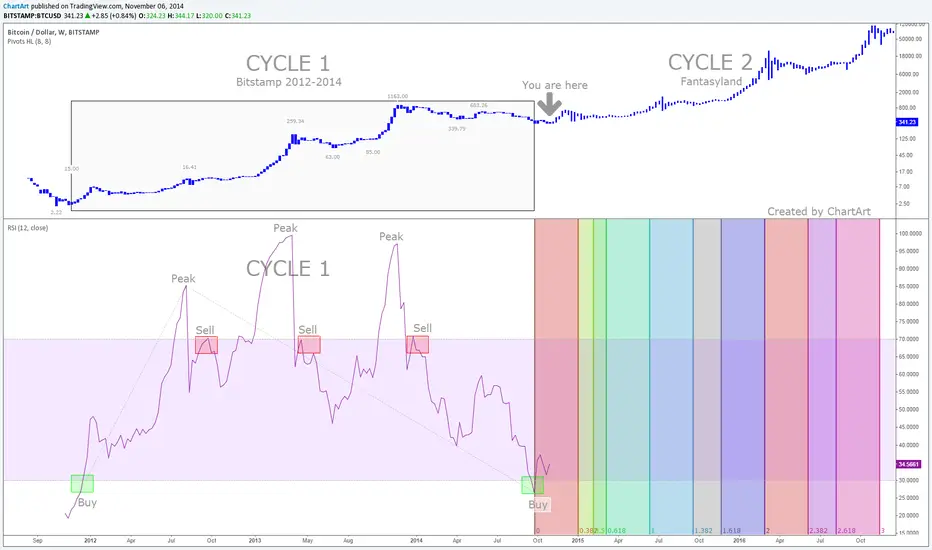
Fantasyland - Bitcoin Future Chart Scenario For 2012 To 2016Here is a land of imagination, hopes and dreams. Magic and make-believe are reborn and fairy tales come true. Fantasyland is dedicated to the young at heart, to those who believe that when you wish upon a star your dreams do come true. Each Fantasyland has several gentle rides.*
Using the RSI (Relative Strength Index) indicator with a 12 week period (equal to three months, or a quarter of a year), you get some interesting historic results when to buy and sell Bitcoin on a weekly chart with all available Bitstamp data since 2012.
Possible Bitcoin ETF hype:
"The Bitcoin ETFs could be days away and Bitcoin is simply overdue for a massive run." "Barry Silbert of SecondMarket confirmed last month that BIT is still slated for Q4. Not much time left in this Q4."
-- 2 Nov 2014 -- twitter.com
"Barry Silbert, CEO of the Digital Currency Group and founder of SecondMarket and the Bitcoin Investment Trust (BIT), is seeking regulatory approval to open BIT to ordinary investors – moving beyond the wealthy “accredited” investors that are currently the only ones with such access. That approval could come before the end of the year."
-- Nov 3, 2014 -- insidebitcoins.com
"The Bitcoin Investment Trust (BIT) now holds more than 100,000 BTC, according to Barry Silbert, CEO of SecondMarket and founder of the trust. Silbert has big plans for the Bitcoin Investment Trust, which is expected to open for public investors sometime in the fourth quarter of 2014."
-- April 11, 2014 -- www.coindesk.com
*Source:
en.wikipedia.org
P.S. If you like my charts, you can leave me a tip:
1PmAnb2htvHnCbwNAxkV7b8XvVQyQ7LQLg
Thanks!
SPY reversal off highs, scenarios and game planUS indexes were up in early trading after New Home Sales data came out much better than expected. Consumer Confidence Index beats expectations as well. But later markets reversed, engulfed those gains and closed near lows. Lets see clues and points of adjustments (15 min timeframe analysis). After price reached resistance zone $195.50-.60 reversal candle appeared that usually leads to correction. Then buyers failed to hold 8/21 EMA - sentiment is changing. Finally, when sellers managed to erase all intraday gains and broke down 3-days support - strong signal that sellers are in control.
Many traders waited for such type of sell off that suddenly took place. Today, in media we will see many articles with fears across the board. They will be screaming that price found its top and now it is going to pullback 10% off the highs. But let be objective. Price just closed below 8 EMA. And before this boom scenario will come into play price should go through 21/50/100/200 EMAs. I think that we will see new highs this year, but question is what will happen first - pull back lets say to 50 EMA or new recor high. This red reversal candle is definitely something to take notice for short term active traders who open their positions intraday or for few days. We can expect 2-3 days of continuation down move and then will measure.
I mapped out levels of support and resistance where to make adjustments/take decisions. If sellers want to be in control they don't want to give back $195.27 8 EMA, then we have high at $196.50. And break below intraday low $194.48 could lead to $193.95 21 EMA. Then we have potential support - swing low from 12 of June at $193.11.
Intermidiate target could be $191.28 50 EMA.
I have three scenarios ni my had to game plan today's action.
#1: Price will bounce off of yesterday's low. High probability strategy will be buying leaders that show relative strength: $MSFT, $INTC, $NFLX, $FB, $YELP, $JPM, $WFC, $TSLA, $DDD, $FSLR are some of them.
#2: otherwise, if SPY will go through low then I will consider short stocks that show relative weakness: $BA, $GE, $AAPL, $IBM, $C.
#3: market opens higher then will sell off.

SPY short term down scenario with levelsSPY covered part of losses after drop down on Thursday. Looks like buyers don't want to give up. I am oging to measure sentiment with Fibonacci levels. This bounce wasn't so strong as it is only 38%-50% from the move from highs. If sellers will hold $194.20ish, then $194.60-.80 then with high probability I expect move through low $193.11 to the next potential support at $192.50 where 21 EMA on daily chart is situated.

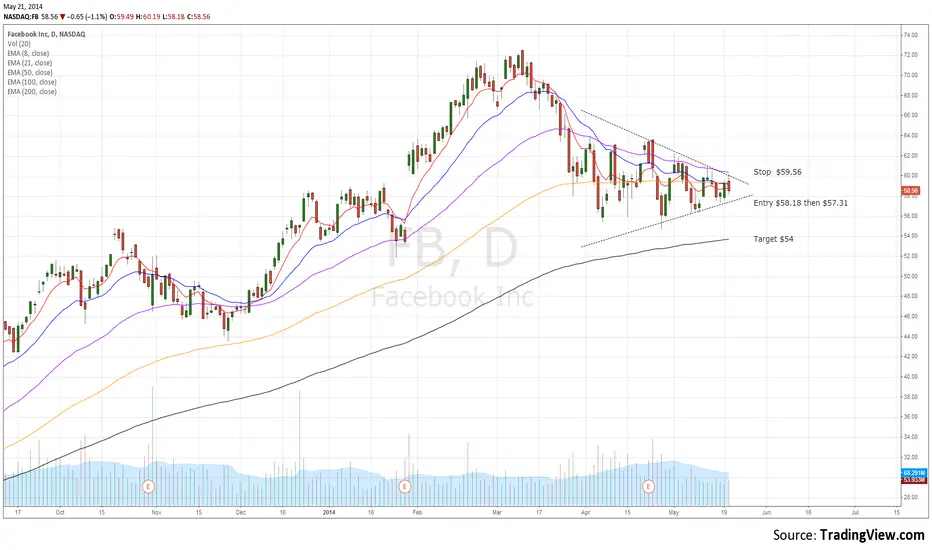
Facebook tight consolidation prepares to resolveFacebook (FB) in the morning went through previous high at $59.56 but than reversed and gave us tactical entry with Short option. That was point where you make adjustments and should react quickly as market stays in range-bound mode.
After it came from $20s to $70s and then was sold off to mid $50s it enetered into wedge/range and recent action became very tight. I expect that it will resolv soon and will take breakout trades both sides.
Today, my plan is to trade with Short below previous low of the day at $58.18 and I expect to see some downside continuation. I have slight bias to downside as most of my moving averages curling down but it still stays above 200 MA ($54).
You should count overall market conditions. If it will confirm our selling idea then I am going to execute this trade.
CTXS laggard play, looking for move through 200MABig Picture:
US markets are strong, so I like long ideas. Despite, this stock looks weak I think if market break up failure scenario will come into play money will rotate from stocks that are on highs to underperforming stocks. And if market will continue showing strength momentum will cautch up this stock as well.
This technology company grew up from $20 since early 2009 and found top in 2011 at $88. From then it entered into big consolidation wedge with bottom close $50 (aorund half of that big igniting move) means that long term investors still control price action.
Short Term tech analysis:
Stock gapped up $59.46 on earnings on 24 of April, sold off from 200 MA but bounced off from shorter term moving averages with pivot low at $57.77.
Right now, it is in front of 200 MA building nice upper level base.
Trade Plan:
I like entry here at $60.37 with stop below $57.77. Break up and close above 200MA could lead to $62.25-$63.44 resistance zone, then we have gap down pivot point at $66.48.
Macro target is mid $70ish area - top of wedge.

BTCUSD: Global Support Holds; Local Trend Reverses (by May 22nd)
As everyone knows, except for in the most cataclysmic of circumstances, long-term trend signal always trumps short-term fluctuations, in a stochastic dynamical system. If that rule is being violated, the reasons are likely psychosomatic.
•Empirically, there has been an exponential, global, lower bound of support buffeting Bitcoin's long-term uptrend against overall demise, (approximated in this logarithmic scaling by a GREEN↗DASHED trend-line). Over the next 2–4 weeks, it will be determined whether that support is ultimate. With only the assumption that this will indeed hold, in this chart I suggest that another major short-term crash ≤ $400 thus becomes extraordinarily unlikely —even if the local downtrend (RED↘DASHED trend-line) were to continue in the same spirit it has been occurring previously (see purple illustration and its dotted↘line companion beneath, outlining best 'worst-case' trajectory)— as there would not be sufficient time to re-establish the long-term recovery.
•Additionally, the "TIME BETWEEN LOCAL CRASHES" —apologies for the 'anchored' text element.— in this cycle has generally stayed on the order of months; thus, even if this period were shortening, assuming a consistent ratio of decay, it would take ~29 days (i.e. until 05/10/2014) for some next hypothetical crash to occur —a purely statistical argument— which, again, would be beyond the stated recovery bound, thus I must discount that possibility under the conditions of the scenario.
•I've quoted $449 with a BLUE—BAR here to indicate an approximate convergence of the 'reversal zone' (i.e. where the right-most CYAN┊VERTICAL intersects the PURPLE↘DOWN-trend), which extends to the $400 RED━BAR line for clarity. In order to stay on target for recovery via the momentum of the aforementioned global uptrend, the downtrend must begin to show signs of local reversal somewhere within said region.
•Deflection Triangle: To help visualize the arrival of a reversal across 05/09/2014–05/16/2014, as compared to the recent self-similar 'fractal' behavior, look for there to be a deflection away from the center of triangular region formed from the intersection of these three lines: {GREEN↗DASHED, PURPLE↘DOTTED, BLUE—BAR}, as thise would have been the otherwise expected zone of continuance on the original downtrend. By May 22nd 2014, it will be clear we are leaving the ↘ we've been in since December, marking the global uptrend to resume.
To read about my expectations for what will happen after this prediction comes to pass, see my idea entitled "EPOCH 3: A 60-Week–Long Bubblecast", (which is linked to this chart).

