Search in ideas for "CANDLESTICK"


Candlestick SrengthCandlestick Formations form part of technical price charts, which are are used by market participants to interpret current demand-supply dynamics, potential price trends as well as form decisions from these inferences. The tables below highlight the following: (1) The share code (2) the candle's 'change from open’ (over 1 session) i.e. from the start of the first hour of the trading day to the end of the last hour of the trading day'. This is used to determine the strength/weakness of the candle formation i.e. the greater (+) the percentage, the stronger the candle formation and the weaker (-) the percentage, the weaker the candle formation and (3) the share's short term technical rating i.e. which phase the share is in over a 7 day period.

Candlestick Patterns..Doji Pattern (Standard) in the market. For FMI (Forex Mastery Institute ) studies homework...

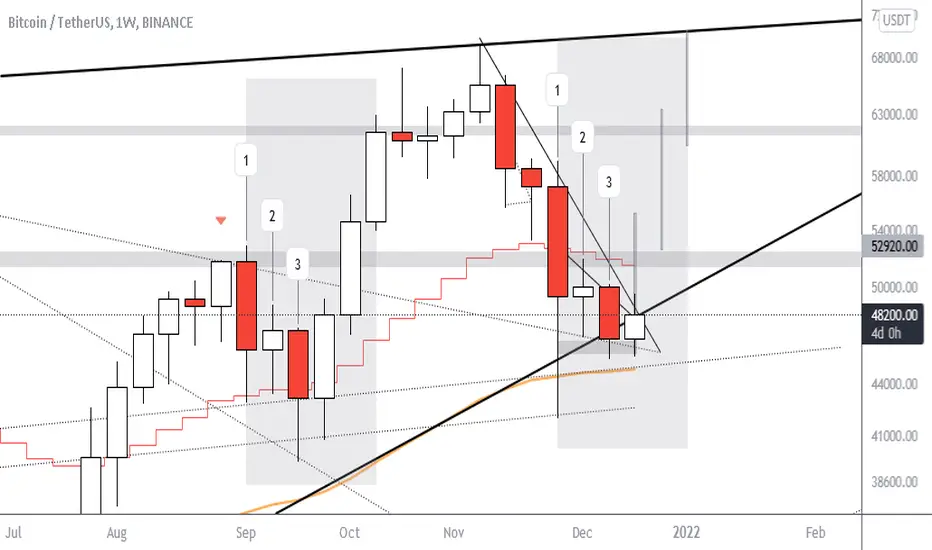
Candlestick Fractal on Bitcoin Weekly ChartAs we see bitcoin is repeating a fractal of that latest dip on the weekly chart. If the next candles follow the pattern and maintains the fractal bitcoin can regain its ATH level in three weeks
CANDLESTICK PATTERNS EVERY TRADERS NEED TO KNOWHello traders, investors! Like & Follow for more. Thanks for supporting!

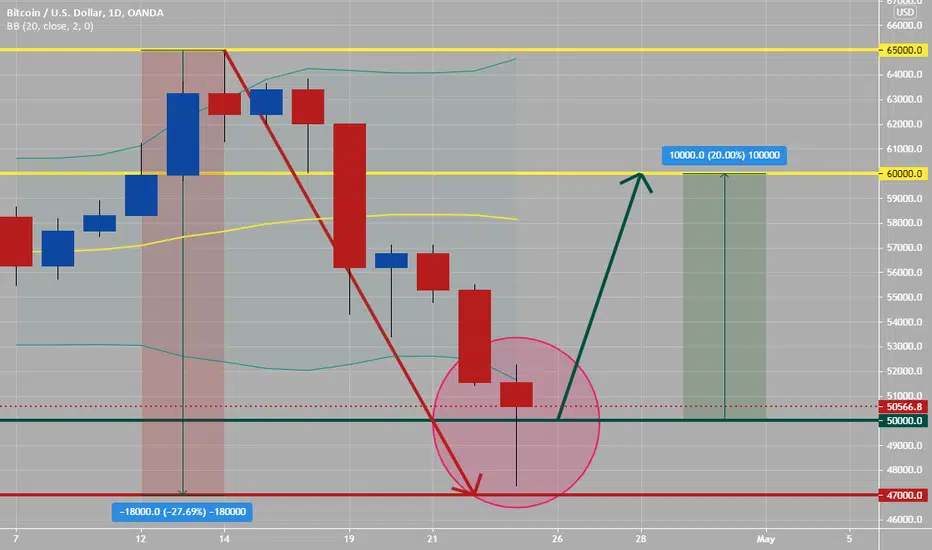
Candlestick Patterns (Every Trader Should Know) HammerBTCUSD daily had made a hammer on Friday after a $18,000 drop within the last two weeks in price action.
The hammer puts in its appearance after prolonged downtrend. On the day of the hammer candle, there is strong selling, often beginning at the opening bell. As the day goes on, however, the market recovers and closes near the unchanged mark, or in some cased even higher. In these cases the market potentially is “hammering” out a bottom.
In order for the Hammer signal to be valid, the following conditions must exist:
• BTCUSD must have been in a definite downtrend before this signal occurs. This can be visually seen on the chart.
• The lower shadow must be at least twice the size of the body.
• The day after the Hammer is formed, one should witness continued buying. * I except buying after BTCUSD opens, related to huge drop in price action of late and the formation of this daily hammer on Friday. (Note) I do not trade this, but follow it in relation to affects on Forex pairs, gold, oil..etc...
• There should be no upper shadow or a very small upper shadow. The color of the body does not matter, but a white body would be more positive than a black body.
I except last week of April to be bullish for BTCUSD and might go up $10,000 or to 60,000 level noted on chart. Good luck and use risk management always.
Evening Star VS Strange Piercing LineCandlestick Analysis: Evening Sar VS Strange Piercing Line
UKOIL Tries to Escape From declination channel...


GBP/JPY: Sell on rallies Candlestick Pattern- Doji
Major support- 148.60
GBPJPY has once again declined after hitting high of 149.48. This is the fourth time crossing above 149 (149.71,149.42,149.51,149.48) and declined from that level. It hits low of 148.60 and is currently trading around 148.63.
Short term trend is weak as long as resistance 149.70 hods. Any violation above targets 150/150.95 level.
On the lower side, near term support is around 148.60 and any break below targets 148/147.30 (200- day MA). Any daily close below 147.30 confirms bearish continuation.
It is good to sell on rallies around 148.65-70 with SL around 149.70 for the TP of 146.35..


Candlestick Analysis
The last 3 weeks have been interesting for EURGBP. Price formed 2 pin bars with a bullish engulfing candle in between. This shows us the selling pressure was coming however bulls tried to take over. Bulls failed to even break resistance at first and they tried again last week but the bears came in even stronger this time closing the candle below the last open. We are now waiting for a solid break of support level for a 290-pip short position


Modest Profit Potential on PFE Pfizer Remains - $30-$33 TargetEnhance your trading skills with valuable insights into swing trading strategies and candlestick patterns. Don't miss out on unlocking your profit potential! 📈 #SwingTradingStrategies #CandlestickPatterns #BullishEngulfing #HowToReadCandlestickCharts

Weekly Candlesticks: Shooting Star and ConfirmationSellers came to play in the last two weeks, forming a classic shooting star doji two weeks ago followed by a confirmation candle last week. Given the time period, this is extremely strong evidence of a near term pullback. Unless some unforeseen news breaks in the next week or two, I am forecasting a couple of tough weeks for the stock with a draw down to $300.

LAZR Luminar Technologies: Bullish Wedge Breakout on the HorizoLuminar Technologies (LAZR) is poised for a breakout from its bullish wedge. Following earnings with a slight EPS miss and Tesla news, we saw a rally. Currently, we're testing support around $1.60. Holding $1.60 and breaking $2.29 are crucial for the bull trend. The real short squeeze could occur above $2.50-$3. With VIX levels to watch at $15-$17.50, stay tuned for potential price action in the coming weeks.
YT/RMBLE: CANDLESTICKNINJATV

VIX to $17 Soon for another key trend line resistance test!Ensure you hedge your trades and know your maximum loss and profit, especially if you have limited funds to dollar cost average or are trading options.
For informational and educational purposes only, I prefer buying laddered call options on UVIX (1.5x), VXX (1x), and UVXY (2x) at sub-$13 levels over 2-4 weeks that align with my long "risk on" call expirations. This way, I can sell the pops and use the proceeds to add to my most committed "risk on" positions.
Good luck!
@candlestickninjatv

LAZR Focused on a $1.50 breakWhen the vix BREAKS $15 and we break $1.50 we fly on LAZR Luminar Tech.
High lending rate on options, margin accounts, 32 days to cover and 26% short vs interest float on LAZR and 45-50% off exchange shorting.
Lets go! CandleStickNinjaTV

Got the "Tap" of .618 we needed, get ready!candle was enough to get a profit taking dip today, but is NOT a bearish piercing candle as it does not encroach 50% into the body and it has a bullish bottom wick.
The retracement that happened today to .618 from our 1.20 lows was exactly .618
Many may call today bad, but no way was it, we did the neccessary 4% drop we needed today to hit said levels.
CandlestickNinjaTV on YT

LAZR to $1.34/$1.35 then off?LAZR seems to be plotting a distorted triangle and we are close to .618 and have technically tested it already, we may hit 1.34 again and then rise.
P.S. Squeeze figures are still in range, 27%, 15 days to cover +/- 1-2 days which is immaterial at double digits, and 53%+ off exchange dark pool shorting.
Info and Educational Purposes Only.
CandlestickNinjaTV on YT
GLTA!

SMCI Strong over short run to $1000 psych but beware!SMCI Strong over short run to $1000 psych but beware! We may make it to $1,100 or about 1,096 where the .618 fib level is from teh recent short term fall, but zooming in the .382 rise to $1000 has a confluence of one of the trend line resistance areas! CandlestickNinjaTV on YT
