#WEEK03 Candlesticks Morning DojiFurthermore Gold has Printed Doji Pattern on Daily Time frame we will take SHORT position with H of the WICK as SL.
Search in ideas for "CANDLESTICK"

#WEEK03 Candlesticks Inverted HammerGold Earlier Printed Inverted Hammer on 1H time frame.
so I believe we will take a SHORT position here with Wicks high as SL.

#WEEK03 Candlesticks Morning DojiCurrency has made Morning Doji position on 1H timeframe.
if the next Candle is marked Green, We will take buy position with Low of morning Doji as SL.

#WEEK03 Candlesticks Tweezer Bottom pattern was generated on one-hour time frame and after that it grew really well in bullish trend

3 different scenarios for BTC !!!Based on the daily candlesticks, I came up with 3 different scenarios for Bitcoin, which, based on price and time period, determine which path is going to be taken. I hope this analysis helps you. I would appreciate receiving your comments.

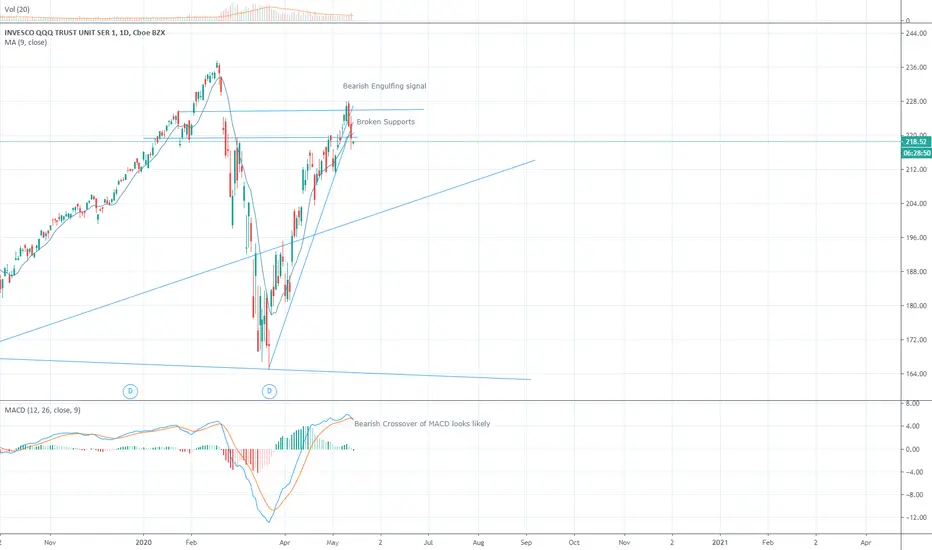
QQQ Broken supports, Bearish behaviorQQQ met resistance in the ~227 area and a bullish engulfing signal has formed. Supports seem to have broken at the top. The MACD looks close to a bearish crossover. Due to unemployment and the rise of severity in the current climate, I estimate a downtrend to continue, though, from this, a short downtrend is the only thing I can draw from the technical analysis.
Any thoughts? Trying to incorporate more aspects into the technical than solely candlesticks, MACD bearish crossing seems a bit grim here.
Bitcoin Appears to Have Bottomed (simple analysis technique)Almost the entire cryptocurrency complex rebounded today, following two days of heavy selling. The appearance of one of my favorite (and only) chart patterns I pay attention to gives me the confidence to write this note. I've been trading the markets since 1995, and in that time I've realized that there is vastly more "technical analysis" that DOESN'T work, than does. One of the few things you can have confidence in the markets is the appearance of a HAMMER candlestick pattern following a sell off. And there seems to be a logical explanation for its formation. Markets are made up of small investors and huge institutional investors, market makers, hedge funds, and other large investors. These well-connected investors tend be better informed than those of us little guys. There is a vast amount of information available on the internet for the HAMMER candlestick, but I will briefly summarize it by saying that it is a candlestick with the open, high, and close, all within relatively close distance to each other, and a long tail for a LOW of the day. Essentially what is happening is large investors are purposefully forcing the price down taking out stops as it plunges. They are essentially picking up cryptocoins (or whatever it is you're trading) on the cheap! After they have accumulated the available supply at low prices, the price is forced back up. The more thinly traded the market, which cryptocurrencies are, the more the technique works. That's why I've highlighted a number of them here on the chart. It's a strategy works, and will continue to work--until it doesn't. ;)

Finally some USD Shorts to look forward toWeekly candlestick forms a nice hanging man. What makes this an interesting candlestick pattern is the way it gapped up before closing lower.
Secondly, the price level of 94.76 is an unfilled down gap from 22/09/2003.
The US Dollar has enjoyed a rally for quite some months, to the point that USD long position has become a boring proposition. So we're looking for a change of trend.
Best course of action is to wait for this week's candlestick to close bearish for confirmation or look for daily charts bearish candlestick pattern for an earlier confirmation.

Candlestick!📊📉No trader knows the plan of the candlestick, but when open a trade they are 100% sure that candlestick will go UP/DOWN direction 💱📈

Energy Sell Off - Low RSI Not Seen Since CovidWatch energy to see if it bounces off these levels as the selling pressure over the last two weeks has been relentless with no bounces. Possible Bullish abandoned baby candle if tomorrow is a large up candle.
Understanding the Bullish Abandoned Baby
Traders watch for bullish abandoned baby patterns to signal the potential end of a downtrend. The pattern is fairly rare as the price movements need to meet specific criteria in order to create the pattern:
1. The first bar is a large down candlestick located within a defined downtrend.
2. The second bar is a doji candle (open is approximately equal to the close) that gaps below the close of the first bar.
3. The third bar is a large white candle that opens above the second bar.

Buy above candle APPLBuy above candle APPL. This is the daily green giant candlestick strategy. It basically consists of the trade signaling when price breaks above this one candle.

SPY evening star setupFor those of you who understand candlestick patterns, this is not news to you.
The weekly SPY is setting up an evening star formation. It's a bearish setup on a weekly chart. More importantly, it should be noted as a false breakout (if we close near current levels)

Super rejection and selloffSUPER has rejected the golden fib and printed the three black crow candlestick pattern. This is generally pretty bearish. With an over-heated BTC I expect this to continue unless they drop some random bullish news. The token is up over 10x in a few short week. I expect a pullback to 90 cents for some retesting of prior support.

Small cap value breaks outAvuv is my preferred small cap value ETF for my long-term account. I had been adding to it during the range lows the past several months. This is a strong breakout with the overall market trend. Value tends to get forgotten about when tech rallies like it did this year. Will we see a major buying opportunity for value in general next year? I think so. TA wise we see a clear three white solider candlestick pattern (very bullish).

Sensorium (SENSO) / BTC - A rewarding candlestick patternThe pattern of candles highlighted is a favourite of mine. You don’t often see such a clear example in the charts, but when you do..
If you’re new to trading / active investing, this is one to put in your notebook. No matter the chart study, stocks, crypto, price of fish cakes in Hong Kong, it works every time on all time scales, the weekly is partially powerful.
On the above weekly chart a battle of psychology between bears and bulls is playing out. Why is this pattern significant?
Candle by candle starting from ‘1st candle’
1) The bears stepped in, they pushed price down closing the week lower than it began with significant pressure, hence red candle.
2) The bears stepped in again and closed price action lower than the week began. But two things have changed from the previous week:
2a) The wick is lower, indicating sellers are weakening.
2b) The body of the candle is thinner. This tells that despite all the selling pressure of the bears, the bulls matched it.
3) At this point you start to see something significant. A very thin body with a long wick above. This candle is called a ‘morning star’ and is confirmed with a ‘green candle’ in the following trading session, which we have. The psychology here is the bulls entered deep into the bears territory with not as much resistance as the previous session.
4) The first green candle. A ‘indecision candle’. The bears are confirmed ‘exhausted’, bulls closed price action higher than the previous trading session.
5) This is where is becomes mega interesting. The buying pressure soaking up the bears sell orders has not gone away. So what happens next when the bulls step in again without the selling pressure? Kaboom.
Print it out and hang it up somewhere!
WW
Is there any examples? Sure:
Here is a weekly dollar chart on something called Dragonchain:
And again the AAVA dollar chart before going on a 200000% bull run.

AAVEUSDT patternPrevious candlestick pattern looks it will dump to around $130-140 range and pump from there.

NZD/USD Massive Sell Opportunity The last time there was a green monthly candlestick with no bottom wick was June of 1990. It is highly unlikely for there to be no bottom wick for July 2023. If it trades down to form a monthly bottom wick and closes near there, it will be a massive sell opportunity to trade down much lower and very quickly.

GBPJPY 30/3/2023 Thu LD SessionPre-LD market analysis
wait for 30m candlestick close for confirmation

sell USD JPYcome down USD JPY according candlestick power.
farsi
man be tor akhtesasi jpy va aud ra car mikonam
agar comaki mikhastid mitoonam comaketon konam

EUR USD - Weekly AnalysisEUR USD closed this weeks candle as the classic "Hanging Man" Japanese candlestick pattern.
On its own, it doesn't provide any sort of trade trigger. But it does, however, give me something to look for on next weeks candle close.
Confirmation to go short based on this hanging man candle would happen if next weeks candle closes below the real candle body of the hanging man (below 1.06444).
Confirmation is needed to trade hanging man candles due to the bullish implications of the long lower wick. Waiting for confirmation will show that the bears are indeed in control, and I can then look for somewhere to enter short based on the H4 structure.

Camdlestick Patterns - weekly chartOn a weekly basis, some Japanese candlestick patterns look quite reliable.
In this example: a 3-inside-down pattern, a hammer, and a shooting star. Even some Bullish Engulfing Candles! Can you see them?

HUL Bearish HUL shown bearish in D time frame by formation of Evening star candlestick pattern & RSI shows weak
#Education Purpose

Key tests coming on SPX, IWM and NDXRecently, across all major market indices, the market has entered bullish trading channels, and is trading above the 14 day, 50 day, 100 day SMA, however, yesterday, bears took over the market, resulting in bearish candlestick reversal patterns happening in the S&P 500, Russell 2000 and Nasdaq. In the market, many stocks have had breakouts and gaps this past week, which can easily be reversed and filled, so today's trading will give a good indicator of the strength of the trend.
